

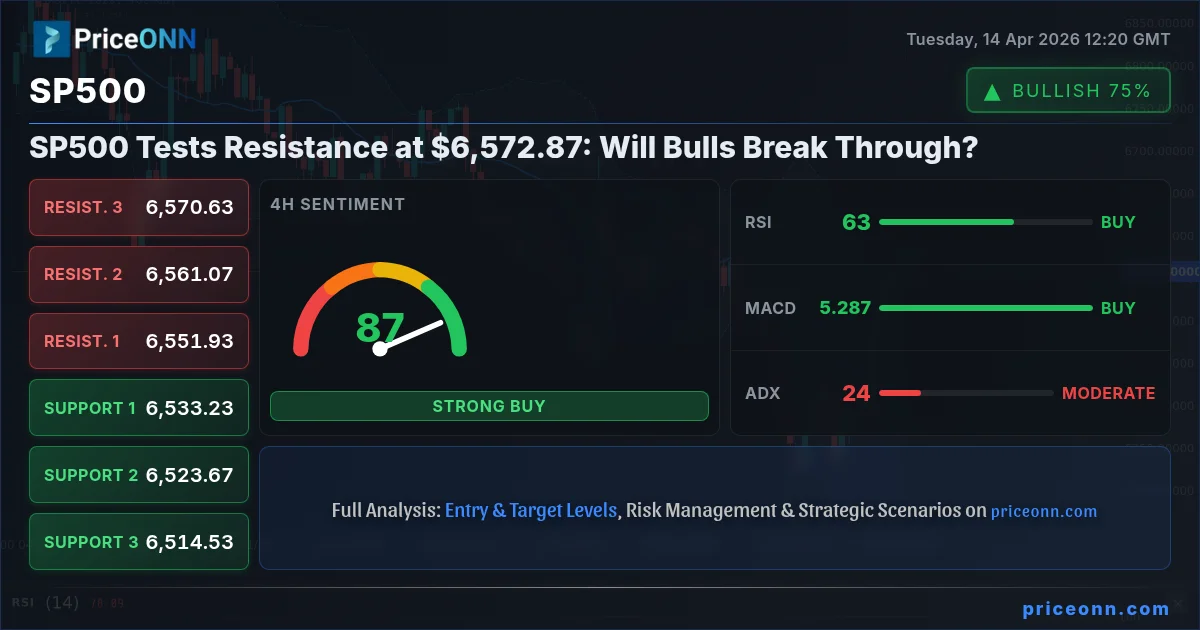
The S&P 500 (SP500) is currently trading at $6,572.87, finding itself at a crucial resistance level that traders are watching closely. This price point is more than just a number; it represents a significant psychological and technical barrier. As bulls push higher, the question on everyone's mind is whether this rally has the momentum to break through the overhead resistance or if it will falter, leading to a potential pullback. The current market sentiment, driven by a complex interplay of economic data, central bank expectations, and geopolitical undercurrents, suggests that the path ahead is far from clear. This analysis will delve into the multi-scenario outlook for the SP500, examining the conditions that could propel it higher or send it lower, and what key triggers investors should be monitoring in the coming days.
- The SP500 is currently trading at $6,572.87, testing resistance levels around $6,580.
- RSI (14) is at 70.95 on the 1H chart, indicating overbought conditions that could lead to selling pressure.
- ADX at 49.72 on the 1H chart suggests a strong trend is in play, but its direction is being tested.
- The DXY is at 97.78 and declining, potentially offering some support to risk assets like the SP500.
- Key support for the SP500 lies at $6,568.73 (R1), while resistance looms at $6,577.27 (R1).
The Bull's Roadmap: Clearing the $6,577.27 Hurdle
For the bulls to maintain control and push the SP500 higher, a decisive break above the immediate resistance at $6,577.27 is paramount. This level, identified as R1 on the 1-hour chart, has acted as a ceiling in recent trading sessions. A sustained move above this price, backed by increasing volume and positive market sentiment, could signal the continuation of the upward trend. The 4-hour chart shows a strong uptrend with ADX at 26.32, suggesting underlying strength, although the RSI at 62.83 is in neutral territory, leaving room for further upside. If this bullish scenario unfolds, the next significant target would be the $6,589.83 level, representing the R2 resistance on the 1-hour timeframe. Beyond that, the psychological barrier of $6,600 and the 1D resistance at $6,605.07 would come into focus. This path is supported by a weaker US Dollar Index (DXY), currently trading at 97.78 and showing a downward bias on the 1-hour chart. A falling DXY typically correlates with increased risk appetite in equity markets, which could fuel further gains for the SP500.
However, the technical indicators present a mixed picture that warrants caution. While the 4-hour chart shows a generally bullish trend with an ADX of 26.32, the 1-hour RSI at 70.95 is entering overbought territory. This suggests that the recent rally might be losing steam and could be due for a short-term correction. The Stochastic oscillator on the 1-hour chart, with K=65.73 and D=73.5, further reinforces this by showing a bearish crossover (%K
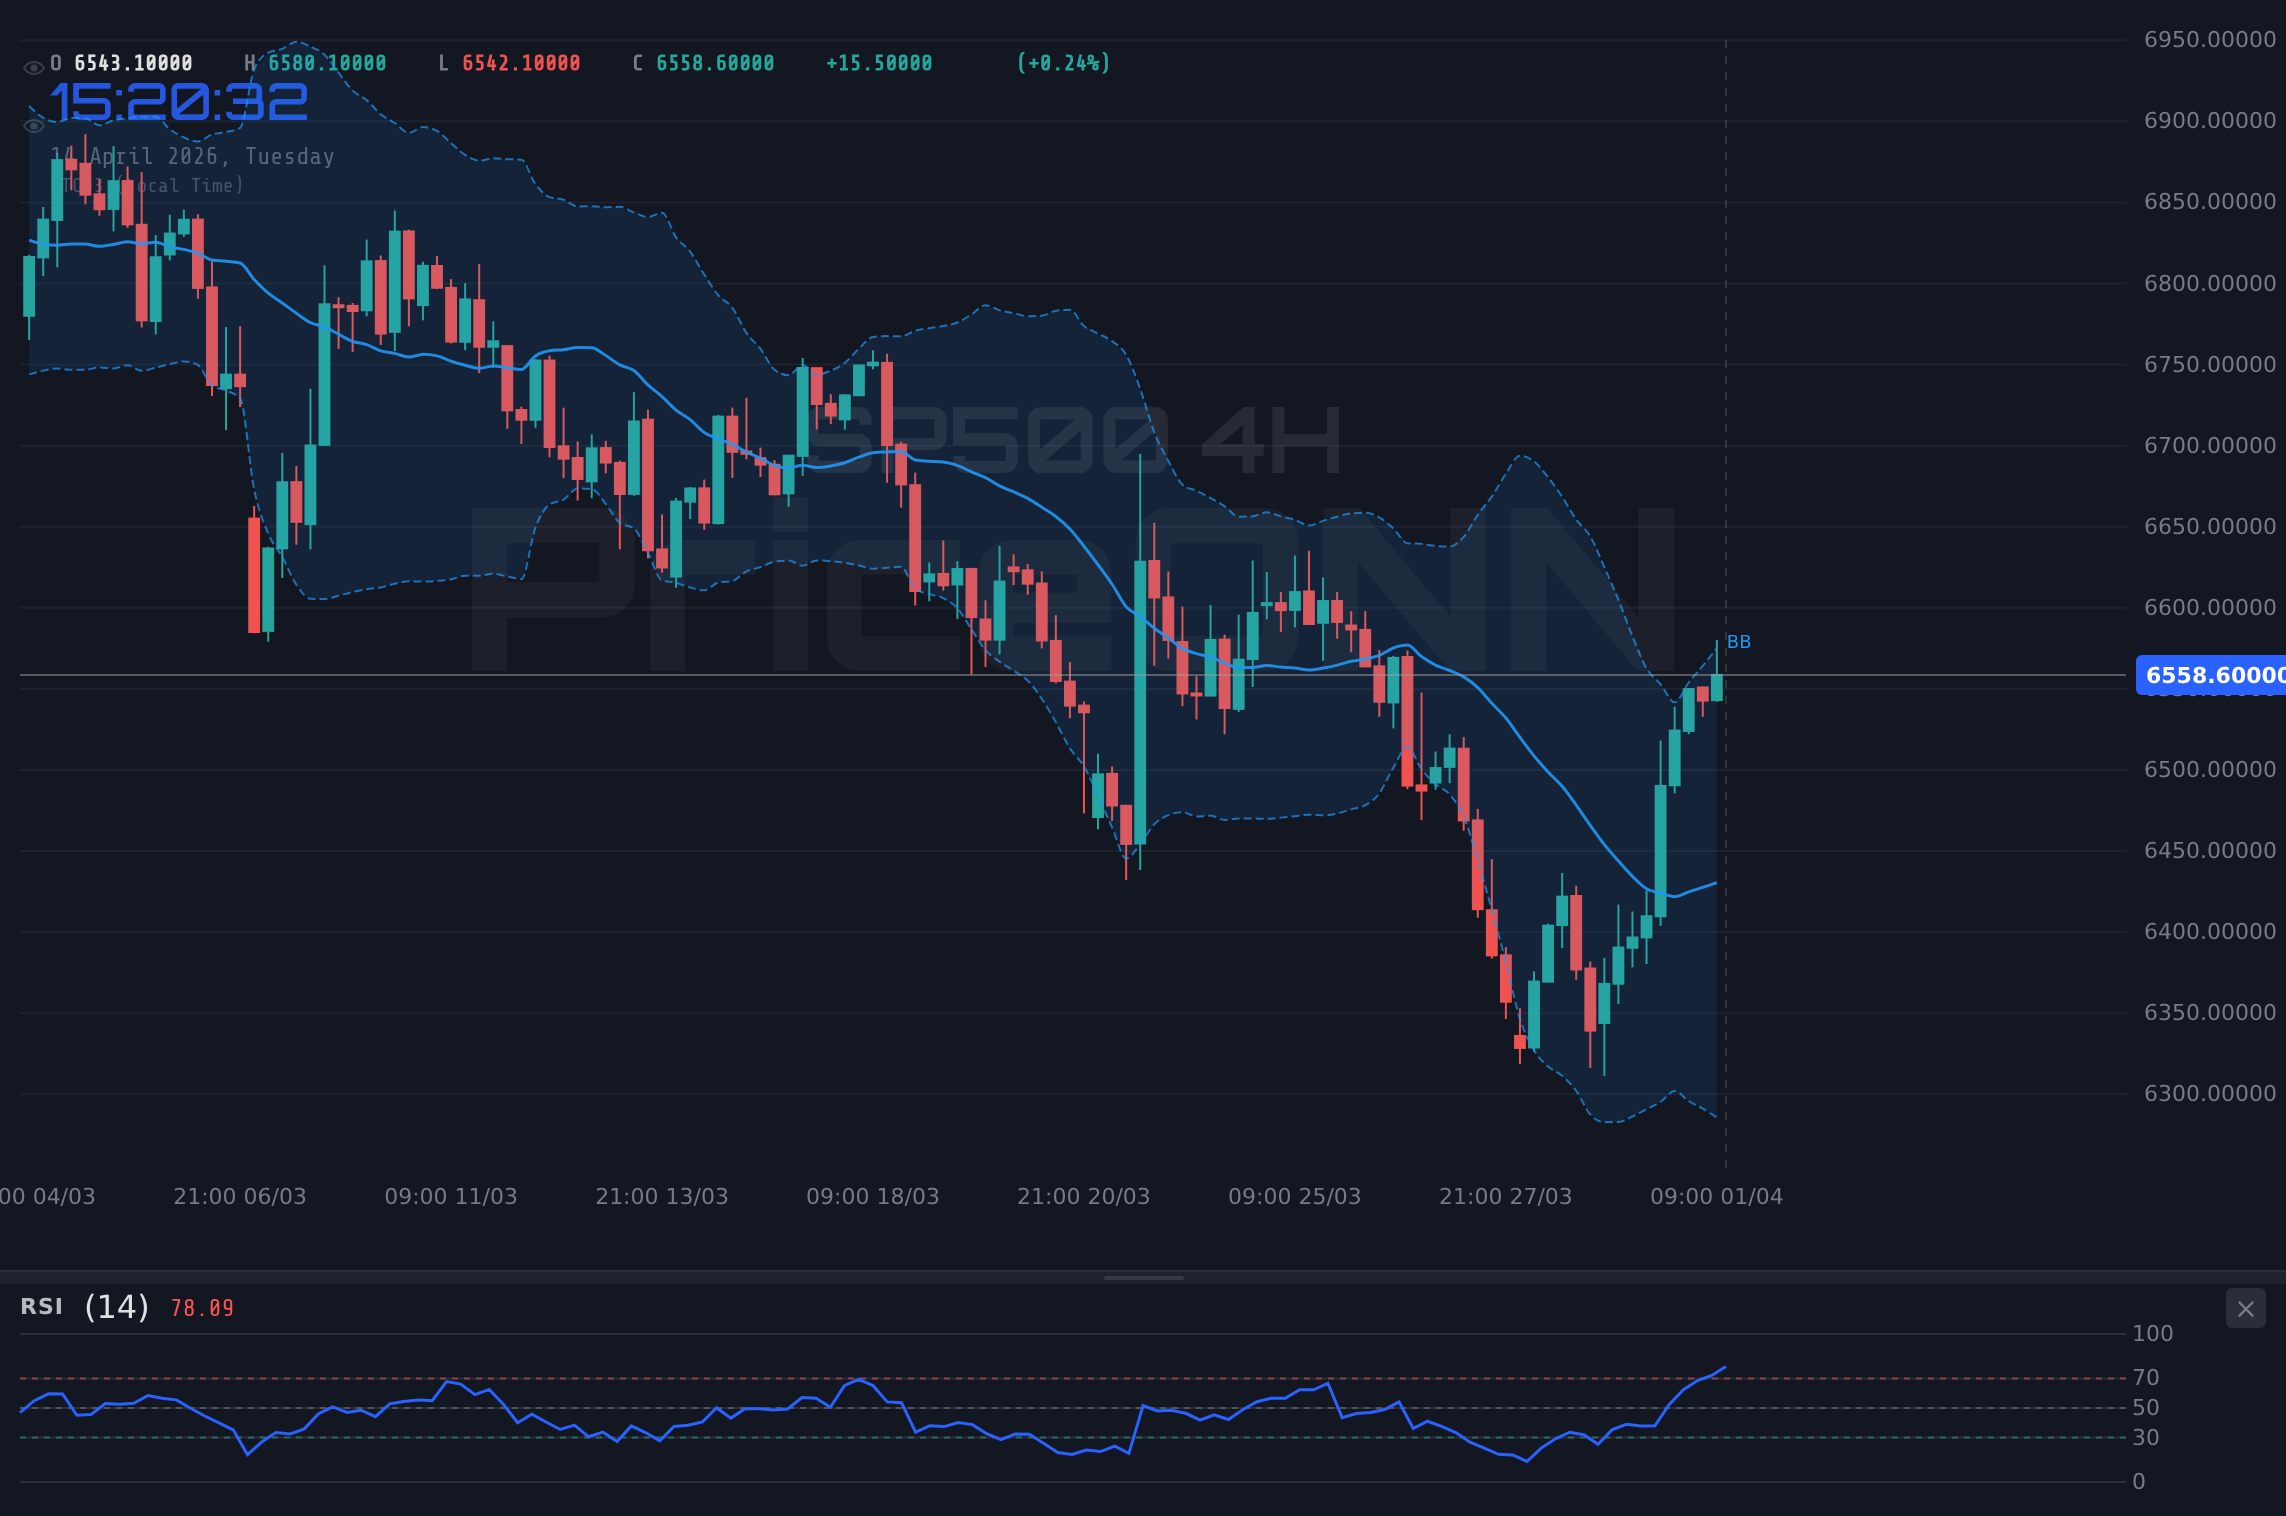
The confluence of a strong trend on the 4H chart (ADX 26.32) and a weakening Dollar (DXY at 97.78) provides a favorable backdrop for bulls. However, the 1H RSI at 70.95 is a flashing warning sign that a pullback is possible before any significant upside continuation.
Where Bears Take Control: A Test of $6,568.73 Support
Conversely, if the SP500 fails to break through the $6,577.27 resistance, the bears could seize control, driving prices lower. The immediate support level to watch is $6,568.73 (R1 acting as S1 on the 1H chart), followed by $6,547.63 (S1 on the 1H chart). A decisive break below these levels, particularly on increased volume, would signal a bearish shift in market sentiment. The 1-hour chart's ADX at 49.72, while indicating a strong trend, could also signal a strong trend reversal if key support breaks. The RSI at 70.95, already in overbought territory, could quickly reverse and head lower, confirming the bearish momentum. If the bears manage to push the index below $6,547.63, the next target would be the $6,535.07 level (S2 on the 1H chart).
The daily chart presents a more challenging picture for the bears in the short term, showing a neutral trend with an RSI of 50.81. However, the ADX at 26.89 on the daily chart indicates a strong trend, which could accelerate a move if the support levels break. The Stochastic on the daily chart shows K=42.97 and D=29.88, with %K > %D, suggesting potential for a bounce, but this is secondary to the immediate 1H and 4H signals. The primary driver for a bearish move would likely stem from a strengthening US Dollar (DXY) or negative economic news. For instance, if upcoming inflation data (CPI) or employment figures (NFP) come in hotter than expected, it could prompt a hawkish shift in Fed policy expectations, leading to a risk-off environment that would pressure the SP500. Such a scenario would see the index testing lower support levels, potentially down to $6,526.53 (S3 on the 1H chart) and beyond.
The 1-hour Stochastic crossover (K=65.73, D=73.5, %K
A failure to hold support at $6,568.73 could lead to a rapid decline. The RSI at 70.95 suggests the market is ripe for a reversal if key levels break, making tight risk management essential.
The Waiting Game: Consolidation Above $6,572.87
In the absence of a clear catalyst, the SP500 could enter a period of consolidation, trading within a defined range. This scenario typically occurs when bullish and bearish forces are in equilibrium, or when the market is digesting recent price action and awaiting new information. In such a case, the index might oscillate between the current price zone around $6,572.87 and the immediate resistance at $6,577.27, with support found near $6,568.73. The neutral trend on the 1D chart (Power: 50%) supports this possibility. During consolidation, technical indicators often provide conflicting signals, making it difficult to establish a clear direction. For example, the 1-hour RSI is in overbought territory, suggesting selling pressure, while the Stochastic shows a bearish crossover. However, the 4-hour chart maintains a more bullish outlook with an ADX of 26.32, indicating a potential for a breakout in either direction.
The key to a consolidation phase is the lack of conviction from either buyers or sellers. This could be influenced by upcoming economic data, such as the Consumer Price Index (CPI) or Non-Farm Payrolls (NFP), which might not provide a definitive direction, or by market participants waiting for clearer signals from central banks. The DXY's current downward trend could provide some underlying support, preventing a sharp sell-off, but if it reverses course, it could trigger volatility. For traders, a range-bound market often presents opportunities for range trading strategies, buying near support and selling near resistance, though the risk of a breakout remains.
The ADX reading of 49.72 on the 1-hour chart is notably high, which could suggest that any consolidation phase might be short-lived, with a strong trend likely to emerge once a breakout occurs. The market is essentially in a holding pattern, with traders and investors weighing the positive momentum from recent gains against the overbought conditions and the looming resistance. Patience is key in this phase; waiting for a clear break above $6,577.27 or a confirmed drop below $6,568.73 will be crucial for identifying the next significant move.
The market is currently exhibiting a 'wait-and-see' attitude. Bulls are hesitant to chase price into resistance, while bears are cautious about shorting near potential support zones.
The Most Likely Scenario and Key Triggers
Considering the current technical and market landscape, the most probable scenario for the SP500 in the immediate short term (next 24-48 hours) appears to be a consolidation phase with a slight bearish bias, leaning towards a potential retest of support levels. This is primarily due to the overbought RSI (70.95) on the 1-hour chart and the bearish Stochastic crossover, which often precedes a pullback, even within a broader uptrend. The resistance at $6,577.27 is significant, and without strong fundamental catalysts, breaking it decisively might be challenging. I would assign a 60% probability to a consolidation/retest scenario, a 25% probability to a bullish breakout, and a 15% probability to a sharp bearish decline.
The strength of the trend indicated by the 1-hour ADX at 49.72 suggests that if a move does occur, it could be significant. However, the conflicting signals between the 1-hour overbought conditions and the 4-hour bullish trend create uncertainty. The upcoming economic calendar will be critical. Key events to watch include any speeches from Federal Reserve officials, which could provide clues about future monetary policy, and any significant shifts in the geopolitical landscape. For instance, news regarding US-Iran relations or trade talks between the US and China could quickly alter market sentiment and trigger a move away from consolidation.
The correlation with the DXY is also a vital factor. If the Dollar Index reverses its downward trend and starts climbing again, it would likely put pressure on the SP500. Conversely, continued dollar weakness could provide the necessary tailwind for bulls to eventually break through resistance. The key triggers to watch will be: a decisive close above $6,577.27 on strong volume, a clear break below $6,568.73, or any significant news impacting Fed policy expectations or geopolitical stability.
Bearish Scenario: The Sell-Off Continues
60% ProbabilityNeutral Scenario: Range-Bound Trading
25% ProbabilityBullish Scenario: The Breakout
15% ProbabilityWhat I'm Watching This Week
The SP500's path forward hinges on several key factors that I'll be closely monitoring:
- Price Action at Key Levels: The immediate focus is on the $6,577.27 resistance and $6,568.73 support. A decisive break with conviction and volume will be the primary signal.
- DXY Movement: The US Dollar Index's trend is crucial. A continued decline would support risk assets, while a reversal could signal trouble for the SP500. I'm watching if DXY holds below 97.75.
- Upcoming Economic Data: Any surprises in inflation or employment figures could significantly shift Fed rate expectations and, consequently, market sentiment towards equities.
Frequently Asked Questions: SP500 Analysis
What happens if SP500 breaks above $6,577.27 resistance?
If the SP500 decisively breaks above $6,577.27 with strong volume, it could signal a continuation of the bullish trend. The next targets would be around $6,589.83 and potentially the $6,605.07 level on the daily chart. This scenario is more likely if the US Dollar Index (DXY) continues to weaken.
Should I buy SP500 at current levels of $6,572.87 given the RSI at 70.95?
Buying at $6,572.87 carries risk due to the RSI at 70.95 indicating overbought conditions on the 1-hour chart. While a breakout is possible, a pullback is more probable. A more prudent approach might be to wait for a confirmed break above resistance or a dip towards support levels like $6,568.73, coupled with confirmation from other indicators.
Is the RSI at 70.95 a sell signal for SP500 right now?
An RSI of 70.95 on the 1-hour chart suggests overbought conditions, which historically can precede a short-term pullback or consolidation. However, it is not an immediate sell signal on its own, especially if the broader trend remains bullish. Confirmation from price action breaking key support levels or bearish signals from other indicators like MACD or Stochastic would be needed for a strong sell indication.
How will upcoming economic data affect SP500 this week?
Upcoming inflation (CPI) and employment (NFP) data releases are critical. Stronger-than-expected data could lead to hawkish repricing of Fed rate expectations, potentially causing a risk-off move and pressuring the SP500 downwards. Conversely, weaker data might reinforce expectations of Fed easing, supporting equity markets. Traders will be scrutinizing these figures for clues on the Fed's next move.
| Indicator | Value | Signal | Interpretation |
|---|---|---|---|
| RSI (14) | 70.95 | Overbought | Potential for pullback/consolidation |
| MACD Histogram | [MACD from market data] | Neutral | Momentum is mixed, watch for crossover |
| Stochastic | K:65.73, D:73.5 | Bearish Crossover | %K |
| ADX | 49.72 | Strong Trend | Trend is strong, but direction is key |
| Bollinger | Upper Band | Watch | Price near upper band, potential rejection |
Track markets in real-time
AI-powered analysis, technical indicators and real-time price data.
Join Our Telegram Channel
Breaking market news, AI analysis and trading signals instantly.
Join Channel