

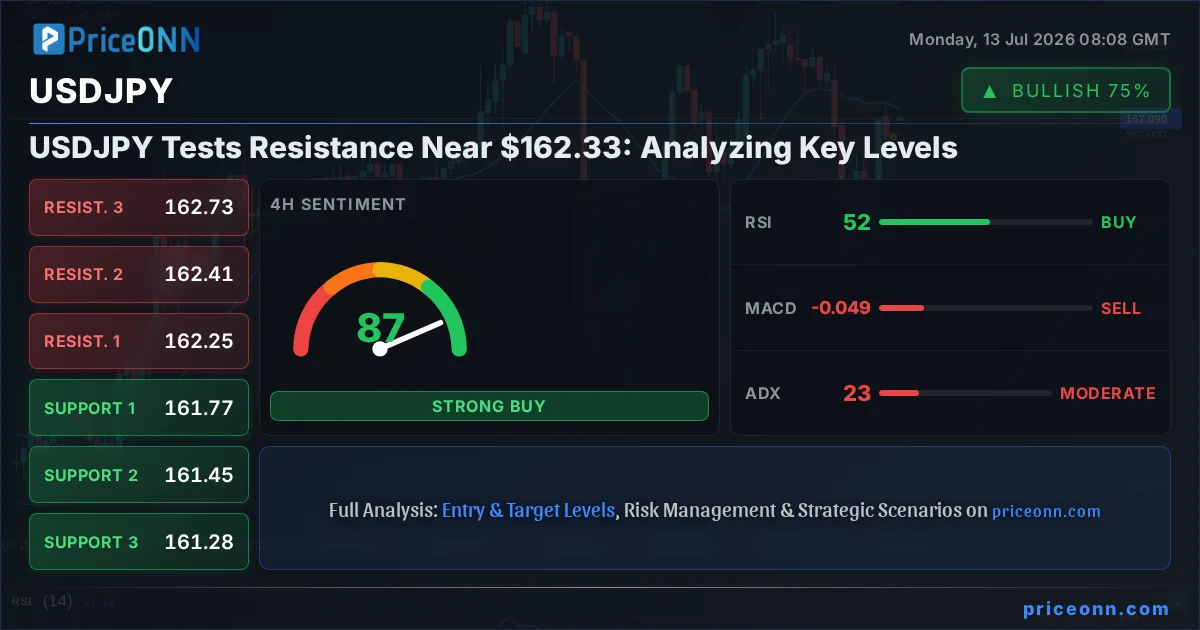
Alright, let's cut straight to the chase. The USDJPY pair is currently dancing around a critical resistance level near $162.33, and frankly, the chart is telling a compelling story right now. After a significant run-up, the momentum seems to be facing headwinds, and understanding the interplay between the Dollar's strength, the Yen's vulnerability, and the sheer technical levels is paramount for any trader looking to navigate this market. This isn't just another tick on the forex board; it's a battleground where bulls and bears are testing each other's resolve, and the signals we're seeing across multiple timeframes suggest a pivotal moment is upon us. The current price of $162.11 reflects this tension, perched precariously close to a level that has historically acted as a ceiling.
- The Relative Strength Index (RSI) at 55.48 on the 1-hour chart signals a neutral-to-bullish leaning but is not yet in overbought territory, suggesting room for upward movement before significant selling pressure emerges.
- Critical resistance sits at $162.33, a level that has been tested on the 1-hour chart and needs close observation for a potential breakout or rejection.
- The MACD histogram on the 4-hour chart shows negative momentum, indicating that while the price has been rising, the underlying strength of the move might be waning.
- The correlation with the Dollar Index (DXY), currently trading around 100.93, is a key factor; a strengthening DXY typically puts pressure on USDJPY, but recent Yen weakness might be overriding this.
The narrative around USDJPY has been one of persistent Yen weakness, largely driven by the Bank of Japan's (BoJ) ultra-loose monetary policy contrasting sharply with the hawkish stance of the Federal Reserve. While the Fed has signaled a pause in rate hikes, the prospect of higher-for-longer interest rates in the US continues to underpin the dollar. However, the sheer velocity of USDJPY's ascent has been staggering, pushing the pair to levels not seen in decades. This rapid appreciation raises questions about sustainability and whether market participants are starting to price in potential intervention from Japanese authorities, or perhaps a shift in BoJ policy, however distant that may seem.
Looking at the 1-hour chart, the trend is currently neutral with a strength of 50%, but the immediate signals lean bullish. The RSI at 55.48 is in neutral territory, indicating no strong overbought or oversold conditions, and the MACD is showing positive momentum with the MACD line above the signal line. This suggests that, in the very short term, there might be a bit more room for upside. The Stochastic Oscillator, with K at 74.96 and D at 79.35, is showing a bearish signal as %K
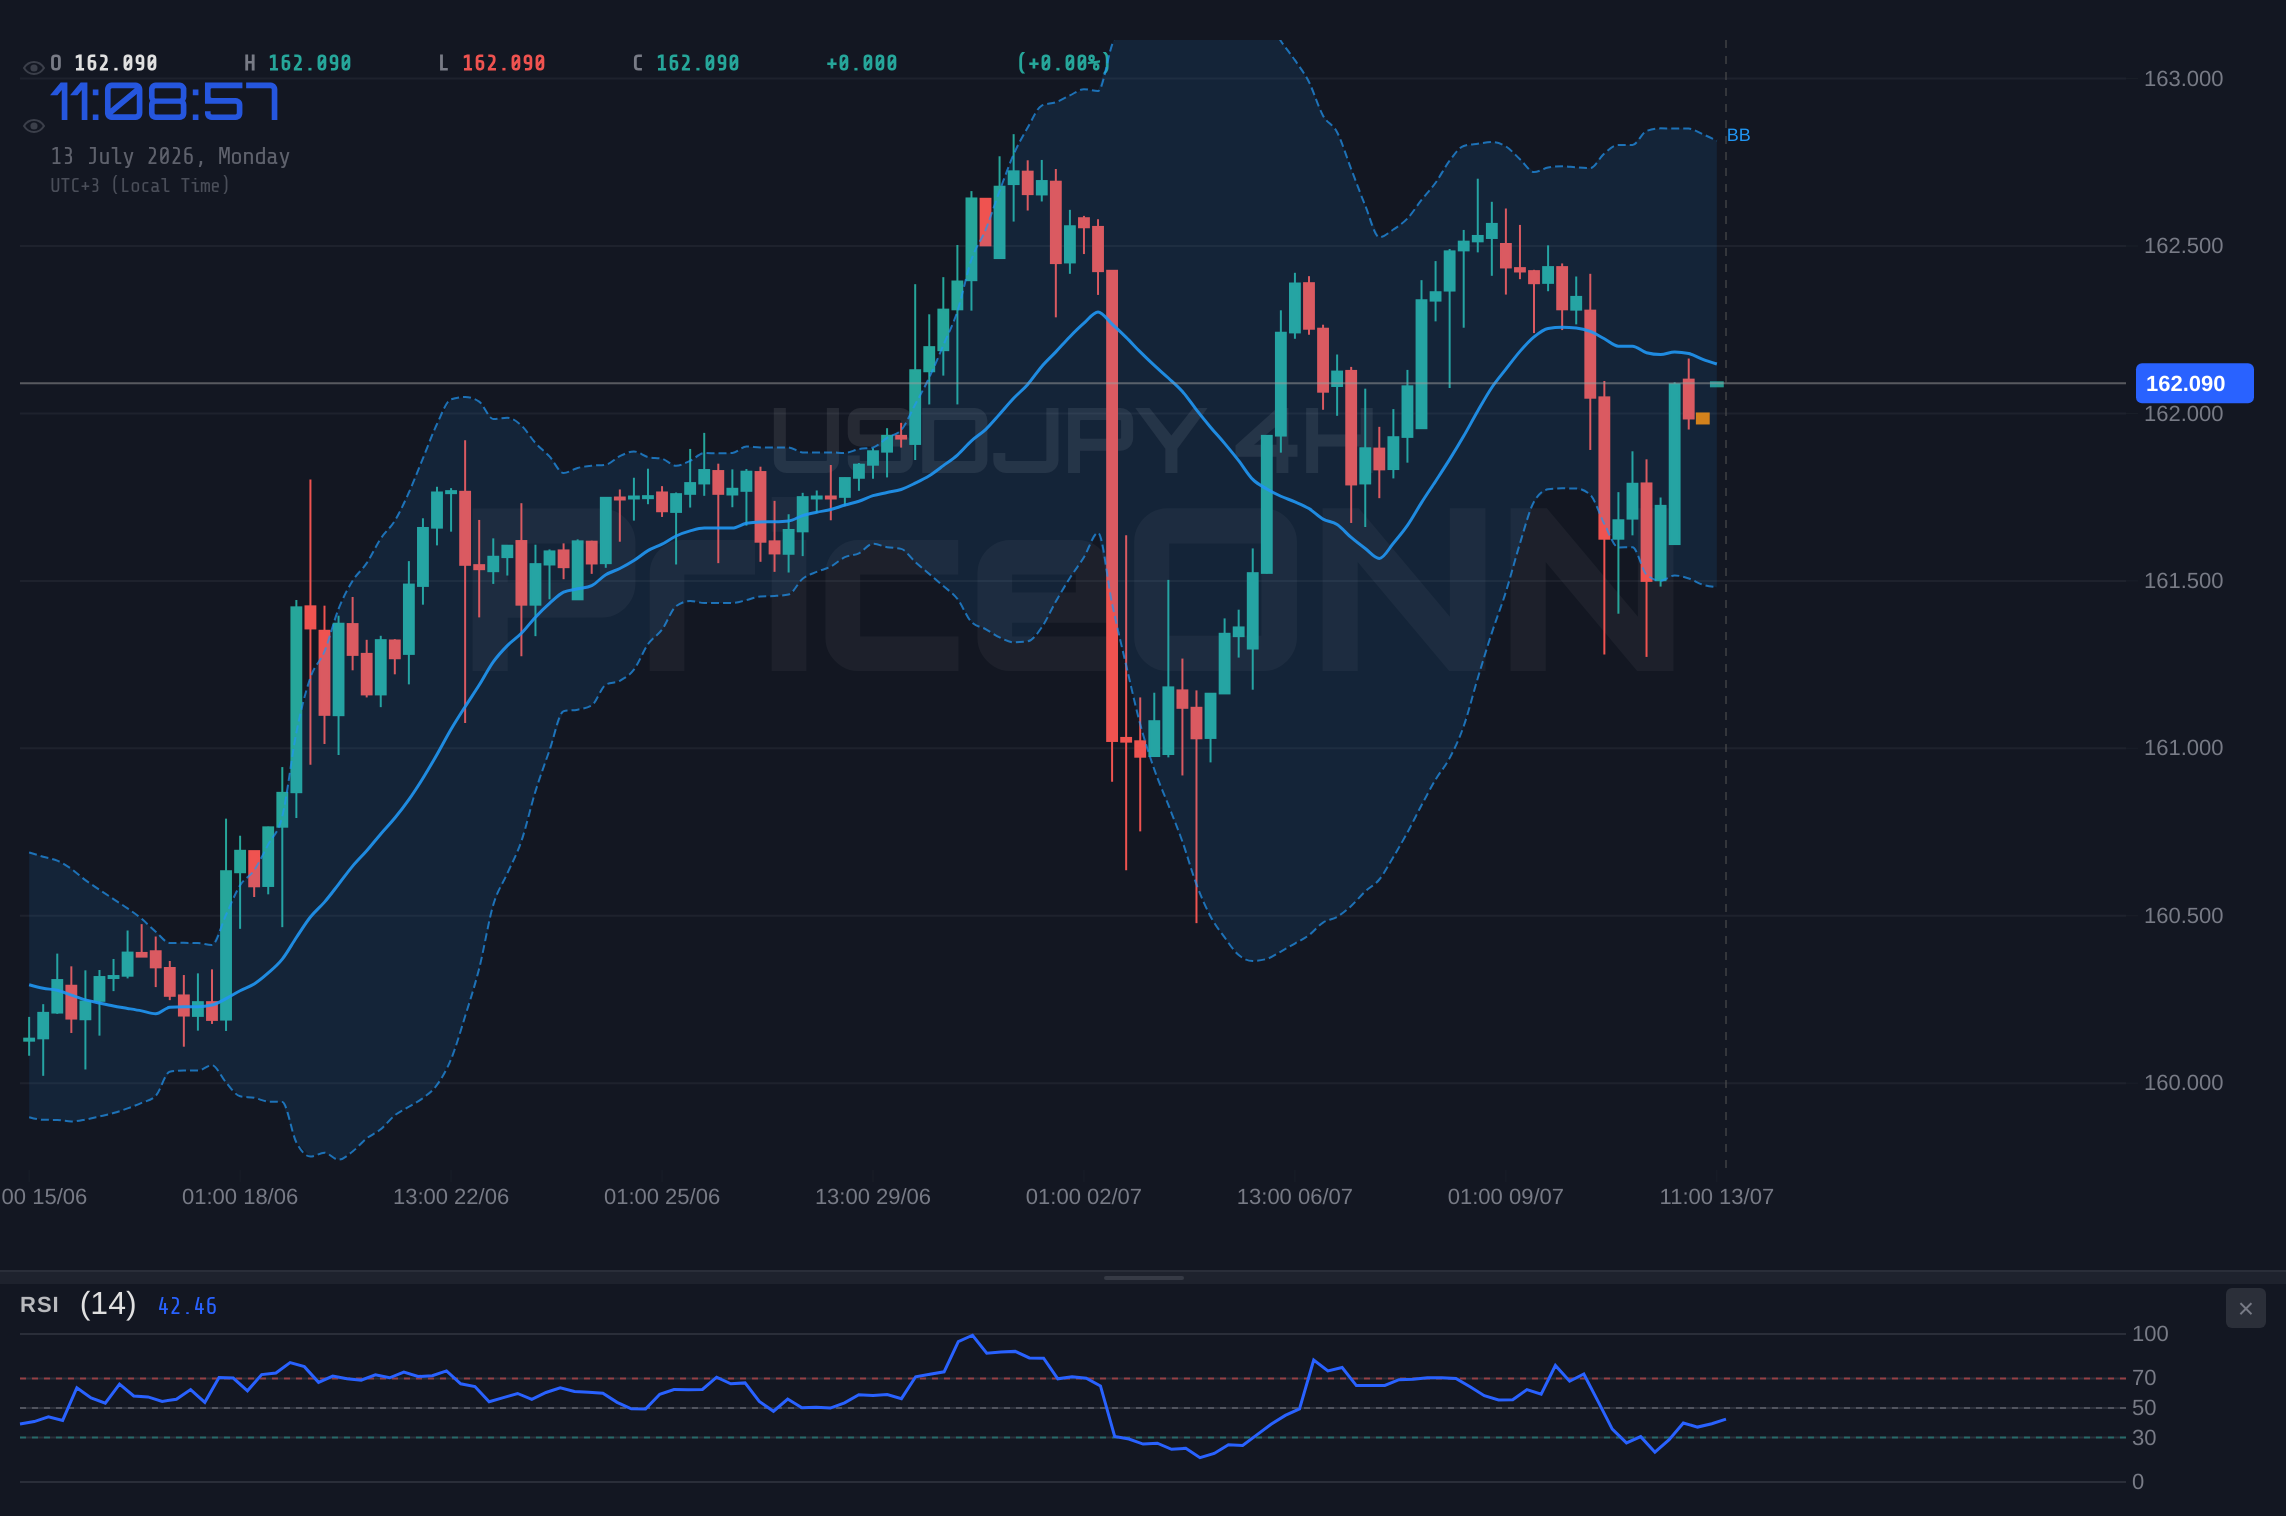
However, when we zoom out to the 4-hour timeframe, the picture becomes more nuanced, and a degree of caution is warranted. The trend is officially classified as bullish with a strength of 82%, but the ADX at 23.1 points to a moderately trending market, not an explosive one. The RSI at 52.03 is comfortably in neutral territory, offering no strong directional bias. More intriguingly, the MACD has flipped to negative momentum, with the MACD line now below the signal line, suggesting that the buying pressure seen on the hourly chart might be losing steam. The Stochastic Oscillator, with K at 59.81 and D at 36.53, is showing a bullish signal (%K > %D), but it's moving out of the oversold zone, which could indicate a potential bounce rather than sustained upward momentum. The key support on this timeframe is $161.767, and a break below it could signal a deeper correction.
The daily chart presents an even more complex scenario. The trend is neutral with a 50% strength, indicating a potential turning point or consolidation phase. The RSI at 58.55 is leaning bullish but remains well below the overbought threshold of 70, suggesting there's still room for appreciation if the bulls can muster the energy. The MACD, however, is showing negative momentum, with the MACD line below the signal line, which is a bearish divergence from the hourly and even the 4-hour chart's potential for upside. The Stochastic Oscillator, with K at 67.23 and D at 65.59, shows a bullish signal (%K > %D) and is nearing the overbought zone, which could foreshadow a pullback. The ADX at 22.08 reinforces the idea of a moderate trend, not a dominant one. The key support on the daily chart is $161.192, while the significant resistance lies at $162.336. A decisive move above this daily resistance could open the door for further gains, but the conflicting signals across timeframes suggest this won't be a straight line.
Let's talk correlation. The Dollar Index (DXY) is currently trading around 100.93, showing a slight dip on the 1-hour chart but a neutral stance on the 4-hour and a bullish bias on the daily. Historically, a rising DXY tends to weigh on USDJPY due to the inverse relationship. However, the Yen's unique position as a safe-haven currency that also benefits from carry trade dynamics when global risk appetite is high, complicates this. Recently, news has emerged about renewed U.S. missile strikes against Iran, prompting retaliatory action and escalating geopolitical tensions in the Middle East. This kind of 'risk-off' sentiment often sees investors flocking to safe-haven assets. While one might expect this to boost the Yen, the Yen's recent performance has been surprisingly weak, suggesting that interest rate differentials and capital flows are currently dominating safe-haven considerations. The Australian Dollar, for instance, is underperforming, trading 0.32% lower to near 0.6930 against the US Dollar, and the New Zealand Dollar is also depreciating, trading around 0.5750. This broad weakness in commodity currencies and even the Euro, which is flirting with 1.1400 on risk-averse markets, highlights a general move towards the perceived safety of the US Dollar, which is indirectly supportive of USDJPY's upward trend.
The energy markets are also painting a picture of rising geopolitical risk. Brent Oil prices surged by 4% in Asian trade following intense U.S. strikes on Iran and retaliatory actions. Brent is approaching the $80 level, a critical point where geopolitical noise has previously translated into genuine oil-market shocks. WTI crude is also showing a significant upward move, trading at $73.89. Higher oil prices can have a dual effect: they can fuel inflation expectations, potentially leading to tighter monetary policy from central banks like the Fed, which would support the dollar and USDJPY. Conversely, a sharp spike in oil prices due to conflict can also dampen global economic growth and risk appetite, which might ironically put pressure on USDJPY if it leads to a broader flight to safety, though as noted, the Yen isn't acting like a typical safe haven right now. The rising oil prices, therefore, add another layer of complexity, potentially reinforcing the dollar's strength through inflation channels.
From a technical perspective, the confluence of signals presents a challenging trading environment. On the 1-hour chart, we see a bullish bias with a potential test of $162.324 resistance. However, the 4-hour chart shows weakening momentum (negative MACD) and a more neutral trend, while the daily chart exhibits conflicting signals with a bullish RSI but negative MACD momentum and a strong ADX indicating a significant downtrend bias. The Stochastic oscillators are also giving mixed signals across timeframes. This divergence across timeframes is a classic sign that the market is at a crossroads. The ADX values are particularly telling: 20.44 on the 1-hour, 23.1 on the 4-hour, and 22.08 on the daily. These readings suggest that while there is a trend, it's not overwhelmingly strong and is susceptible to reversals. This moderate trend strength, combined with the conflicting indicator signals, points towards a period of consolidation or a potential turning point.
The immediate price action around $162.11 is critical. A failure to break decisively above the $162.33 resistance on the 1-hour chart could lead to a pullback. The key support levels to watch on the 1-hour chart are $162.166, $162.008, and $161.885. A break below $161.885 could confirm a short-term reversal. On the 4-hour chart, support lies at $161.767, $161.447, and $161.284. A decisive break below the $161.192 daily support level would signal a more significant correction. Conversely, a strong breakout above $162.336 on the daily chart, supported by increasing volume and positive confirmation from other indicators, could signal the continuation of the bullish trend, with the next psychological level being $163.00. However, given the current mixed signals, a period of consolidation between $161.192 and $162.336 seems a highly plausible scenario in the short term.
Considering the trade plan, the current ADX of 23.1 on the 4-hour chart points to a moderate trend, and the Stochastic is in a tradable zone, not at extreme overbought or oversold levels. This, along with the mixed signals across timeframes, suggests a scenario where probabilities are distributed. The dominant trend on the 4-hour is bullish, but the daily shows a strong downtrend bias from ADX (32.29), and the 1-hour is neutral. Given the immediate price action is testing resistance, the bearish scenario has a significant probability. The bullish scenario relies on a clean breakout, and the neutral scenario anticipates a period of range-bound trading.
Bearish Scenario: Resistance Holds Firm
60% ProbabilityNeutral Scenario: Consolidation Phase
25% ProbabilityBullish Scenario: Breakout Confirmation
15% ProbabilityGeopolitical tensions in the Middle East remain a significant wildcard. Renewed escalation could trigger safe-haven flows into the Yen, potentially invalidating bullish USDJPY scenarios rapidly. Traders should maintain tight risk management and be prepared for sudden volatility.
Frequently Asked Questions: USDJPY Analysis
What happens if USDJPY fails to break above the $162.33 resistance level?
If USDJPY fails to decisively break above $162.33, expect a potential pullback. The bearish scenario suggests a move towards the $161.767 support level on the 4-hour chart, with a deeper fall to $161.192 if that level also breaks.
Should I consider buying USDJPY at current levels near $162.11, given the mixed signals?
Buying at current levels carries risk due to the proximity of resistance and conflicting daily signals. A more prudent approach might be to wait for confirmation of a breakout above $162.336 on the daily chart, or a clear bounce from established support levels like $161.192, with a probability estimate of around 15% for a sustained bullish move from current prices.
Is the RSI at 55.48 on the 1-hour chart a buy signal for USDJPY?
An RSI of 55.48 on the 1-hour chart is in neutral territory and leans slightly bullish, indicating that momentum is not yet exhausted. However, it's not a strong buy signal on its own and should be considered alongside other indicators and price action, especially with the 4-hour and daily charts showing more caution.
How might rising oil prices and Middle East tensions affect USDJPY this week?
Rising oil prices driven by geopolitical tensions could boost inflation expectations, supporting the dollar. However, if tensions escalate into broad risk aversion, the Yen might benefit from safe-haven demand, potentially pressuring USDJPY lower. The net effect remains uncertain, but volatility is likely to increase.
The path forward for USDJPY hinges on its ability to decisively break through the $162.336 resistance on the daily chart. The current price action around $162.11 shows a market grappling with conflicting signals across different timeframes and external geopolitical factors. While the 1-hour chart offers a glimmer of short-term bullishness, the broader picture suggests caution. A sustained move above daily resistance, confirmed by increasing volume and clearing the lingering bearish MACD momentum, could pave the way for further appreciation. However, failure to do so could lead to a consolidation or a correction towards the $161.192 support level. Traders should remain vigilant, manage risk tightly, and wait for clearer directional signals before committing to significant positions. Patience and discipline are key in navigating these choppy waters.
Track markets in real-time
AI-powered analysis, technical indicators and real-time price data.
Join Our Telegram Channel
Breaking market news, AI analysis and trading signals instantly.
Join Channel