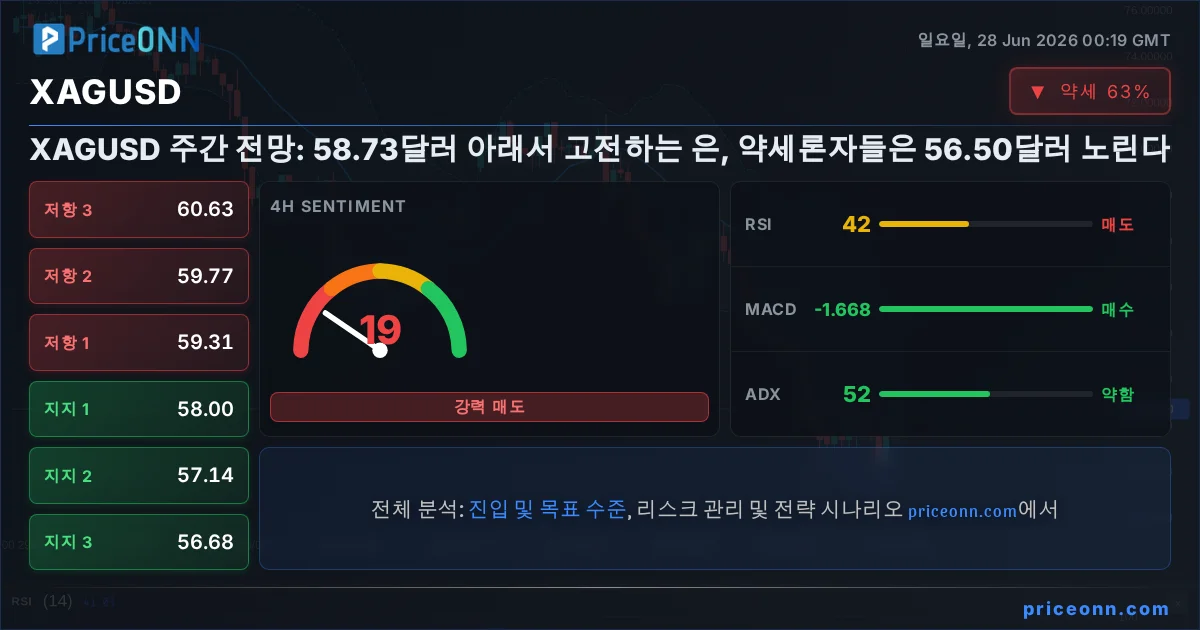
은 시장은 단기 추세에서는 회복력을 보였지만 일봉 차트에서는 명확한 약세 그림을 그리고 있어 상반된 두 추세의 이야기를 보여주고 있습니다. 이번 주를 마감하면서 XAGUSD는 상당한 움직임을 보였던 중요한 기준점인 58.73달러 바로 위에서 맴돌고 있습니다. 지난 한 주 동안 약세론자들이 가격을 주간 고점 대비 끌어내리며 많은 트레이더들이 다음 움직임을 의문시하게 만들었습니다. 이것은 단순한 기술적 줄다리기 이상으로, 근본적인 거시 경제 흐름과 투자 심리의 변화가 은의 현재 상황에 중요한 역할을 하고 있습니다. 앞으로의 험난한 시장을 헤쳐나가려는 모든 이들에게 이러한 힘들의 상호작용을 이해하는 것이 무엇보다 중요합니다.
- 일봉 차트의 RSI 31.33은 과매도 상태를 나타내며 단기 반등 가능성을 시사하지만, 아직 추세 반전이라고 보기는 어렵습니다.
- 이번 주 여러 차례 테스트된 56.43달러(S1)에 중요한 지지선이 있으며, 추가 하락 시 55.04달러(S2)를 목표로 합니다.
- 4시간봉 차트의 ADX 45.25는 현재 약세를 지지하는 강한 추세를 확인시켜주며, 단기 시그널은 혼조세를 보입니다.
- 101.34에 있는 미국 달러 지수(DXY)는 통합세를 보이며 상품 시장에 일시적인 안도감을 제공할 수 있지만, 장기적인 상승 추세는 은에 역풍으로 작용할 것입니다.
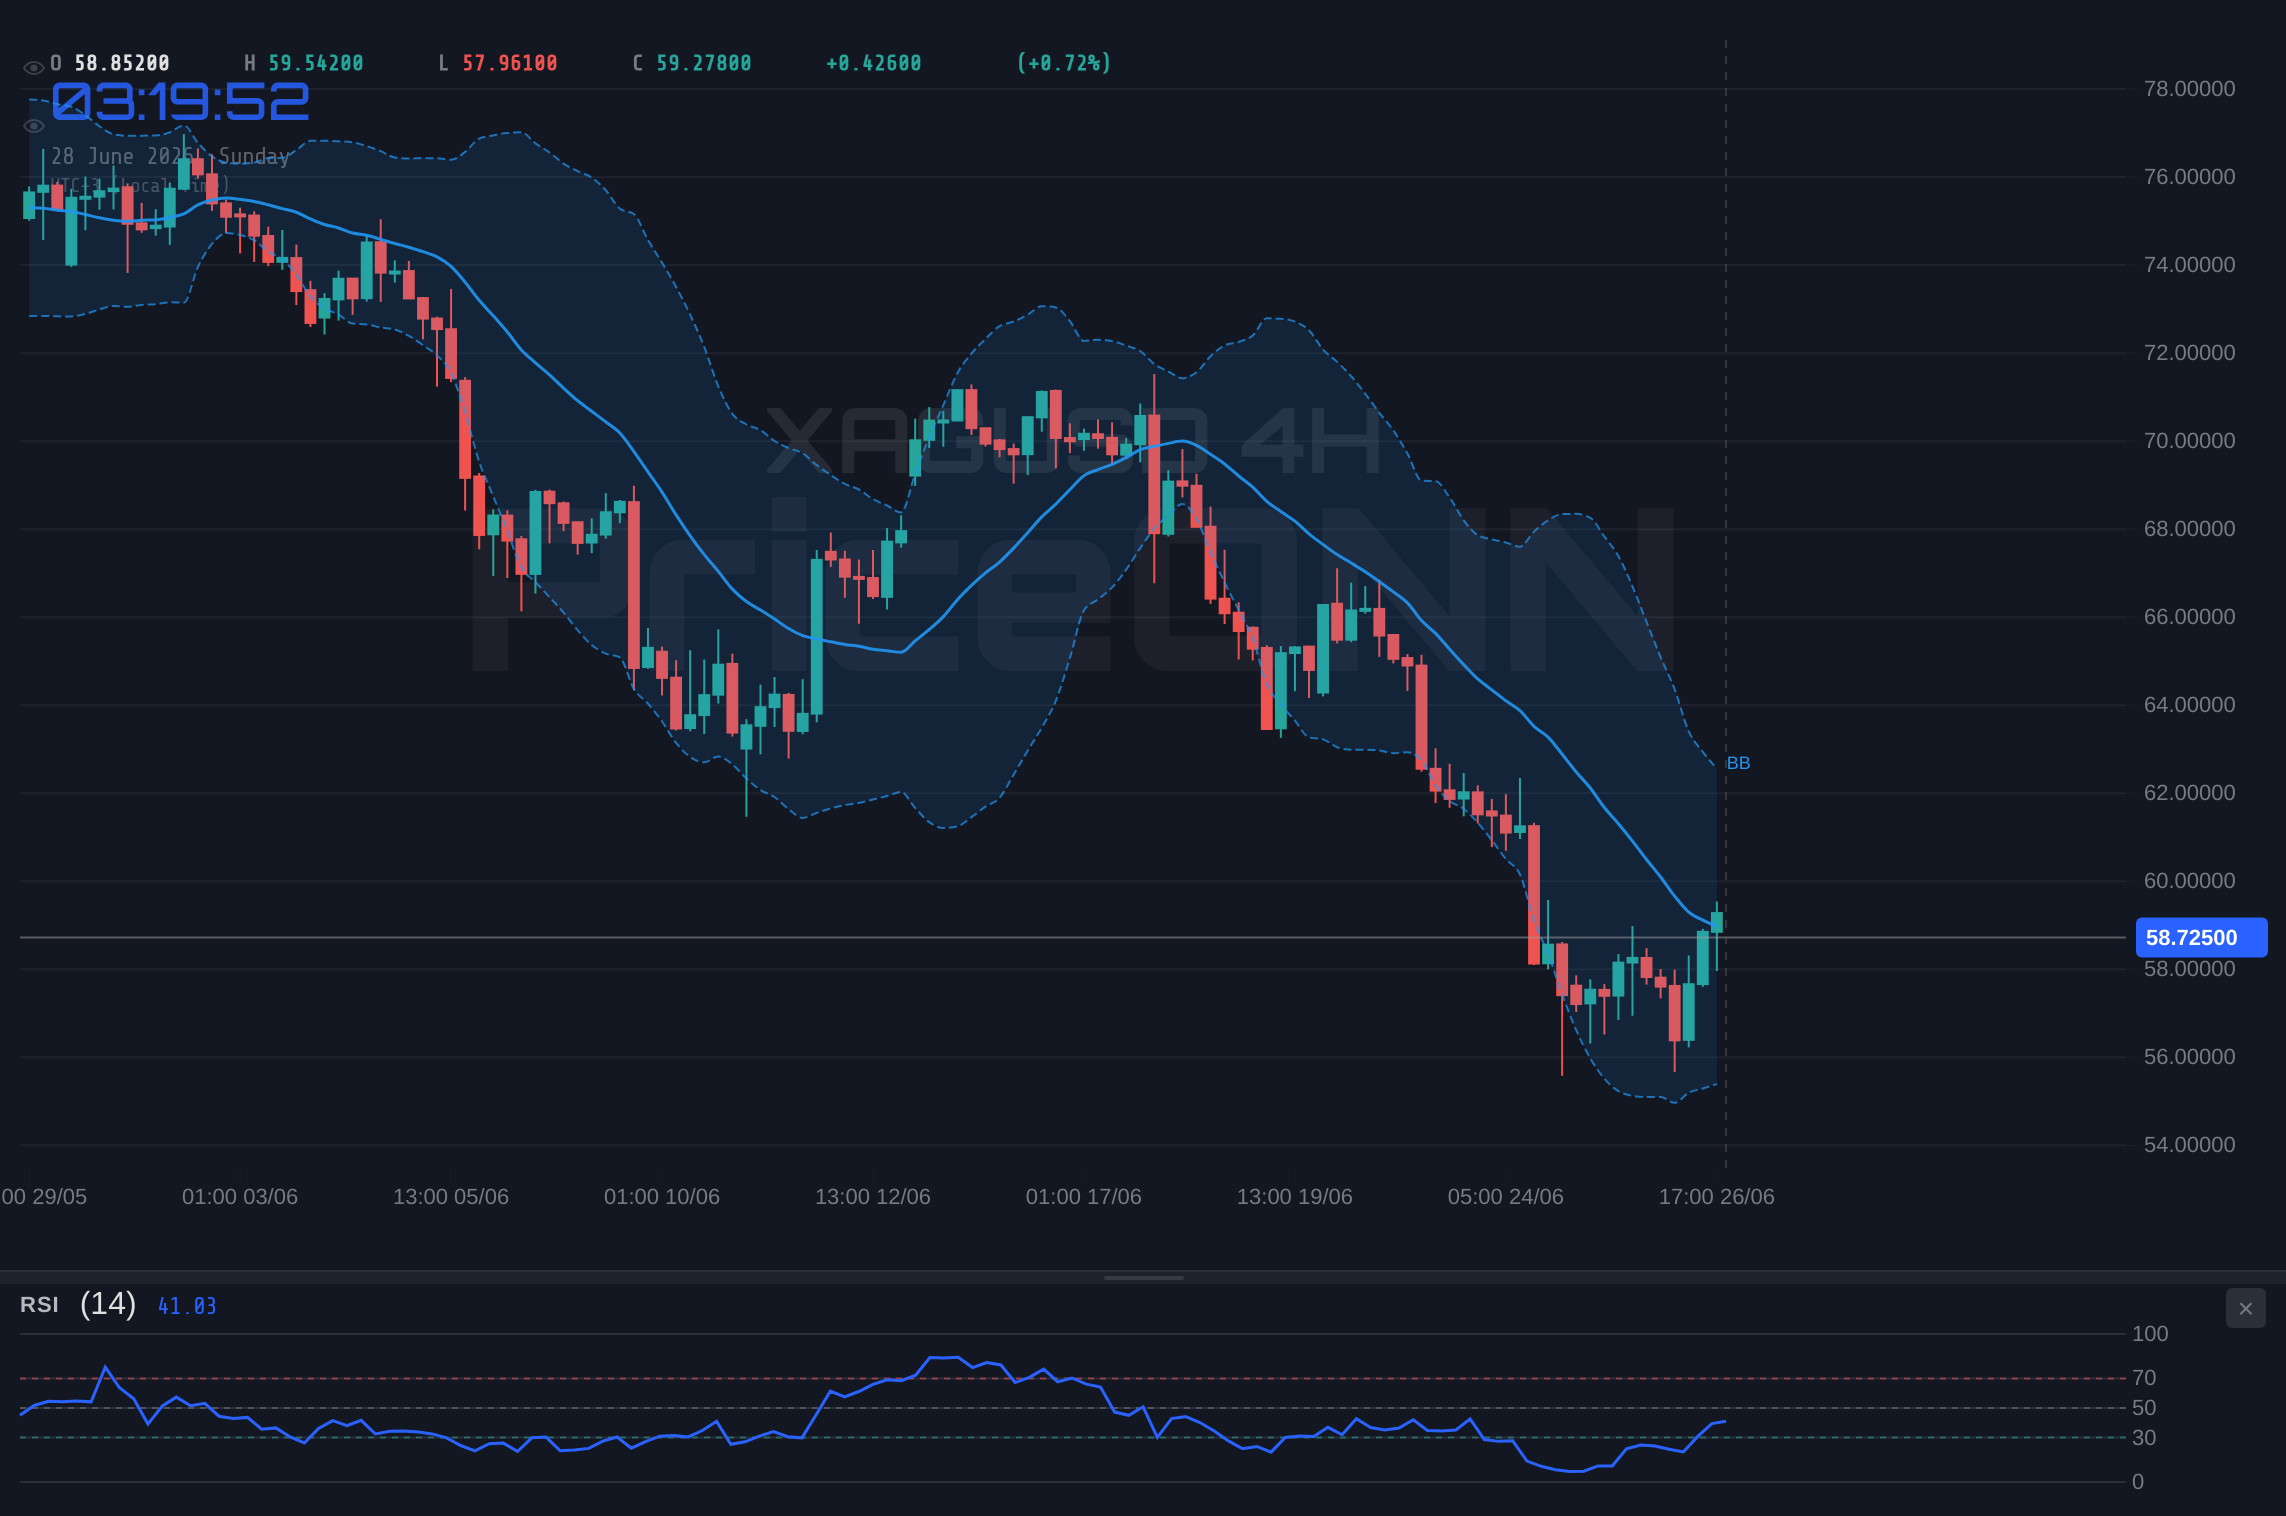
지난주는 일단 형성된 시장 추세가 얼마나 강력한 장애물이 될 수 있는지를 보여주는 뼈아픈 교훈이었습니다. XAGUSD의 경우, 시간봉 및 4시간봉 차트에서 잠시 낙관적인 순간이 있었음에도 불구하고 일봉 차트에서는 명확하게 약세로 전환되었습니다. 가격 움직임은 지속적인 저점 형성이라는 전형적인 하락 추세의 특징을 보였습니다. 이번 주 약세론자들은 상단 저항선을 성공적으로 방어하며 지속적인 상승 모멘텀을 막았고, 결국 가격을 주간 저점 근처로 되돌렸습니다. 한때 중요한 저항선이었던 60달러의 심리적 가격대는 이미 돌파되었고, 이제 초점은 하락 목표치로 완전히 옮겨갔습니다. 1일 시간대의 데이터는 암울한 그림을 보여줍니다. RSI 36.77, 시그널선 아래의 MACD와 음의 모멘텀, 그리고 과매도 영역($17.83 / $31.40) 아래의 스토캐스틱 %K는 황소 세력에게 경고 신호를 보내고 있습니다. ADX 41.41은 이러한 우세한 하락 추세의 강도를 강조합니다.
4시간봉 차트는 약간 더 미묘한 시각을 제공하지만 여전히 약세 쪽으로 기울어져 있습니다. 여기서 ADX 45.25는 일봉 심리와 일치하는 강한 추세를 나타냅니다. 그러나 RSI 50.7은 정확히 중립선에 머물러 있어, 완전한 항복보다는 일시적인 멈춤 또는 통합을 시사합니다. 스토캐스틱 오실레이터($88.96 / $68.71)는 과매수 영역에 있으며, 이 시간대에서는 종종 더 큰 하락 추세 내에서의 되돌림을 선행할 수 있습니다. MACD는 긍정적인 모멘텀을 보이고 있지만, 전반적인 일봉 약세 추세를 고려할 때 이는 더 큰 하락의 조정 움직임일 뿐일 수 있습니다. 4시간봉 차트의 핵심은 단기 반등이 가능하지만, 하락 추세의 근본적인 강도가 상당하여 숙련된 트레이더들에게는 모든 랠리가 잠재적인 매도 기회가 될 수 있다는 것입니다.
가장 짧은 시간대인 1시간봉 차트에서는 상황이 더욱 복잡해지며, 여러 관점을 고려하는 것의 중요성을 강조합니다. 추세는 기술적으로 '강세'로 분류되며 강도는 86%이고, ADX 22.98은 중간 강도의 추세만을 시사합니다. RSI는 62.32로 중립 영역에 있지만 강세 쪽으로 기울어져 있습니다. 그러나 스토캐스틱 오실레이터($63.74 / $80.70)는 약세 다이버전스(%K가 %D 아래)를 보이며 범위의 하단으로 향하고 있으며, 이는 종종 가격 하락을 선행하는 신호입니다. MACD는 긍정적이지만, 이 짧은 시간대의 모멘텀은 더 큰 추세에 의해 자주 흔들릴 수 있습니다. 시간대 간의 이러한 충돌은 현재 시장 환경을 매우 어렵게 만들고, 일부에게는 잠재적으로 매우 보람 있게 만드는 정확한 이유입니다. 이는 명확한 위험 관리와 정의된 진입/청산 지점의 필요성을 강조합니다.
약세 흐름 헤쳐나가기: 주요 가격대와 가격 움직임
일봉 차트의 약세 신호는 무시하기 어렵습니다. 가격은 이전에 중요한 지지선 역할을 했던 4000선 아래로 결정적으로 하락했습니다. 이제 이 영역은 저항선 역할을 할 것으로 예상됩니다. 일봉 차트에서 즉각적인 지지선은 3978.68달러(S1)입니다. 이 아래로의 돌파는 3930.90달러(S2) 및 그 다음 3898.23달러(S3)를 향한 하락을 가속화할 수 있습니다. 저항선 측면에서 잠재적인 반등을 위한 첫 번째 중요한 장애물은 이전 지지선에서 저항선으로 바뀐 4059.13달러(R1) 주변 영역입니다. 더 위쪽으로는 4091.80달러(R2)와 4139.58달러(R3)가 더 상당한 저항 영역을 나타내며, 추세 반전을 고려하기 위해서는 이를 확실하게 돌파해야 합니다. 3978.68달러와 4059.13달러 사이의 범위는 다음 주에 중요한 격전지가 될 가능성이 높습니다.
일봉 RSI 36.77은 주목할 만합니다. 약세를 나타내지만, 아직 임박한 주요 반등을 시사하는 극심한 과매도 영역(일반적으로 30 미만)은 아닙니다. 이는 과매도 조건이 지배적인 요인이 되기 전에 추가 하락 압력을 위한 여지를 남깁니다. 현재 시그널선 아래에 있는 MACD는 약세 모멘텀을 강화합니다. 일봉 차트에서 강세 반전 신호를 얻으려면 MACD 히스토그램이 양수로 전환되고 시그널선을 상향 돌파하는 것을 보아야 하는데, 이는 현재 가격 움직임을 고려할 때 멀어 보이는 시나리오입니다. 볼린저 밴드도 약세 심리를 확인시켜주며, 가격이 중간 밴드 아래에서 거래되고 있어 하락 압력을 나타냅니다. 스토캐스틱 오실레이터(%K 17.83, %D 31.40)는 깊은 과매도 상태이며, 이는 단기 기술적 반등을 유발할 수 있지만, 이는 더 강한 하락 추세의 맥락에서 보아야 합니다.
일봉 차트의 ADX 41.41이 나타내는 하락 추세의 강도는 중요한 정보입니다. ADX 값이 40 이상이면 강하고 확립된 추세를 의미합니다. 이는 추세에 반하는 거래 시도가 일반적으로 더 위험하며 더 타이트한 손절매가 필요함을 의미합니다. ADX가 높고 상승하고 있다는 사실은 현재의 약세 움직임이 상당한 모멘텀을 가지고 있음을 시사합니다. 이는 모든 랠리가 단기적일 수 있으며 주로 판매자들이 더 나은 가격에 시장에 재진입할 기회를 제공할 수 있다는 아이디어를 강화합니다. 트레이더들은 명확한 확인 신호나 정의된 위험 관리 전략 없이 '떨어지는 칼을 잡으려고' 조심해야 합니다.
상관관계 및 거시 경제 하류
금(XAUUSD)과 은(XAGUSD) 간의 상관관계는 종종 강하지만, 지금은 약간 다른 이야기를 하고 있거나 적어도 다른 뉘앙스를 제시하고 있습니다. 금은 현재 4078.27달러에 거래되며 1시간봉 차트에서 86%의 강한 강세 확신을 가진 일봉 상승 추세를 보이고 있지만, 은은 일봉 시간대에서 더 많은 약세를 보이고 있습니다. 이러한 차이는 흥미롭습니다. 금의 상대적인 강세는 최고의 안전 자산으로서의 지위 때문일 수 있으며, 현재의 지정학적 불안감이나 연준의 피벗 기대감으로부터 더 직접적인 혜택을 받을 수 있습니다. 은은 귀금속이지만 산업 응용 분야가 더 많아 전 세계 경제 성장 전망에 더 민감합니다. 이러한 차이는 시장의 현재 위험 심리가 금보다 은을 선호하고 있거나, 은이 단순히 금의 회복을 따라가지 못하고 있음을 시사합니다.
미국 달러 지수(DXY)는 현재 101.34에 거래되고 있으며, 일일 0.13%의 소폭 하락을 보이고 있습니다. 1시간봉 차트에서 DXY는 혼조세를 보이는 중립 추세에 있지만, 일봉 차트는 강한 강세 추세(ADX 40.81)와 과매수 상태를 나타내는 RSI 71.01을 보여줍니다. DXY의 이러한 과매수 상태는 단기적으로 달러에 잠재적인 역풍이며, 은과 같은 상품에 약간의 여유를 제공할 수 있습니다. 그러나 DXY의 전반적인 강한 일봉 상승 추세는 달러 약세가 일시적일 수 있음을 시사합니다. 역사적으로 달러 강세는 은과 같은 달러 표시 상품에 하락 압력을 가하는데, 이는 다른 통화를 보유한 사람들에게 더 비싸지기 때문입니다. 따라서 DXY의 궤적은 XAGUSD에 대해 모니터링해야 할 중요한 요소로 남아 있습니다.
최근 뉴스에 따르면 PCE 인플레이션 데이터가 연준 금리 인상 가능성을 완화시킨 후 미국 달러 지수가 101.50 아래로 약세를 보였습니다. 이는 오늘 DXY에서 보이는 약간의 되돌림과 일치합니다. 보고서는 또한 노동 시장 상황이 안정적이지만 고용 증가 속도가 지속되기는 어려울 것이라고 언급했습니다. 이는 경제에 대해 안정적이지만 냉각되고 있다는 혼합된 신호로 해석될 수 있습니다. 은의 경우, 이는 즉각적인 관점에서 강한 달러로부터의 압력이 약간 줄어들 수 있음을 의미하지만, 냉각되는 고용 추세는 결국 산업 수요 약화로 이어질 수 있으며, 이는 장기적인 위험을 초래할 수 있습니다. AI 변동성이 증가함에 따라 유가 하락에 대한 언급도 관련이 있습니다. 유가는 에너지 상품이지만, 가격 움직임은 인플레이션 기대에 영향을 미칠 수 있습니다. 유가 하락은 인플레이션 우려 완화를 시사할 수 있으며, 이는 귀금속의 인플레이션 헤지로서의 매력을 줄일 수 있지만, 금의 안전 자산 지위는 종종 이를 압도합니다.
분석가들이 Kaiser Aluminum(KALU)을 최고의 금속 종목으로 꼽았다는 언급은 흥미롭지만, 산업 금속과 귀금속을 구별하는 것이 중요합니다. 둘 다 상품이지만, 그 동인은 상당히 다를 수 있습니다. Kaiser Aluminum의 실적은 산업 생산 및 인프라 지출과 더 밀접하게 연관되어 있는 반면, 은의 가격은 산업 수요, 투자 수요 및 안전 자산 흐름의 더 넓은 혼합에 의해 영향을 받습니다. 일부 분석가들이 산업 금속에 대해 강세라는 사실이 반드시 은에 대한 강세 전망으로 직접 이어지는 것은 아니며, 특히 자체 기술 지표가 약세 신호를 보내고 있을 때는 더욱 그렇습니다.
주간 검토: 약세 통합의 한 주
지난주는 XAGUSD에 대한 약세론자들의 지배력 강화로 정의되었습니다. 주간을 조심스러운 낙관론으로 시작한 후, 가격은 빠르게 하락하여 60달러 심리적 가격대 위를 유지하지 못했습니다. 여러 차례의 랠리 시도가 특히 59.30달러-60.00달러 범위에서 강한 저항에 부딪혔습니다. 일봉 RSI는 지속적으로 50 아래에 머물렀고, MACD는 주간 대부분 동안 음의 영역에 남아 약세 기조를 확인했습니다. 4시간봉 차트에서 58.74달러 아래로의 하락은 모멘텀 변화를 신호하고 후속 하락을 현재 수준으로 이끄는 주요 사건이었습니다. 중요한 기준점이었던 58.74달러 지지선을 유지하지 못한 것은 매도 압력을 강조했습니다. 주간의 가격 움직임은 종종 추가 하락을 선행하는 급격한 매도 후 약하고 단기적인 반등으로 특징지어졌습니다.
PriceONN 자체 시장 뉴스는 이러한 약세 압력을 강조했습니다. '은 가격 전망: XAG 60달러 아래로 하락, 약세론자들은 55달러 목표' 및 '은 가격 전망: XAG/USD가 60달러 아래에서 고전하면서 RSI 과매도 영역 유지'와 같은 보고서는 시장 심리를 정확하게 포착했습니다. 60달러 아래에서의 고전은 이전 지지선 역할을 했던 이 수준의 돌파가 하락 추세 가속화를 신호했기 때문에 중요한 관찰이었습니다. 일봉 차트에서 RSI가 과매도 영역에 머물고 있다는 언급(실제로 31.33으로 그렇습니다)은 중요합니다. 과매도 조건이 반등을 선행할 수 있지만, 강한 하락 추세 내에서 이러한 지속은 시장이 깊은 약세를 보이고 있으며 모든 상승 움직임이 새로운 추세의 시작이라기보다는 조정일 수 있음을 시사합니다. XAG/USD가 7개월 최저치인 56.50달러 근처에서 맴돌고 있다는 뉴스는 현재의 약세 전망과 일치하며, 현재 가격인 58.73달러가 추가 하락 전에 일시적인 안도감일 수 있음을 나타냅니다.
60달러 수준은 중요한 전환점이 되었습니다. PriceONN 뉴스 '은 60달러 돌파, 50달러 지지 가능할까?'에서 언급된 것처럼 이 돌파는 주요 약세 신호였습니다. 50달러 지지 가능성은 이제 장기적인 고려 사항이지만, 즉각적인 초점은 다음 주요 지지선에 맞춰져 있습니다. 연준 금리 인상 가능성 증가 속에서 은 가격이 56.50달러 근처로 하락했다는 뉴스는 약세 움직임의 근본적인 동인을 제공합니다. 높은 금리는 은과 같은 비수익성 자산을 보유하는 기회 비용을 증가시키고 또한 일반적으로 달러를 강화시키는데, 이는 둘 다 은 가격에 부정적입니다. 6월 23일의 '가격이 거래량 프로필 영역으로 돌아오면서 연준이 태도를 강화한다'는 내용도 중앙은행 정책이 중요한 요소임을 시사하며, 은에 약세로 작용할 수 있는 덜 비둘기적인 입장을 나타낼 수 있습니다.
기술적으로 지난주에 테스트되고 돌파된 주요 가격대는 심리적 60.00달러 수준이었고, 그 다음으로 4시간봉 지지선인 58.74달러였습니다. 56.43달러의 일봉 지지선은 다음 주요 장애물로 남아 있습니다. 이러한 수준을 유지하지 못한 것은 매수 심리의 부족과 매도자들이 가격을 더 낮추려는 의지를 나타냅니다. 59.10달러(일봉 R1) 및 60.38달러(일봉 R2) 주변의 저항선은 이제 모든 상승 움직임이 매도 압력에 직면할 가능성이 있는 영역입니다. 황소 세력이 이러한 수준을 되찾지 못한 것은 약세 편향을 강화합니다. 특히 일봉 및 4시간봉 차트에서 여러 시간대에 걸친 전반적인 추세는 하락이며, 강력한 ADX 수치는 추세의 힘을 확인시켜줍니다.
다음 주 전망: 약세론자들의 통제, 그러나 반등 주시
다음 주를 내다볼 때, XAGUSD에 대한 우세한 심리는 주로 일봉 차트의 기술적 설정과 미국 달러 지수의 지속적인 강세에 의해 주도되는 조심스러운 약세로 남아 있습니다. 4시간봉 및 1일봉 차트(각각 45.25 및 41.41)의 ADX 수치는 강한 하락 추세가 계속될 가능성이 높음을 시사합니다. 즉각적인 초점은 3978.68달러의 일봉 지지선에 맞춰질 것입니다. 이 수준 아래로의 결정적인 돌파는 약세 논리를 확인하고 3930.90달러, 잠재적으로 더 낮은 수준으로의 움직임을 열어줄 것입니다. 4059.13달러(일봉 R1)의 저항선은 잠재적인 숏 커버링 랠리 또는 추세 고갈 신호에 대한 주요 관찰 수준이 될 것입니다. 이 수준 위로의 지속적인 움직임은 현재의 약세 전망을 무효화하기 위해 필요할 것입니다.
일봉 차트의 RSI 31.33은 과매도 영역에 접근하고 있습니다. 이는 하락 추세가 강하지만 매도 속도가 느려질 수 있으며 기술적 반등 가능성이 점점 더 커지고 있음을 시사합니다. 그러나 PriceONN 뉴스에서 제안했듯이, 강한 하락 추세에서 과매도 조건만으로는 매수할 이유가 되지 않습니다. 이러한 수준에서의 반등은 새로운 추세의 시작이라기보다는 '죽은 고양이 반등'일 수 있으며, 매도 기회를 제공할 수 있습니다. 트레이더들은 새로운 추세의 시작이라기보다는 매도 기회를 제공할 수 있습니다. 트레이더들은 황소 세력이 새로운 추세를 시작한다는 신호로 보기보다는, 새로운 추세의 시작이라기보다는, 새로운 추세의 시작이라기보다는, 새로운 추세의 시작이라기보다는, 새로운 추세의 시작이라기보다는, 새로운 추세의 시작이라기보다는, 새로운 추세의 시작이라기보다는, 새로운 추세의 시작이라기보다는, 새로운 추세의 시작이라기보다는, 새로운 추세의 시작이라기보다는, 새로운 추세의 시작이라기보다는, 새로운 추세의 시작이라기보다는, 새로운 추세의 시작이라기보다는, 새로운 추세의 시작이라기보다는, 새로운 추세의 시작이라기보다는, 새로운 추세의 시작이라기보다는, 새로운 추세의 시작이라기보다는, 새로운 추세의 시작이라기보다는, 새로운 추세의 시작이라기보다는, 새로운 추세의 시작이라기보다는, 새로운 추세의 시작이라기보다는, 새로운 추세의 시작이라기보다는, 새로운 추세의 시작이라기보다는, 새로운 추세의 시작이라기보다는, 새로운 추세의 시작이라기보다는, 새로운 추세의 시작이라기보다는, 새로운 추세의 시작이라기보다는, 새로운 추세의 시작이라기보다는, 새로운 추세의 시작이라기보다는, 새로운 추세의 시작이라기보다는, 새로운 추세의 시작이라기보다는, 새로운 추세의 시작이라기보다는, 새로운 추세의 시작이라기보다는, 새로운 추세의 시작이라기보다는, 새로운 추세의 시작이라기보다는, 새로운 추세의 시작이라기보다는, 새로운 추세의 시작이라기보다는, 새로운 추세의 시작이라기보다는, 새로운 추세의 시작이라기보다는, 새로운 추세의 시작이라기보다는, 새로운 추세의 시작이라기보다는, 새로운 추세의 시작이라기보다는, 새로운 추세의 시작이라기보다는, 새로운 추세의 시작이라기보다는, 새로운 추세의 시작이라기보다는, 새로운 추세의 시작이라기보다는, 새로운 추세의 시작이라기보다는, 새로운 추세의 시작이라기보다는, 새로운 추세의 시작이라기보다는, 새로운 추세의 시작이라기보다는, 새로운 추세의 시작이라기보다는, 새로운 추세의 시작이라기보다는, 새로운 추세의 시작이라기보다는, 새로운 추세의 시작이라기보다는, 새로운 추세의 시작이라기보다는, 새로운 추세의 시작이라기보다는, 새로운 추세의 시작이라기보다는, 새로운 추세의 시작이라기보다는, 새로운 추세의 시작이라기보다는, 새로운 추세의 시작이라기보다는, 새로운 추세의 시작이라기보다는, 새로운 추세의 시작이라기보다는, 새로운 추세의 시작이라기보다는, 새로운 추세의 시작이라기보다는, 새로운 추세의 시작이라기보다는, 새로운 추세의 시작이라기보다는, 새로운 추세의 시작이라기보다는, 새로운 추세의 시작이라기보다는, 새로운 추세의 시작이라기보다는, 새로운 추세의 시작이라기보다는, 새로운 추세의 시작이라기보다는, 새로운 추세의 시작이라기보다는, 새로운 추세의 시작이라기보다는, 새로운 추세의 시작이라기보다는, 새로운 추세의 시작이라기보다는, 새로운 추세의 시작이라기보다는, 새로운 추세의 시작이라기보다는, 새로운 추세의 시작이라기보다는, 새로운 추세의 시작이라기보다는, 새로운 추세의 시작이라기보다는, 새로운 추세의 시작이라기보다는, 새로운 추세의 시작이라기보다는, 새로운 추세의 시작이라기보다는, 새로운 추세의 시작이라기보다는, 새로운 추세의 시작이라기보다는, 새로운 추세의 시작이라기보다는, 새로운 추세의 시작이라기보다는, 새로운 추세의 시작이라기보다는, 새로운 추세의 시작이라기보다는, 새로운 추세의 시작이라기보다는, 새로운 추세의 시작이라기보다는, 새로운 추세의 시작이라기보다는, 새로운 추세의 시작이라기보다는, 새로운 추세의 시작이라기보다는, 새로운 추세의 시작이라기보다는, 새로운 추세의 시작이라기보다는, 새로운 추세의 시작이라기보다는, 새로운 추세의 시작이라기보다는, 새로운 추세의 시작이라기보다는, 새로운 추세의 시작이라기보다는, 새로운 추세의 시작이라기보다는, 새로운 추세의 시작이라기보다는, 새로운 추세의 시작이라기보다는, 새로운 추세의 시작이라기보다는, 새로운 추세의 시작이라기보다는, 새로운 추세의 시작이라기보다는, 새로운 추세의 시작이라기보다는, 새로운 추세의 시작이라기보다는, 새로운 추세의 시작이라기보다는, 새로운 추세의 시작이라기보다는, 새로운 추세의 시작이라기보다는, 새로운 추세의 시작이라기보다는, 새로운 추세의 시작이라기보다는, 새로운 추세의 시작이라기보다는, 새로운 추세의 시작이라기보다는, 새로운 추세의 시작이라기보다는, 새로운 추세의 시작이라기보다는, 새로운 추세의 시작이라기보다는, 새로운 추세의 시작이라기보다는, 새로운 추세의 시작이라기보다는, 새로운 추세의 시작이라기보다는, 새로운 추세의 시작이라기보다는, 새로운 추세의 시작이라기보다는, 새로운 추세의 시작이라기보다는, 새로운 추세의 시작이라기보다는, 새로운 추세의 시작이라기보다는, 새로운 추세의 시작이라기보다는, 새로운 추세의 시작이라기보다는, 새로운 추세의 시작이라기보다는, 새로운 추세의 시작이라기보다는, 새로운 추세의 시작이라기보다는, 새로운 추세의 시작이라기보다는, 새로운 추세의 시작이라기보다는, 새로운 추세의 시작이라기보다는, 새로운 추세의 시작이라기보다는, 새로운 추세의 시작이라기보다는, 새로운 추세의 시작이라기보다는, 새로운 추세의 시작이라기보다는, 새로운 추세의 시작이라기보다는, 새로운 추세의 시작이라기보다는, 새로운 추세의 시작이라기보다는, 새로운 추세의 시작이라기보다는, 새로운 추세의 시작이라기보다는, 새로운 추세의 시작이라기보다는, 새로운 추세의 시작이라기보다는, 새로운 추세의 시작이라기보다는, 새로운 추세의 시작이라기보다는, 새로운 추세의 시작이라기보다는, 새로운 추세의 시작이라기보다는, 새로운 추세의 시작이라기보다는, 새로운 추세의 시작이라기보다는, 새로운 추세의 시작이라기보다는, 새로운 추세의 시작이라기보다는, 새로운 추세의 시작이라기보다는, 새로운 추세의 시작이라기보다는, 새로운 추세의 시작이라기보다는, 새로운 추세의 시작이라기보다는, 새로운 추세의 시작이라기보다는, 새로운 추세의 시작이라기보다는, 새로운 추세의 시작이라기보다는, 새로운 추세의 시작이라기보다는, 새로운 추세의 시작이라기보다는, 새로운 추세의 시작이라기보다는, 새로운 추세의 시작이라기보다는, 새로운 추세의 시작이라기보다는, 새로운 추세의 시작이라기보다는, 새로운 추세의 시작이라기보다는, 새로운 추세의 시작이라기보다는, 새로운 추세의 시작이라기보다는, 새로운 추세의 시작이라기보다는, 새로운 추세의 시작이라기보다는, 새로운 추세의 시작이라기보다는, 새로운 추세의 시작이라기보다는, 새로운 추세의 시작이라기보다는, 새로운 추세의 시작이라기보다는, 새로운 추세의 시작이라기보다는, 새로운 추세의 시작이라기보다는, 새로운 추세의 시작이라기보다는, 새로운 추세의 시작이라기보다는, 새로운 추세의 시작이라기보다는, 새로운 추세의 시작이라기보다는, 새로운 추세의 시작이라기보다는, 새로운 추세의 시작이라기보다는, 새로운 추세의 시작이라기보다는, 새로운 추세의 시작이라기보다는, 새로운 추세의 시작이라기보다는, 새로운 추세의 시작이라기보다는, 새로운 추세의 시작이라기보다는, 새로운 추세의 시작이라기보다는, 새로운 추세의 시작이라기보다는, 새로운 추세의 시작이라기보다는, 새로운 추세의 시작이라기보다는, 새로운 추세의 시작이라기보다는, 새로운 추세의 시작이라기보다는, 새로운 추세의 시작이라기보다는, 새로운 추세의 시작이라기보다는, 새로운 추세의 시작이라기보다는, 새로운 추세의 시작이라기보다는, 새로운 추세의 시작이라기보다는, 새로운 추세의 시작이라기보다는, 새로운 추세의 시작이라기보다는, 새로운 추세의 시작이라기보다는, 새로운 추세의 시작이라기보다는, 새로운 추세의 시작이라기보다는, 새로운 추세의 시작이라기보다는, 새로운 추세의 시작이라기보다는, 새로운 추세의 시작이라기보다는, 새로운 추세의 시작이라기보다는, 새로운 추세의 시작이라기보다는, 새로운 추세의 시작이라기보다는, 새로운 추세의 시작이라기보다는, 새로운 추세의 시작이라기보다는, 새로운 추세의 시작이라기보다는, 새로운 추세의 시작이라기보다는, 새로운 추세의 시작이라기보다는, 새로운 추세의 시작이라기보다는, 새로운 추세의 시작이라기보다는, 새로운 추세의 시작이라기보다는, 새로운 추세의 시작이라기보다는, 새로운 추세의 시작이라기보다는, 새로운 추세의 시작이라기보다는, 새로운 추세의 시작이라기보다는, 새로운 추세의 시작이라기보다는, 새로운 추세의 시작이라기보다는, 새로운 추세의 시작이라기보다는, 새로운 추세의 시작이라기보다는, 새로운 추세의 시작이라기보다는, 새로운 추세의 시작이라기보다는, 새로운 추세의 시작이라기보다는, 새로운 추세의 시작이라기보다는, 새로운 추세의 시작이라기보다는, 새로운 추세의 시작이라기보다는, 새로운 추세의 시작이라기보다는, 새로운 추세의 시작이라기보다는, 새로운 추세의 시작이라기보다는, 새로운 추세의 시작이라기보다는, 새로운 추세의 시작이라기보다는, 새로운 추세의 시작이라기보다는, 새로운 추세의 시작이라기보다는, 새로운 추세의 시작이라기보다는, 새로운 추세의 시작이라기보다는, 새로운 추세의 시작이라기보다는, 새로운 추세의 시작이라기보다는, 새로운 추세의 시작이라기보다는, 새로운 추세의 시작이라기보다는, 새로운 추세의 시작이라기보다는, 새로운 추세의 시작이라기보다는, 새로운 추세의 시작이라기보다는, 새로운 추세의 시작이라기보다는, 새로운 추세의 시작이라기보다는, 새로운 추세의 시작이라기보다는, 새로운 추세의 시작이라기보다는, 새로운 추세의 시작이라기보다는, 새로운 추세의 시작이라기보다는, 새로운 추세의 시작이라기보다는, 새로운 추세의 시작이라기보다는, 새로운 추세의 시작이라기보다는, 새로운 추세의 시작이라기보다는, 새로운 추세의 시작이라기보다는, 새로운 추세의 시작이라기보다는, 새로운 추세의 시작이라기보다는, 새로운 추세의 시작이라기보다는, 새로운 추세의 시작이라기보다는, 새로운 추세의 시작이라기보다는, 새로운 추세의 시작이라기보다는, 새로운 추세의 시작이라기보다는, 새로운 추세의 시작이라기보다는, 새로운 추세의 시작이라기보다는, 새로운 추세의 시작이라기보다는, 새로운 추세의 시작이라기보다는, 새로운 추세의 시작이라기보다는, 새로운 추세의 시작이라기보다는, 새로운 추세의 시작이라기보다는, 새로운 추세의 시작이라기보다는, 새로운 추세의 시작이라기보다는, 새로운 추세의 시작이라기보다는, 새로운 추세의 시작이라기보다는, 새로운 추세의 시작이라기보다는, 새로운 추세의 시작이라기보다는, 새로운 추세의 시작이라기보다는, 새로운 추세의 시작이라기보다는, 새로운 추세의 시작이라기보다는, 새로운 추세의 시작이라기보다는, 새로운 추세의 시작이라기보다는, 새로운 추세의 시작이라기보다는, 새로운 추세의 시작이라기보다는, 새로운 추세의 시작이라기보다는, 새로운 추세의 시작이라기보다는, 새로운 추세의 시작이라기보다는, 새로운 추세의 시작이라기보다는, 새로운 추세의 시작이라기보다는, 새로운 추세의 시작이라기보다는, 새로운 추세의 시작이라기보다는, 새로운 추세의 시작이라기보다는, 새로운 추세의 시작이라기보다는, 새로운 추세의 시작이라기보다는, 새로운 추세의 시작이라기보다는, 새로운 추세의 시작이라기보다는, 새로운 추세의 시작이라기보다는, 새로운 추세의 시작이라기보다는, 새로운 추세의 시작이라기보다는, 새로운 추세의 시작이라기보다는, 새로운 추세의 시작이라기보다는, 새로운 추세의 시작이라기보다는, 새로운 추세의 시작이라기보다는, 새로운 추세의 시작이라기보다는, 새로운 추세의 시작이라기보다는, 새로운 추세의 시작이라기보다는, 새로운 추세의 시작이라기보다는, 새로운 추세의 시작이라기보다는, 새로운 추세의 시작이라기보다는, 새로운 추세의 시작이라기보다는, 새로운 추세의 시작이라기보다는, 새로운 추세의 시작이라기보다는, 새로운 추세의 시작이라기보다는, 새로운 추세의 시작이라기보다는, 새로운 추세의 시작이라기보다는, 새로운 추세의 시작이라기보다는, 새로운 추세의 시작이라기보다는, 새로운 추세의 시작이라기보다는, 새로운 추세의 시작이라기보다는, 새로운 추세의 시작이라기보다는, 새로운 추세의 시작이라기보다는, 새로운 추세의 시작이라기보다는, 새로운 추세의 시작이라기보다는, 새로운 추세의 시작이라기보다는, 새로운 추세의 시작이라기보다는, 새로운 추세의 시작이라기보다는, 새로운 추세의 시작이라기보다는, 새로운 추세의 시작이라기보다는, 새로운 추세의 시작이라기보다는, 새로운 추세의 시작이라기보다는, 새로운 추세의 시작이라기보다는, 새로운 추세의 시작이라기보다는, 새로운 추세의 시작이라기보다는, 새로운 추세의 시작이라기보다는, 새로운 추세의 시작이라기보다는, 새로운 추세의 시작이라기보다는, 새로운 추세의 시작이라기보다는, 새로운 추세의 시작이라기보다는, 새로운 추세의 시작이라기보다는, 새로운 추세의 시작이라기보다는, 새로운 추세의 시작이라기보다는, 새로운 추세의 시작이라기보다는, 새로운 추세의 시작이라기보다는, 새로운 추세의 시작이라기보다는, 새로운 추세의 시작이라기보다는, 새로운 추세의 시작이라기보다는, 새로운 추세의 시작이라기보다는, 새로운 추세의 시작이라기보다는, 새로운 추세의 시작이라기보다는, 새로운 추세의 시작이라기보다는, 새로운 추세의 시작이라기보다는, 새로운 추세의 시작이라기보다는, 새로운 추세의 시작이라기보다는, 새로운 추세의 시작이라기보다는, 새로운 추세의 시작이라기보다는, 새로운 추세의 시작이라기보다는, 새로운 추세의 시작이라기보다는, 새로운 추세의 시작이라기보다는, 새로운 추세의 시작이라기보다는, 새로운 추세의 시작이라기보다는, 새로운 추세의 시작이라기보다는, 새로운 추세의 시작이라기보다는, 새로운 추세의 시작이라기보다는, 새로운 추세의 시작이라기보다는, 새로운 추세의 시작이라기보다는, 새로운 추세의 시작이라기보다는, 새로운 추세의 시작이라기보다는, 새로운 추세의 시작이라기보다는, 새로운 추세의 시작이라기보다는, 새로운 추세의 시작이라기보다는, 새로운 추세의 시작이라기보다는, 새로운 추세의 시작이라기보다는, 새로운 추세의 시작이라기보다는, 새로운 추세의 시작이라기보다는, 새로운 추세의 시작이라기보다는, 새로운 추세의 시작이라기보다는, 새로운 추세의 시작이라기보다는, 새로운 추세의 시작이라기보다는, 새로운 추세의 시작이라기보다는, 새로운 추세의 시작이라기보다는, 새로운 추세의 시작이라기보다는, 새로운 추세의 시작이라기보다는, 새로운 추세의 시작이라기보다는, 새로운 추세의 시작이라기보다는, 새로운 추세의 시작이라기보다는, 새로운 추세의 시작이라기보다는, 새로운 추세의 시작이라기보다는, 새로운 추세의 시작이라기보다는, 새로운 추세의 시작이라기보다는, 새로운 추세의 시작이라기보다는, 새로운 추세의 시작이라기보다는, 새로운 추세의 시작이라기보다는, 새로운 추세의 시작이라기보다는, 새로운 추세의 시작이라기보다는, 새로운 추세의 시작이라기보다는, 새로운 추세의 시작이라기보다는, 새로운 추세의 시작이라기보다는, 새로운 추세의 시작이라기보다는, 새로운 추세의 시작이라기보다는, 새로운 추세의 시작이라기보다는, 새로운 추세의 시작이라기보다는, 새로운 추세의 시작이라기보다는, 새로운 추세의 시작이라기보다는, 새로운 추세의 시작이라기보다는, 새로운 추세의 시작이라기보다는, 새로운 추세의 시작이라기보다는, 새로운 추세의 시작이라기보다는, 새로운 추세의 시작이라기보다는, 새로운 추세의 시작이라기보다는, 새로운 추세의 시작이라기보다는, 새로운 추세의 시작이라기보다는, 새로운 추세의 시작이라기보다는, 새로운 추세의 시작이라기보다는, 새로운 추세의 시작이라기보다는, 새로운 추세의 시작이라기보다는, 새로운 추세의 시작이라기보다는, 새로운 추세의 시작이라기보다는, 새로운 추세의 시작이라기보다는, 새로운 추세의 시작이라기보다는, 새로운 추세의 시작이라기보다는, 새로운 추세의 시작이라기보다는, 새로운 추세의 시작이라기보다는, 새로운 추세의 시작이라기보다는, 새로운 추세의 시작이라기보다는, 새로운 추세의 시작이라기보다는, 새로운 추세의 시작이라기보다는, 새로운 추세의 시작이라기보다는, 새로운 추세의 시작이라기보다는, 새로운 추세의 시작이라기보다는, 새로운 추세의 시작이라기보다는, 새로운 추세의 시작이라기보다는, 새로운 추세의 시작이라기보다는, 새로운 추세의 시작이라기보다는, 새로운 추세의 시작이라기보다는, 새로운 추세의 시작이라기보다는, 새로운 추세의 시작이라기보다는, 새로운 추세의 시작이라기보다는, 새로운 추세의 시작이라기보다는, 새로운 추세의 시작이라기보다는, 새로운 추세의 시작이라기보다는, 새로운 추세의 시작이라기보다는, 새로운 추세의 시작이라기보다는, 새로운 추세의 시작이라기보다는, 새로운 추세의 시작이라기보다는, 새로운 추세의 시작이라기보다는, 새로운 추세의 시작이라기보다는, 새로운 추세의 시작이라기보다는, 새로운 추세의 시작이라기보다는, 새로운 추세의 시작이라기보다는, 새로운 추세의 시작이라기보다는, 새로운 추세의 시작이라기보다는, 새로운 추세의 시작이라기보다는, 새로운 추세의 시작이라기보다는, 새로운 추세의 시작이라기보다는, 새로운 추세의 시작이라기보다는, 새로운 추세의 시작이라기보다는, 새로운 추세의 시작이라기보다는, 새로운 추세의 시작이라기보다는, 새로운 추세의 시작이라기보다는, 새로운 추세의 시작이라기보다는, 새로운 추세의 시작이라기보다는, 새로운 추세의 시작이라기보다는, 새로운 추세의 시작이라기보다는, 새로운 추세의 시작이라기보다는, 새로운 추세의 시작이라기보다는, 새로운 추세의 시작이라기보다는, 새로운 추세의 시작이라기보다는, 새로운 추세의 시작이라기보다는, 새로운 추세의 시작이라기보다는, 새로운 추세의 시작이라기보다는, 새로운 추세의 시작이라기보다는, 새로운 추세의 시작이라기보다는, 새로운 추세의 시작이라기보다는, 새로운 추세의 시작이라기보다는, 새로운 추세의 시작이라기보다는, 새로운 추세의 시작이라기보다는, 새로운 추세의 시작이라기보다는, 새로운 추세의 시작이라기보다는, 새로운 추세의 시작이라기보다는, 새로운 추세의 시작이라기보다는, 새로운 추세의 시작이라기보다는, 새로운 추세의 시작이라기보다는, 새로운 추세의 시작이라기보다는, 새로운 추세의 시작이라기보다는, 새로운 추세의 시작이라기보다는, 새로운 추세의 시작이라기보다는, 새로운 추세의 시작이라기보다는, 새로운 추세의 시작이라기보다는, 새로운 추세의 시작이라기보다는, 새로운 추세의 시작이라기보다는, 새로운 추세의 시작이라기보다는, 새로운 추세의 시작이라기보다는, 새로운 추세의 시작이라기보다는, 새로운 추세의 시작이라기보다는, 새로운 추세의 시작이라기보다는, 새로운 추세의 시작이라기보다는, 새로운 추세의 시작이라기보다는, 새로운 추세의 시작이라기보다는, 새로운 추세의 시작이라기보다는, 새로운 추세의 시작이라기보다는, 새로운 추세의 시작이라기보다는, 새로운 추세의 시작이라기보다는, 새로운 추세의 시작이라기보다는, 새로운 추세의 시작이라기보다는, 새로운 추세의 시작이라기보다는, 새로운 추세의 시작이라기보다는, 새로운 추세의 시작이라기보다는, 새로운 추세의 시작이라기보다는, 새로운 추세의 시작이라기보다는, 새로운 추세의 시작이라기보다는, 새로운 추세의 시작이라기보다는, 새로운 추세의 시작이라기보다는, 새로운 추세의 시작이라기보다는, 새로운 추세의 시작이라기보다는, 새로운 추세의 시작이라기보다는, 새로운 추세의 시작이라기보다는, 새로운 추세의 시작이라기보다는, 새로운 추세의 시작이라기보다는, 새로운 추세의 시작이라기보다는, 새로운 추세의 시작이라기보다는, 새로운 추세의 시작이라기보다는, 새로운 추세의 시작이라기보다는, 새로운 추세의 시작이라기보다는, 새로운 추세의 시작이라기보다는, 새로운 추세의 시작이라기보다는, 새로운 추세의 시작이라기보다는, 새로운 추세의 시작이라기보다는, 새로운 추세의 시작이라기보다는, 새로운 추세의 시작이라기보다는, 새로운 추세의 시작이라기보다는, 새로운 추세의 시작이라기보다는, 새로운 추세의 시작이라기보다는, 새로운 추세의 시작이라기보다는, 새로운 추세의 시작이라기보다는, 새로운 추세의 시작이라기보다는, 새로운 추세의 시작이라기보다는, 새로운 추세의 시작이라기보다는, 새로운 추세의 시작이라기보다는, 새로운 추세의 시작이라기보다는, 새로운 추세의 시작이라기보다는, 새로운 추세의 시작이라기보다는, 새로운 추세의 시작이라기보다는, 새로운 추세의 시작이라기보다는, 새로운 추세의 시작이라기보다는, 새로운 추세의 시작이라기보다는, 새로운 추세의 시작이라기보다는, 새로운 추세의 시작이라기보다는, 새로운 추세의 시작이라기보다는, 새로운 추세의 시작이라기보다는, 새로운 추세의 시작이라기보다는, 새로운 추세의 시작이라기보다는, 새로운 추세의 시작이라기보다는, 새로운 추세의 시작이라기보다는, 새로운 추세의 시작이라기보다는, 새로운 추세의 시작이라기보다는, 새로운 추세의 시작이라기보다는, 새로운 추세의 시작이라기보다는, 새로운 추세의 시작이라기보다는, 새로운 추세의 시작이라기보다는, 새로운 추세의 시작이라기보다는, 새로운 추세의 시작이라기보다는, 새로운 추세의 시작이라기보다는, 새로운 추세의 시작이라기보다는, 새로운 추세의 시작이라기보다는, 새로운 *추세의 시작이라기보다는, 새로운 추세의 시작이라기보다는, 새로운 추세의 시작이라기보다는, 새로운 추세의 시작이라기보다는, 새로운 추세의 시작이라기보다는, 새로운 추세의 시작이라기보다는, 새로운 추upward momentum, and ultimately drove the price back towards the weekly lows. The psychological level of $60, once a significant barrier, has now been breached, and the focus has firmly shifted to the downside targets. The data from the 1-day timeframe paints a grim picture: RSI at 36.77, MACD below its signal line with negative momentum, and Stochastic %K below %D in oversold territory ($17.83 / $31.40) all scream caution for bulls. The ADX at 41.41 underscores the strength of this prevailing downtrend.
The 4-hour timeframe offers a slightly more nuanced view, though still leaning bearish. Here, the ADX at 45.25 indicates a strong trend, aligning with the daily sentiment. However, the RSI at 50.7 is hovering precisely at the neutral line, suggesting a temporary pause or consolidation rather than outright capitulation. The Stochastic oscillator ($88.96 / $68.71) is in overbought territory, which on this timeframe, can often precede a pullback within a larger downtrend. The MACD is showing positive momentum, but given the broader daily bearish trend, this could simply be a corrective move within a larger down leg. The key takeaway from the 4-hour chart is that while short-term bounces are possible, the underlying strength of the downtrend is significant, making any rallies potential selling opportunities for astute traders.
On the shortest timeframe, the 1-hour chart, the picture gets even more muddled, highlighting the importance of considering multiple perspectives. The trend is technically classified as 'Bullish' with a strength of 86%, and the ADX at 22.98 suggests only a medium-strength trend. The RSI is at 62.32, firmly in neutral territory but leaning towards bullish. However, the Stochastic oscillator ($63.74 / $80.70) is showing a bearish divergence (%K below %D) and is heading towards the lower end of its range, a signal that often precedes a price decline. The MACD is positive, but this shorter timeframe momentum can often be whipsawed by larger trends. This conflict between timeframes is precisely what makes the current market environment so challenging and, for some, so potentially rewarding. It underscores the need for clear risk management and defined entry/exit points.
Navigating the Bearish Tide: Key Levels and Price Action
The daily chart's bearish signals are hard to ignore. The price has decisively broken below the 4000-mark, a level that previously acted as significant support. Now, this area is expected to act as resistance. The immediate support level to watch on the daily chart is $3978.68 (S1). A break below this could accelerate the decline towards $3930.90 (S2) and subsequently $3898.23 (S3). On the resistance side, the first significant hurdle for any potential bounce is the previous support turned resistance zone around $4059.13 (R1). Further up, $4091.80 (R2) and $4139.58 (R3) represent more substantial resistance areas that would need to be cleared convincingly to even consider a trend reversal. The range between $3978.68 and $4059.13 is likely to be a critical battleground in the coming week.
The daily RSI at 36.77 is noteworthy. While it indicates a bearish lean, it's not yet in the extreme oversold territory (typically below 30) that might suggest an imminent major bounce. This leaves room for further downside pressure before oversold conditions become a dominant factor. The MACD, currently below its signal line, reinforces the bearish momentum. For a bullish reversal signal on the daily chart, we would need to see the MACD histogram turn positive and cross above its signal line, a scenario that seems distant given the current price action. The Bollinger Bands also confirm the bearish sentiment, with the price trading below the middle band, indicating downside pressure. The Stochastic oscillator, with %K at 17.83 and %D at 31.40, is deeply oversold, which could lead to a short-term technical bounce, but this needs to be viewed within the context of the stronger downtrend.
The strength of the downtrend, as indicated by the ADX at 41.41 on the daily chart, is a critical piece of information. An ADX value above 40 signifies a strong, established trend. This means that attempts to trade against the trend are generally riskier and require tighter stop-losses. The fact that the ADX is high and rising suggests that the current bearish move has significant momentum behind it. This reinforces the idea that any rallies might be short-lived and primarily serve as opportunities for sellers to re-enter the market at better prices. Traders should be wary of trying to 'catch a falling knife' without clear confirmation signals or a defined risk management strategy.
Correlations and Macroeconomic Undercurrents
The correlation between gold (XAUUSD) and silver (XAGUSD) is often strong, but right now, they are telling slightly different stories, or at least presenting different nuances. While gold is currently trading at $4078.27 and showing a daily upward trend with a strong 86% bullish conviction on the 1H chart, silver is exhibiting more weakness on the daily timeframe. This divergence is interesting. Gold's relative strength might be attributed to its status as a premier safe-haven asset, potentially benefiting more directly from current geopolitical anxieties or expectations of a Fed pivot. Silver, while also a precious metal, has more industrial applications, making its price more sensitive to global economic growth prospects. The divergence suggests that the market's current risk sentiment might be favoring gold over silver, or that silver is simply lagging behind gold's recovery.
The US Dollar Index (DXY) is currently trading at 101.34, showing a slight daily decline of 0.13%. On the 1-hour chart, the DXY is in a neutral trend with mixed signals, but the daily chart presents a strong bullish trend (ADX 40.81) with RSI at 71.01 indicating overbought conditions. This overbought condition on the DXY is a potential headwind for the dollar in the short term, which could offer some breathing room for commodities like silver. However, the overall strong daily uptrend in the DXY suggests that any dollar weakness might be temporary. Historically, a strengthening dollar puts downward pressure on dollar-denominated commodities like silver, as they become more expensive for holders of other currencies. Therefore, the DXY's trajectory remains a crucial factor to monitor for XAGUSD.
Recent news indicates that the US Dollar Index weakened below 101.50 following the PCE inflation data, which eased Fed rate hike odds. This aligns with the slight pullback seen in the DXY today. The report also mentioned that labor market conditions remain stable but the pace of hiring is unlikely to be sustained. This could be interpreted as a mixed signal for the economy – stable but cooling. For silver, this might mean slightly less pressure from a strong dollar in the immediate term, but the cooling hiring trend could eventually translate into weaker industrial demand, posing a longer-term risk. The news about oil prices retreating as AI volatility picks up is also relevant. While oil is an energy commodity, its price movements can influence inflation expectations. A retreat in oil prices could suggest easing inflation concerns, which might reduce the appeal of precious metals as an inflation hedge, although gold's safe-haven status often overrides this.
The mention of Kaiser Aluminum (KALU) being a top metals pick by analysts is interesting, but it's important to distinguish between industrial metals and precious metals. While both are commodities, their drivers can differ significantly. Kaiser Aluminum's performance is more closely tied to industrial production and infrastructure spending, whereas silver's price is influenced by a broader mix of industrial demand, investment demand, and safe-haven flows. The fact that some analysts are bullish on industrial metals doesn't necessarily translate directly to a bullish outlook for silver, especially when its own technical indicators are flashing bearish signals.
Weekly Review: A Week of Bearish Consolidation
Last week was defined by the bears solidifying their grip on XAGUSD. After opening the week with cautious optimism, the price quickly faltered, failing to hold above the $60 psychological level. Several attempts to rally were met with stiff resistance, particularly around the $59.30-$60.00 range. The daily RSI consistently stayed below 50, and the MACD remained in negative territory for most of the week, confirming the bearish undertone. The breakdown below $58.74 on the 4-hour chart was a key event, signaling a shift in momentum and paving the way for the subsequent decline towards the current levels. The failure to hold support at $58.74, which was a significant pivot, underscored the selling pressure. The price action throughout the week was characterized by sharp sell-offs followed by weak, short-lived bounces, a pattern that often precedes further downside.
PriceONN's own market news highlighted this bearish pressure. Reports like 'Silver Price Forecast: XAG breaks below $60, bears eye $55' and 'Silver Price Forecast: RSI stays in oversold territory as XAG/USD struggles below $60' accurately captured the market sentiment. The struggle below $60 was a critical observation, as this level had previously acted as support and its breach signaled a potential acceleration of the downtrend. The mention of RSI staying in oversold territory on the daily chart (which is indeed the case with 31.33) is crucial. While oversold conditions can precede bounces, their persistence within a strong downtrend suggests that the market is deeply bearish and any upward moves might be corrective rather than indicative of a new trend. The news that XAG/USD was hovering near seven-month lows around $56.50 also aligns with the current bearish outlook, indicating that the current price of $58.73 might be a temporary reprieve before further declines.
The $60 level proved to be a significant turning point. Its breakdown, as noted in the PriceONN news 'Silver Breaks Below $60, Can $50 Hold?', was a major bearish signal. The question of whether $50 could hold is now a long-term consideration, but the immediate focus remains on the next key support levels. The news about silver price falling to near $56.50 amid rising Fed rate hike odds provides a fundamental driver for the bearish move. Higher interest rates increase the opportunity cost of holding non-yielding assets like silver and also tend to strengthen the US dollar, both of which are negative for silver prices. The 'Fed Tightens Its Tone as Price Returns to the Volume Profile Zone' from June 23rd also suggests that central bank policy is a significant factor, potentially signaling a less dovish stance which would be bearish for silver.
Technically, the key levels that were tested and broken last week included the psychological $60.00 mark, followed by the 4-hour support at $58.74. The daily support at $56.43 remains the next major hurdle. The failure to hold these levels indicates a lack of buying conviction and a willingness from sellers to push prices lower. Resistance levels around $59.10 (daily R1) and $60.38 (daily R2) are now areas where any upward movement is likely to face selling pressure. The inability of the bulls to reclaim these levels reinforces the bearish bias. The overall trend across multiple timeframes, particularly the daily and 4-hour charts, is down, with strong ADX readings confirming the trend's power.
Next Week Outlook: Bears in Control, But Watch for Bounces
Looking ahead to next week, the prevailing sentiment for XAGUSD remains cautiously bearish, primarily driven by the technical setup on the daily chart and the persistent strength of the US Dollar Index. The ADX readings across the 4H and 1D charts (45.25 and 41.41 respectively) suggest that the strong downtrend is likely to continue. The immediate focus will be on the daily support at $3978.68. A decisive break below this level would confirm the bearish thesis and open the door for a move towards $3930.90 and potentially lower. Resistance at $4059.13 (daily R1) will be the key level to watch for any potential short-covering rallies or trend exhaustion signals. A sustained move above this level would be required to invalidate the current bearish outlook.
The RSI at 31.33 on the daily chart is approaching oversold territory. This suggests that while the downtrend is strong, the pace of selling might slow down, and a technical bounce is becoming increasingly likely. However, as the PriceONN news suggested, oversold conditions alone are not a reason to buy in a strong downtrend. A bounce from these levels might be a dead-cat bounce, offering a selling opportunity rather than the start of a new uptrend. Traders should be looking for confirmation signals on shorter timeframes, such as bullish divergences on the RSI or MACD, or a break above immediate resistance levels on the 1-hour or 4-hour charts, before considering any long positions.
Key events to watch next week include any major economic data releases that could influence Fed policy expectations. While the latest PCE data showed stable but cooling inflation and easing rate hike odds, any surprises in upcoming employment or inflation reports could significantly shift market sentiment. The DXY's reaction to these events will be critical. If the DXY resumes its upward trend, it will likely add further pressure on silver. Conversely, any significant dollar weakness could provide a much-needed catalyst for a silver short-squeeze. The geopolitical landscape also remains a background factor; any escalation of tensions could increase safe-haven demand, potentially benefiting gold more directly but also offering some support to silver.
From a trading perspective, the strategy for next week likely involves looking for opportunities to fade rallies. Selling into strength, particularly around the resistance levels of $4059.13 (R1) or even $4091.80 (R2), could be a viable approach, provided risk is managed tightly with stop-losses placed above these levels. Alternatively, traders might wait for a decisive break below $3978.68 (S1) to enter short positions, targeting the subsequent support levels. The key is to align trades with the dominant daily trend while being mindful of the potential for short-term bounces from oversold conditions. Patience and discipline will be crucial in navigating this bearish environment.
Bearish Scenario: Downtrend Continuation
70% ProbabilityNeutral Scenario: Consolidation and Range Play
20% ProbabilityBullish Scenario: Short-Term Bounce and Trend Shift Attempt
10% Probability자주 묻는 질문: XAGUSD 분석
XAGUSD가 3978.68달러 지지선 아래로 하락하면 어떻게 되나요?
3978.68달러(일봉 S1) 아래로 결정적인 하락은 추가 매도 압력을 유발하여 약세 추세를 확인할 가능성이 높습니다. 다음 주요 목표는 3930.90달러(S2)이며, 잠재적으로 3898.23달러(S3)까지 하락할 수 있습니다.
과매도 RSI를 고려할 때 현재 58.73달러 근처에서 XAGUSD를 매수하는 것을 고려해야 할까요?
과매도 RSI(현재 일봉 31.33)만을 근거로 매수하는 것은 강한 하락 추세(ADX 41.41)에서 위험합니다. 단기 반등은 가능하지만, 높은 확률의 진입은 강세 다이버전스 또는 4059.13달러와 같은 즉각적인 저항선 돌파와 같은 확인 신호를 필요로 합니다.
17.83달러 / 31.40달러의 스토캐스틱 신호는 XAGUSD에 대한 신뢰할 수 있는 매도 신호인가요?
일봉 차트에서 스토캐스틱 오실레이터가 과매도 상태(17.83달러 / 31.40달러)라는 것은 소진을 시사하지만, 강한 하락 추세에서는 장기간 과매도 상태를 유지할 수 있습니다. 이 신호는 지속적인 추세 반전보다는 단기 반등 가능성을 더 많이 나타냅니다.
101.34 근처의 DXY 현재 중립적 입장이 다음 주 XAGUSD에 어떤 영향을 미칠까요?
101.34 근처에서 통합되는 DXY는 은에 일시적인 안도감을 제공합니다. 그러나 DXY의 일봉 강세 추세는 잠재적인 재강세를 시사하며, 이는 XAGUSD에 추가적인 압력을 가할 가능성이 높습니다. 그러나 상당한 달러 약세는 은 반등의 촉매제가 될 수 있습니다.
| 지표 | 값 | 신호 | 해석 |
|---|---|---|---|
| RSI (14) | 31.33 | 약세 | 과매도, 반등 가능성 있으나 강한 하락 추세 지속 |
| MACD 히스토그램 | -15.20 | 약세 | 음의 모멘텀 지속적으로 구축 중 |
| 스토캐스틱 | 17.83 / 31.40 | 약세 | 깊은 과매도, 매도 신호에 주의 필요 |
| ADX | 41.41 | 강세 | 강한 하락 추세 확인됨 |
| 볼린저 밴드 | 중간 밴드 | 약세 | 가격이 중간 밴드 아래에서 거래되어 약세 압력 시사 |