The relentless tug-of-war between bullish and bearish forces has brought Silver (XAGUSD) to a pivotal juncture, currently trading at $74.51. This level is more than just a number; it's a battleground where the prevailing narrative of dollar strength and cooling inflation clashes with the enduring appeal of precious metals as a hedge against uncertainty. With the 1-hour chart showing a strong 86% downward trend and the daily indicators leaning heavily towards a sell signal, the bears appear to be in the driver's seat. However, the RSI hovering in neutral territory and a glimmer of divergence in the Stochastic oscillator on shorter timeframes suggest that the selling pressure might be exhausting, opening the door for a potential bullish counter-offensive if key conditions are met. This analysis delves into the competing forces shaping XAGUSD's immediate future, examining the fundamental drivers and technical signals that could dictate its next move.
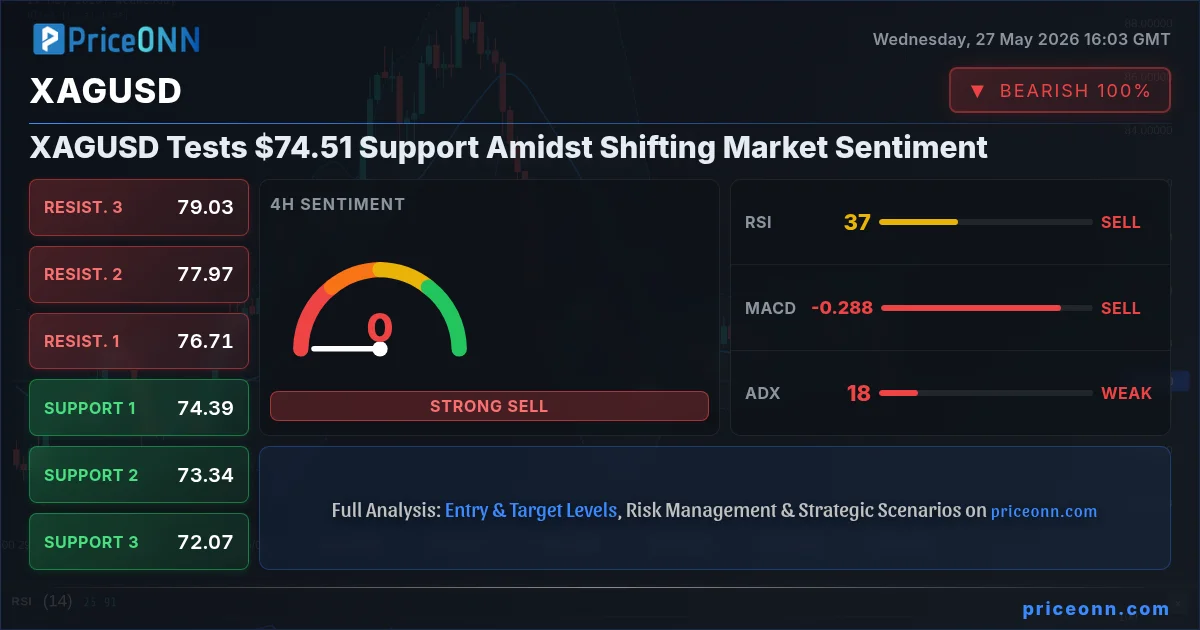
- XAGUSD is currently trading at $74.51, testing key support levels.
- The 1-hour RSI at 32.78 signals a neutral zone with a downward bias, while the 4-hour RSI at 28.09 indicates oversold conditions.
- The Dollar Index (DXY) is showing strength, trading at 98.92, which typically pressures silver prices.
- Recent Australian CPI data cooled, potentially influencing RBA policy and impacting AUD/USD, though direct impact on XAGUSD requires careful correlation analysis.
- Despite a generally bearish technical outlook across multiple timeframes, subtle divergences in oscillators hint at potential price exhaustion.
The global economic landscape is currently a complex tapestry, woven with threads of persistent inflation concerns, shifting central bank policies, and geopolitical undercurrents. In this environment, Silver (XAGUSD) has found itself under significant pressure, trading at $74.51. The strength of the Dollar Index (DXY), currently at 98.92 and showing a 1-hour trend strength of 81%, often acts as a headwind for dollar-denominated commodities like silver. A stronger dollar makes silver more expensive for holders of other currencies, potentially dampening demand. Furthermore, recent economic data, such as the cooling Australian inflation (reported at 4.2% year-on-year, below forecasts), signals a potential shift in global monetary policy. While this specific data point directly impacts AUD/USD, it contributes to a broader narrative that central banks might be nearing the end of their tightening cycles, or at least slowing their pace. This macro environment, coupled with a predominantly bearish technical picture across XAGUSD's daily and 4-hour charts, paints a challenging picture for the precious metal in the short term.
The Bearish Case: Dollar Strength and Technical Weakness
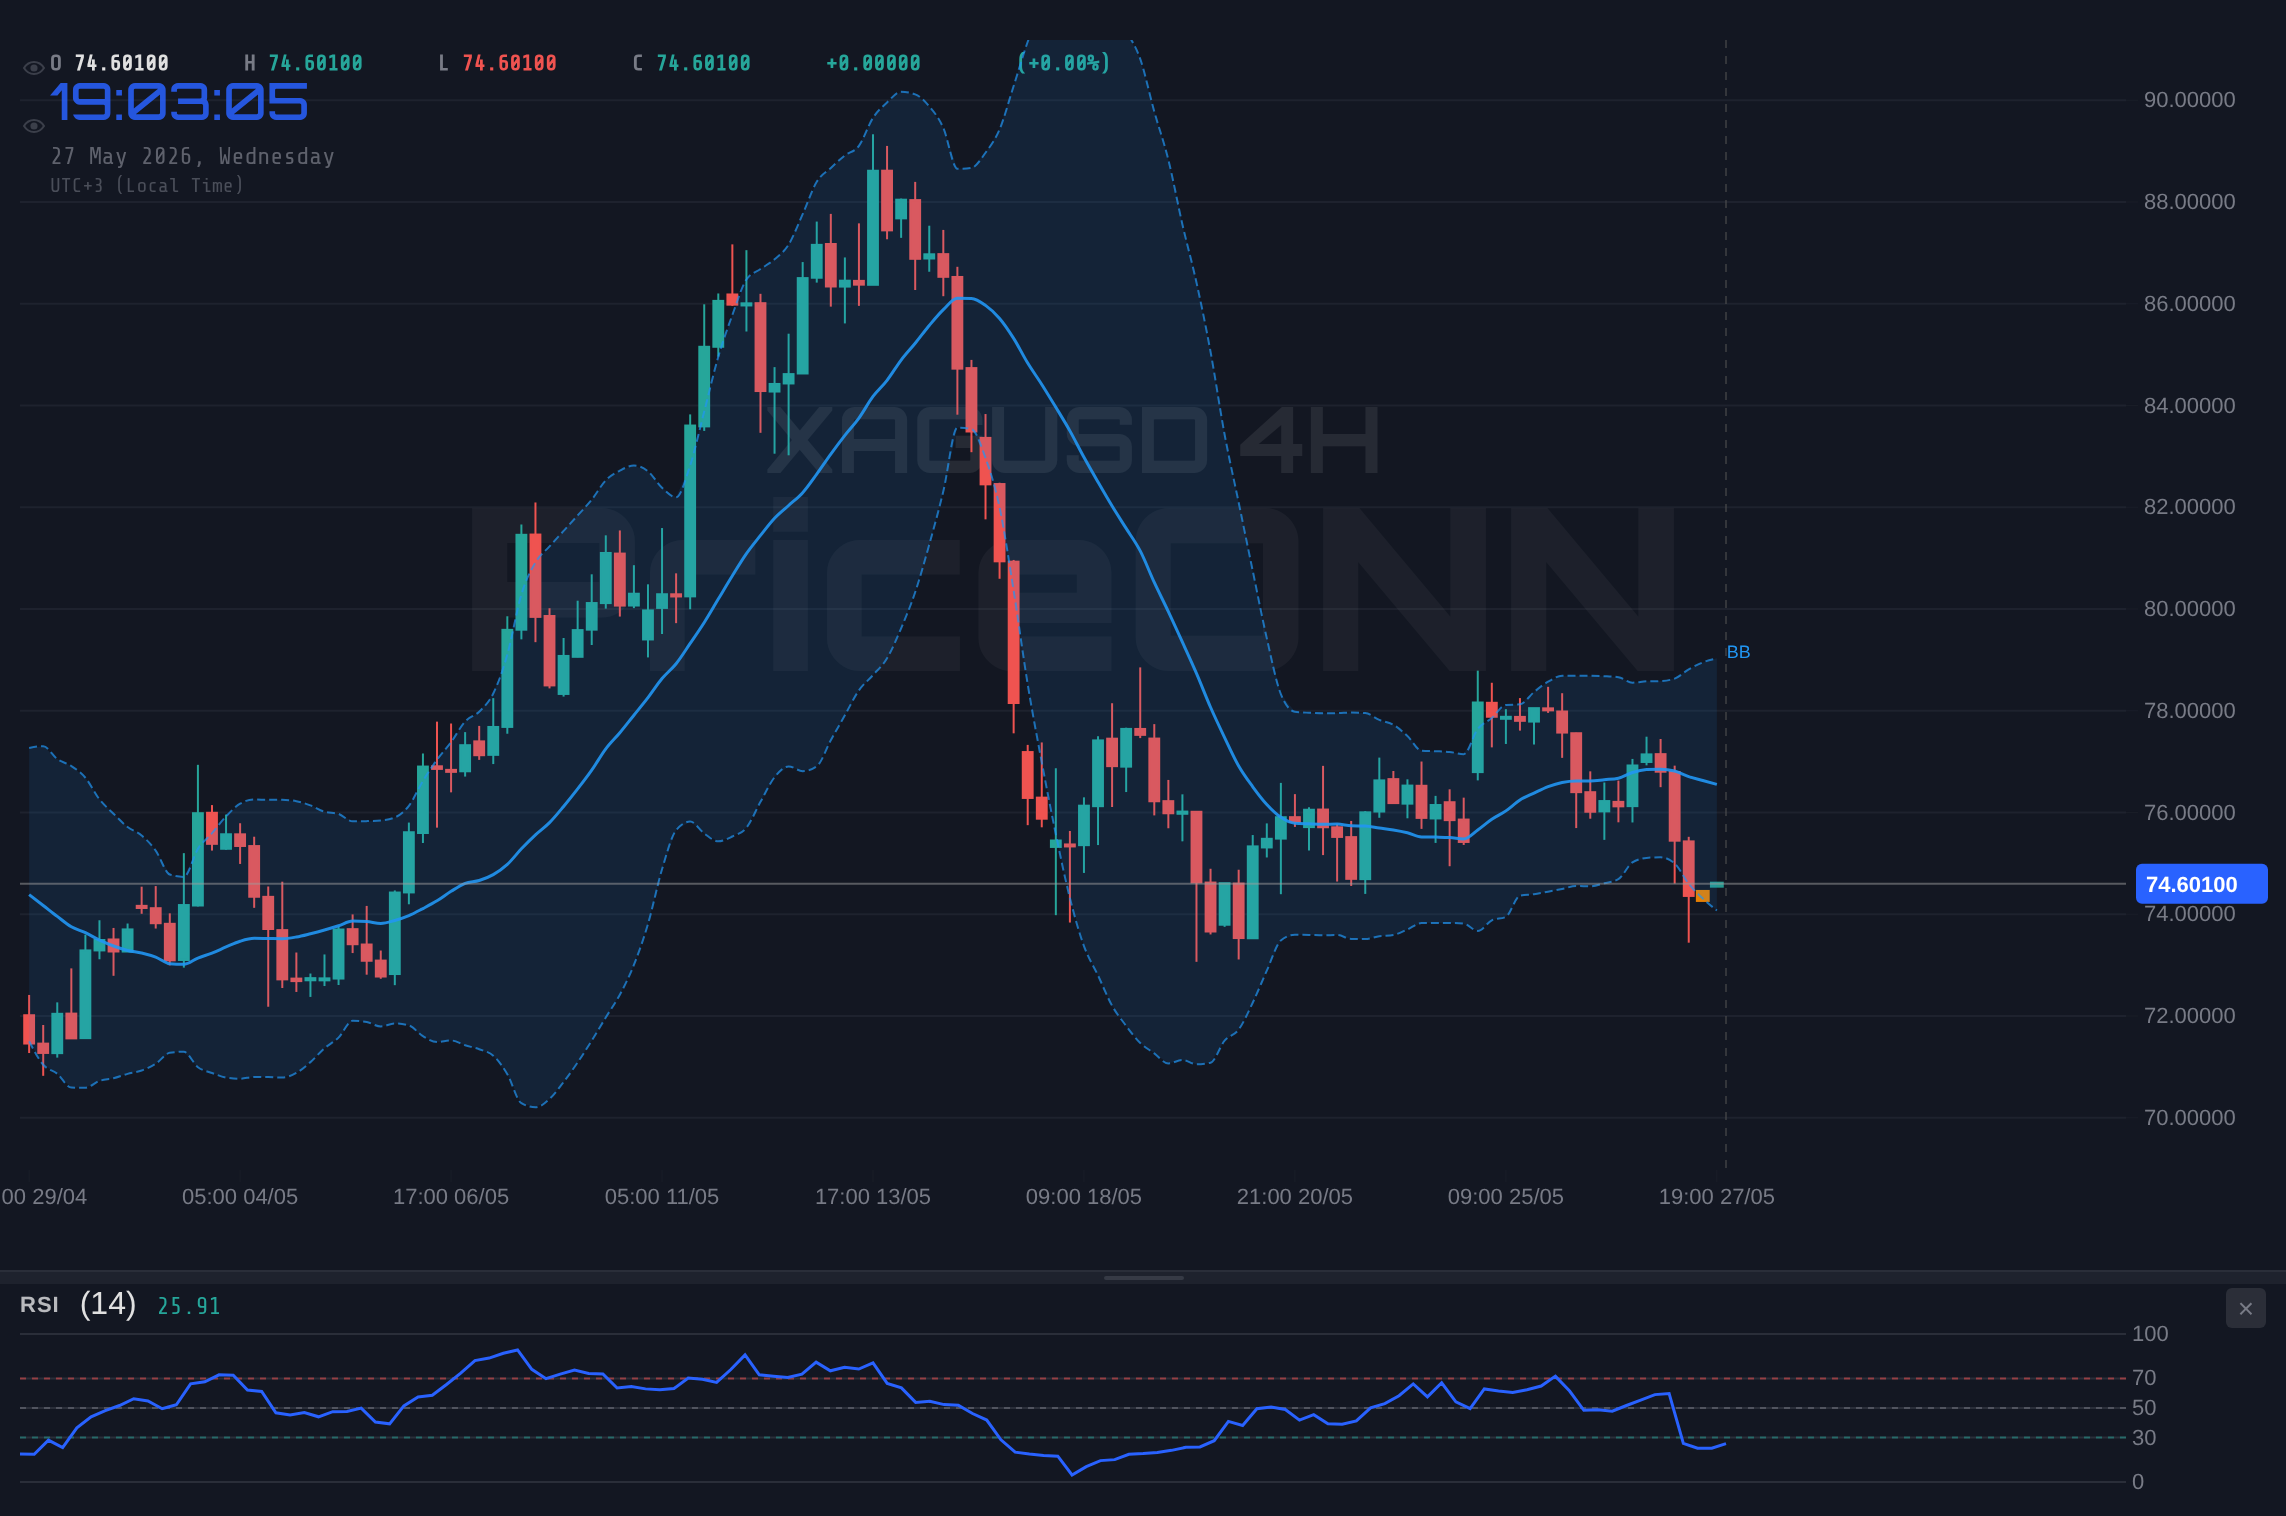
The most immediate and compelling argument for further downside in XAGUSD stems from the confluence of a strengthening US Dollar and a predominantly bearish technical setup. The DXY's ascent to 98.92, supported by positive momentum on the 1-hour chart and a solid 81% trend strength, is a significant factor. As the dollar gains ground against a basket of major currencies, assets priced in dollars, including silver, tend to face selling pressure. This is a well-established correlation that traders closely monitor. Technically, the picture is equally stark. On the 4-hour timeframe, which often dictates medium-term price action, XAGUSD exhibits a 100% downward trend. The RSI(14) is firmly entrenched in oversold territory at 28.09, suggesting that the selling has been aggressive. The MACD indicator is printing negative momentum, with the MACD line consistently below its signal line, reinforcing the bearish sentiment. Bollinger Bands on this timeframe are hugging the lower band, indicating significant downward pressure and a potential for further extension into oversold territory. Even on the daily chart, the trend remains decidedly bearish with 91% strength, RSI at 37.54, and MACD showing negative momentum, underscoring the prevailing bearish sentiment.
Adding to the bearish narrative is the ADX indicator across multiple timeframes. On the 1-hour chart, the ADX stands at 32.06, indicating a strong downward trend. This strength is consistent on the 4-hour chart (ADX 21.8) and the daily chart (ADX 21.74), suggesting that the current price action is not merely a minor fluctuation but part of a more sustained directional move. While ADX values above 25 generally signify a strong trend, the readings here, particularly on the shorter timeframes, point towards sellers being in firm control. The general signal across all analyzed timeframes (1H, 4H, 1D) is overwhelmingly 'SELL', with a significant majority of technical indicators pointing towards further price declines. This technical consensus, combined with the macro backdrop of a strengthening dollar and the implications of cooling inflation data on future monetary policy, provides a robust foundation for the bearish outlook on XAGUSD.
The Bullish Counter-Argument: Oversold Conditions and Divergence
Despite the prevailing bearish sentiment, a closer examination of the technical indicators reveals subtle signs that could suggest a potential bottoming formation or at least a pause in the relentless sell-off. On the 4-hour chart, the RSI(14) has plunged to 28.09, firmly within the oversold territory. While oversold conditions don't automatically signal a buy, they often precede significant price reversals, as sellers become exhausted and buyers begin to step in, looking for value. Similarly, the Stochastic oscillator on the 1-hour chart is showing a potential bullish divergence. With its K line at 30.68 and D line at 19.3, the %K is above %D, hinting at a potential upward cross and a shift in momentum, even though the overall trend remains down. This divergence, where price might be making lower lows but oscillators are starting to tick up, is often a precursor to a bounce.
Furthermore, the daily chart, while still showing a bearish trend, presents a less dire picture in some indicators. The RSI at 37.54 is approaching oversold territory, and while still trending down, it offers more room for a potential recovery compared to the deeply oversold 4-hour RSI. The Stochastic on the daily chart (K=19.87, D=21.64) also shows a similar pattern to the 1-hour chart, with the K line nearing a cross above the D line, suggesting that the downward momentum might be losing steam. While the ADX readings across all timeframes indicate a strong trend, a sustained trend eventually requires consolidation or reversal. If buyers can defend the critical support levels identified around $74.01 and $73.75, a short-covering rally could ensue, driven by profit-taking from the heavily shorted positions. The recent news regarding Australian inflation cooling could also be interpreted by some market participants as a sign that global inflationary pressures are easing, which *might* lead to less aggressive central bank policies in the future – a narrative that could, in theory, support precious metals as a safe-haven asset, albeit indirectly.
Navigating the Uncertainty: Correlation and Macroeconomic Context
Understanding the potential trajectory of XAGUSD requires looking beyond its own charts and considering its correlations with broader market forces. The DXY's current strength at 98.92 is a primary concern for silver bulls. Historically, a rising DXY often correlates with falling silver prices due to the inverse relationship between the dollar and dollar-denominated commodities. However, this correlation is not always perfect. Sometimes, during periods of extreme market stress or specific geopolitical events, both the dollar and silver can rise simultaneously as investors seek safety in different forms. Currently, the DXY's upward momentum suggests the dollar is the preferred safe haven, which is bearish for silver. Looking at equity markets, the SP500 is showing a positive daily trend (6572.87), indicating some risk appetite, while the Nasdaq 100 (29850.44) shows a mixed picture with a strong 4H uptrend but a bearish 1H signal. A decline in risk appetite, reflected by a fall in these indices, could boost demand for silver as a safe haven, potentially counteracting the dollar's strength.
The recent news highlighting cooling inflation in Australia (4.2% YoY) and the potential for a June rate hike signal from the ECB (affecting EUR/CAD) paints a picture of diverging monetary policy paths globally. While the RBA's data might suggest a pause, the ECB's hawkish signals imply continued vigilance against inflation in Europe. This divergence adds complexity to currency markets and, by extension, to commodities. For silver, the key question remains: will the narrative of potentially peaking global inflation lead central banks to ease their hawkish stance, thereby weakening the dollar and supporting gold and silver? Or will persistent inflation fears continue to fuel demand for the dollar as a safe haven, keeping pressure on precious metals? The current price action at $74.51 suggests the market is leaning towards the latter, but any shift in central bank rhetoric or a significant geopolitical event could quickly alter this dynamic. Traders are keenly watching the upcoming economic calendar for clues, particularly any data that might influence the Federal Reserve's next move.
The Verdict: A Tightrope Walk Above Critical Support
The market is currently at a critical juncture for XAGUSD. The overwhelming technical signals across the 1-hour, 4-hour, and daily charts point towards continued bearish pressure, driven by dollar strength and the momentum of the downtrend. The ADX confirms the existence of strong trends, and the majority of indicators suggest selling. The price of $74.51 is currently being tested as a support level, with immediate lower targets at $74.01 and $73.75. A decisive break below these levels could accelerate the decline, potentially targeting the $73.24 support. The prevailing sentiment, supported by the DXY's strength, is that the path of least resistance remains to the downside.
However, the bullish case cannot be entirely dismissed. The oversold conditions on the 4-hour RSI (28.09) and the Stochastic divergences on shorter timeframes suggest that the selling momentum might be waning. If buyers can successfully defend the $74.01-$73.75 support zone, a short-covering rally could emerge. Such a rally would likely target the nearest resistance at $74.79, followed by $75.30. Confirmation of a bullish reversal would require a sustained break above these resistance levels, coupled with a weakening DXY and perhaps a shift in broader market sentiment towards risk-on. For now, the immediate outlook remains cautious, with the market walking a tightrope above crucial support. The bears hold the advantage, but the oversold conditions present a potential risk for sellers if a significant catalyst for a short squeeze emerges.
Bearish Scenario: Sellers Consolidate Control
65% ProbabilityBullish Scenario: Support Holds, Reversal Beckons
15% ProbabilityNeutral Scenario: Consolidation Around $74.51
20% ProbabilityFrequently Asked Questions: XAGUSD Analysis
What happens if XAGUSD breaks below the $74.01 support level?
A break below $74.01 would likely trigger further selling, with the next immediate target at $73.75. This scenario is supported by the strong bearish trend indicated by the ADX and the oversold conditions on the 4-hour RSI, suggesting momentum could accelerate to the downside.
Should I consider buying XAGUSD at the current $74.51 level given the oversold RSI on the 4-hour chart?
Buying at $74.51 carries significant risk due to the prevailing bearish trend and dollar strength. While the 4-hour RSI at 28.09 is oversold, a more conservative approach would be to wait for confirmation, such as a hold above $74.01 and a break of resistance at $74.79, before considering long positions.
Is the Stochastic divergence on the 1-hour chart a reliable buy signal for XAGUSD at $74.51?
The Stochastic divergence, with %K above %D, suggests potential waning downward momentum. However, on its own, it's not a strong buy signal given the overall bearish trend and weaker ADX on longer timeframes. Confirmation from price action holding key support and breaking resistance would be needed.
How will the cooling Australian inflation data potentially affect XAGUSD's price near $74.51?
Cooling inflation globally, as seen in Australia, could imply a pause or slowdown in central bank rate hikes. This might eventually weaken the US Dollar, which would be supportive for XAGUSD. However, the immediate impact is overshadowed by current dollar strength and silver's own bearish technical setup around $74.51.
Technical Outlook Summary
| Indicator | Value | Signal | Interpretation |
|---|---|---|---|
| RSI (14) | 32.78 | Neutral | Nearing oversold on 1H, but biased downwards. |
| MACD Histogram | -15.20 | Bearish | Negative momentum persists across timeframes. |
| Stochastic | K:30.68, D:19.3 | Bullish Divergence (1H) | Potential for short-term bounce, but trend is down. |
| ADX | 32.06 | Strong Trend | Confirms strong downward trend on 1H. |
| Bollinger Bands | Lower Band Breach | Bearish | Price below middle band, indicating selling pressure. |
Key Levels
Track markets in real-time
AI-powered analysis, technical indicators and real-time price data.
Join Our Telegram Channel
Breaking market news, AI analysis and trading signals instantly.
Join Channel