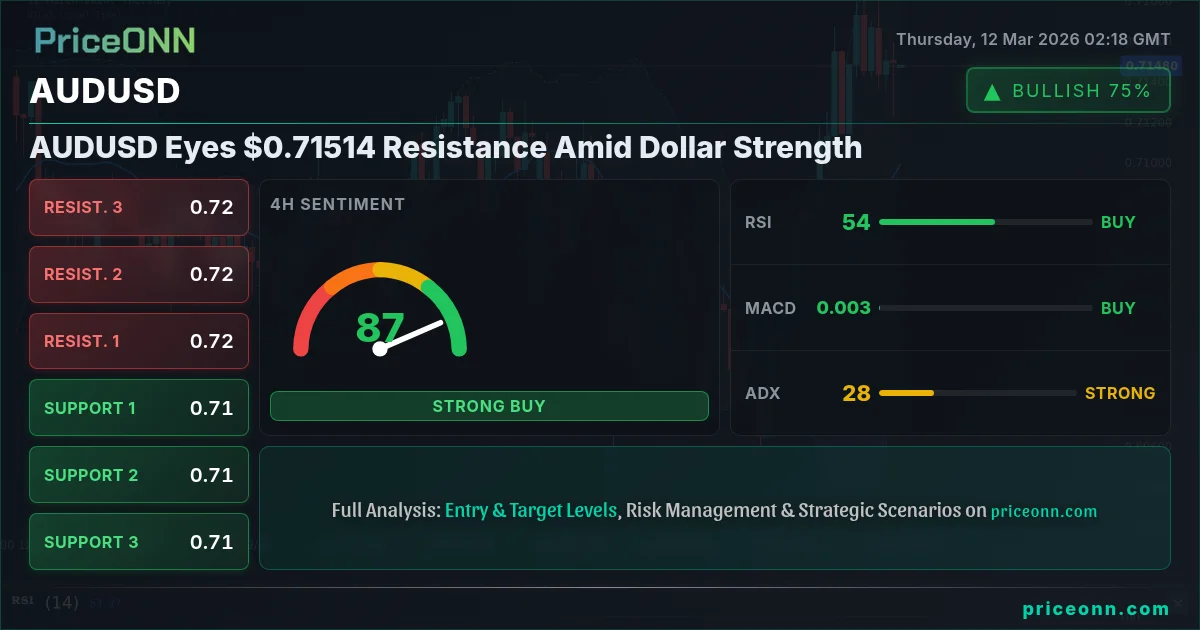
AUDUSD finds itself testing key resistance around $0.71514, a level that could determine the pair's short-term trajectory. With the dollar index (DXY) showing strength, the path ahead for the Aussie dollar is fraught with challenges. A break above this resistance could signal further upside, while rejection could lead to a deeper retracement.
- RSI at 52.35 suggests moderate bullish momentum, but not yet overbought.
- Immediate resistance lies at $0.7152, a break above which could trigger further gains.
- Stochastic oscillator showing a potential bullish crossover, signaling upward momentum.
- DXY's strength is a significant headwind for AUDUSD, requiring a break of the correlation for sustained gains.
Time Horizon: This analysis is for swing traders looking at opportunities over the next 1-2 weeks.
Technical Overview: AUDUSD at a Crossroads
Currently, AUDUSD is trading at $0.71514, and the technical picture presents a mixed bag of signals. On the 1-hour timeframe, the trend is neutral, but the RSI at 52.35 suggests that the bulls are attempting to gain ground, although not yet in overbought territory. The MACD histogram shows negative momentum, but the Stochastic oscillator hints at a potential bullish crossover, indicating a possible shift in momentum. This conflicting information suggests that the pair is at a crucial juncture, where either the bulls will take control, or the bears will regain dominance.
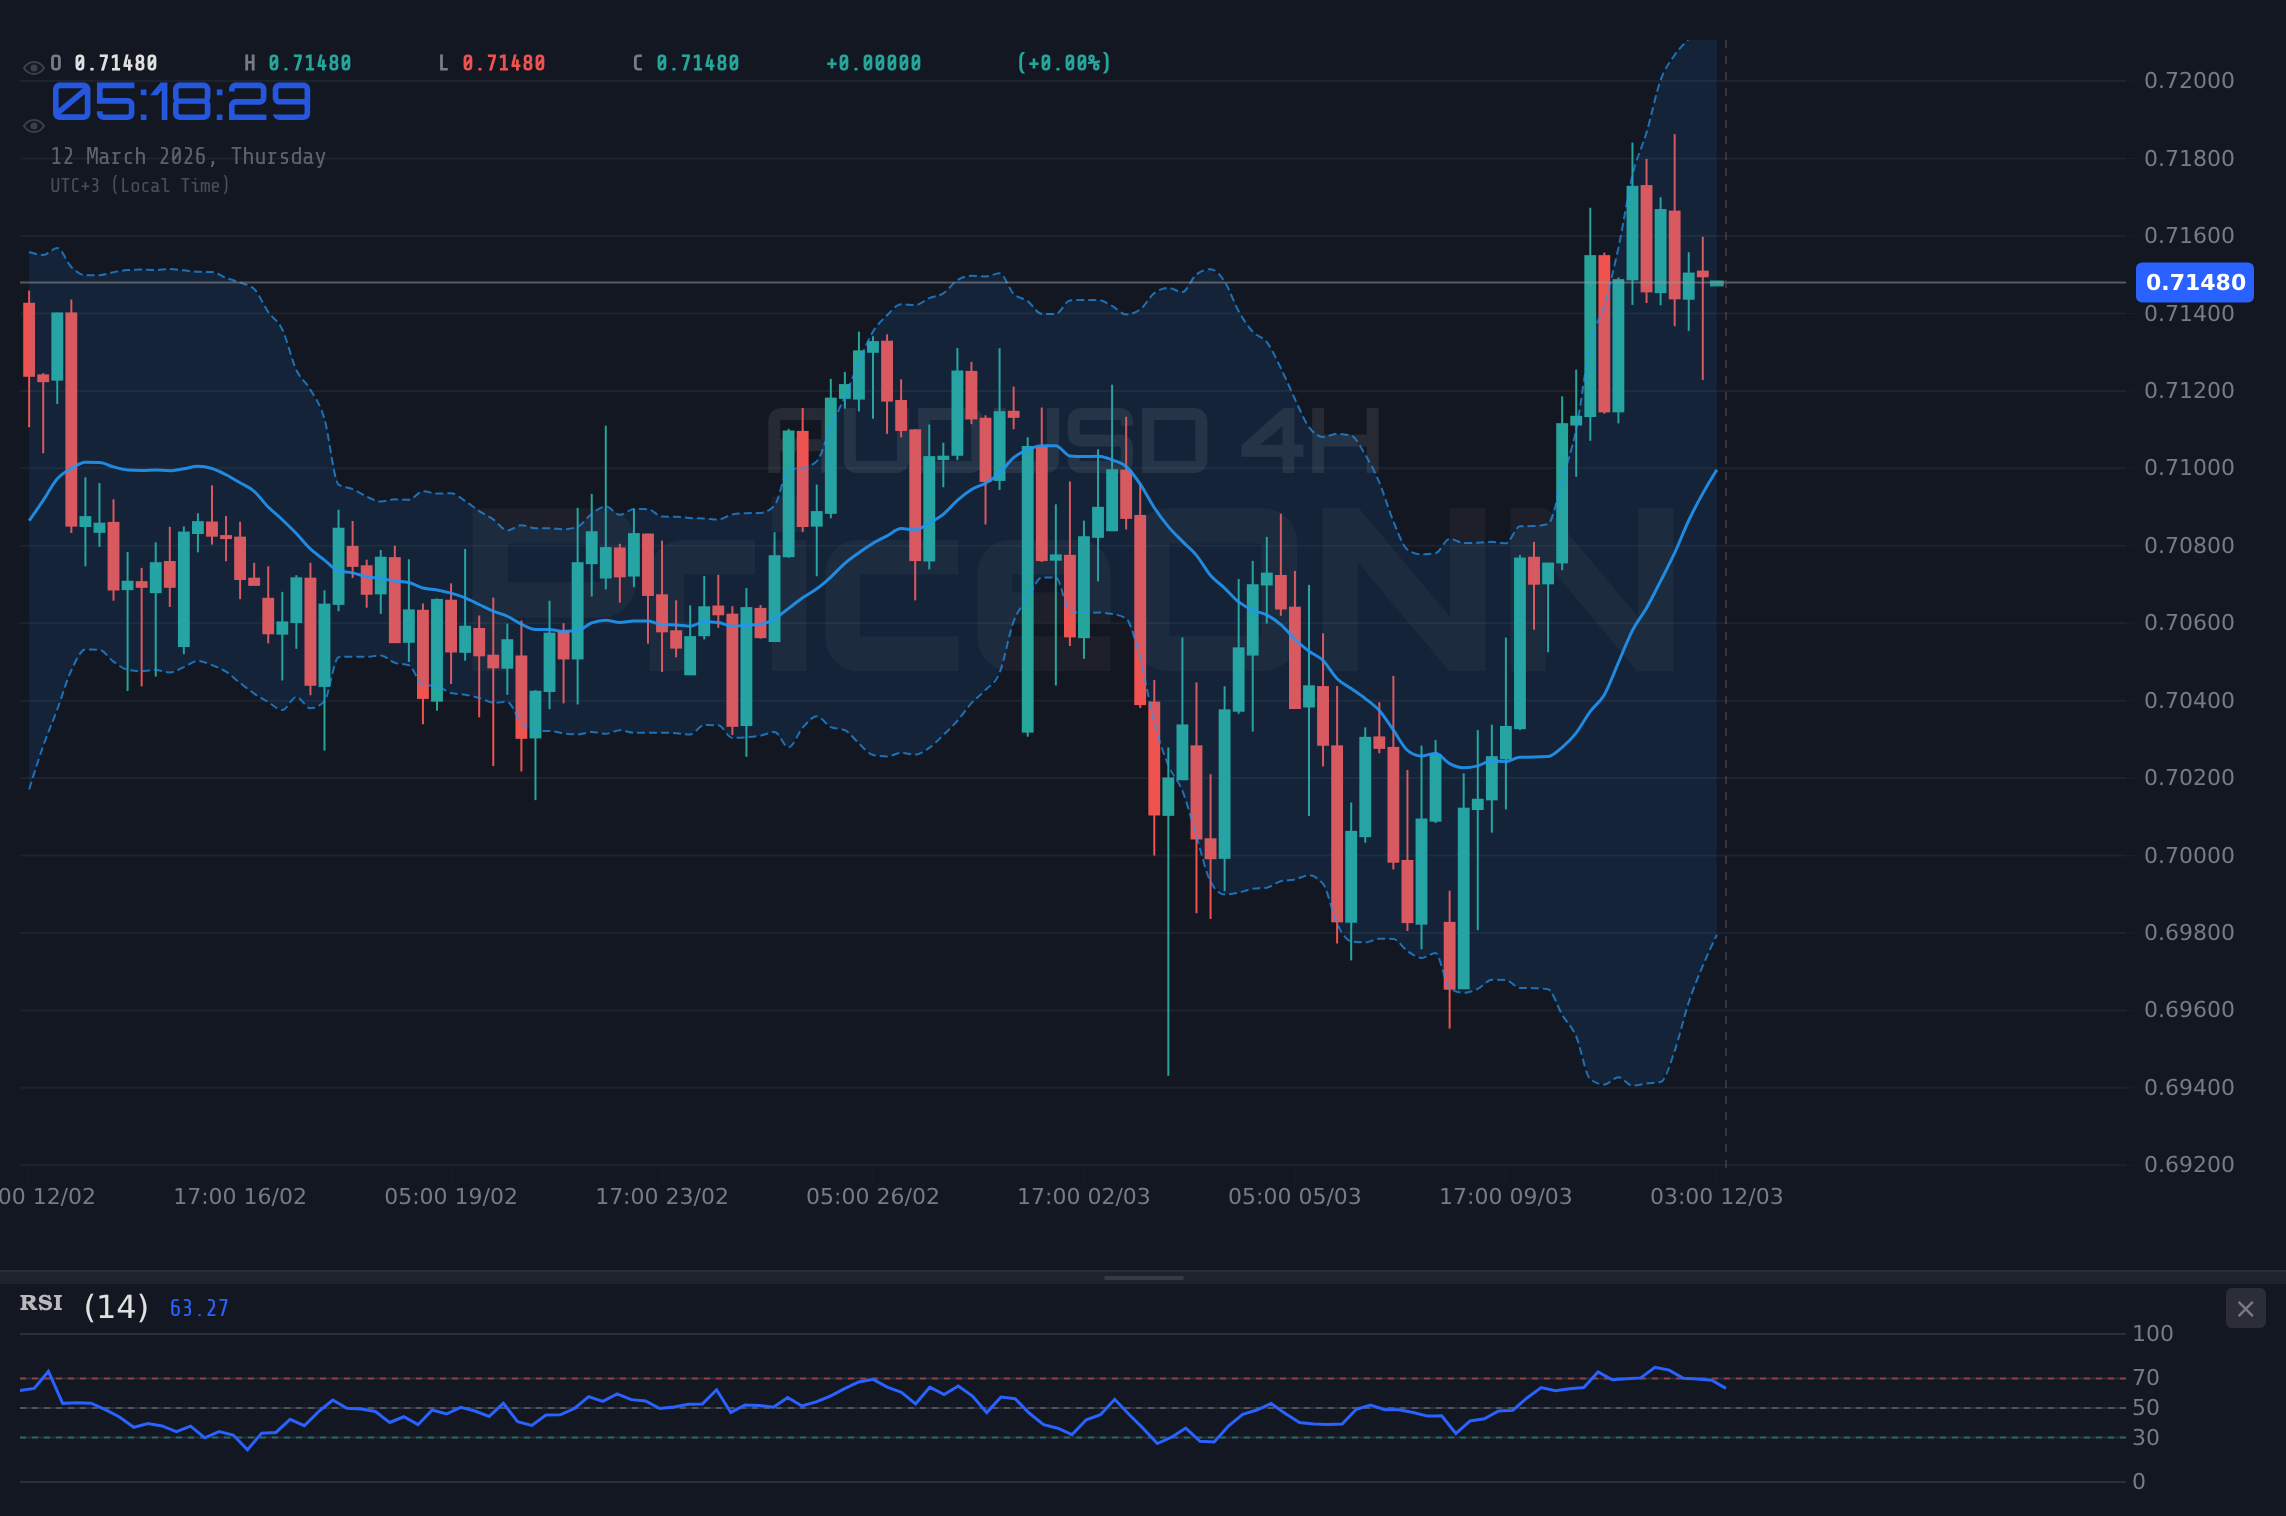
Looking at the 4-hour timeframe, the trend remains neutral. The RSI at 59.69 is also in neutral territory, but trending upward. The MACD shows positive momentum, further supporting the bullish sentiment. However, the Stochastic oscillator presents a different picture, with %K at 58.44 and %D at 75.16, signaling a potential overbought condition. This divergence highlights the importance of monitoring price action closely to confirm any potential breakouts or reversals.
On the daily chart, the trend is clearly bullish. The RSI at 62.1 underscores the overall upward momentum. However, the MACD histogram is showing negative momentum despite the broader trend, which could indicate a period of consolidation or a potential pullback. It's worth noting that the Bollinger bands show the price testing the upper band, hinting at overbought conditions or a potential breakout. The ADX at 28.43 confirms a strong uptrend, suggesting that the current bullish momentum is likely to continue, but caution is advised given the conflicting signals.
Decoding Key Support and Resistance
Key support levels to watch include $0.71296 (1H support), $0.7115 (1H support), and $0.71072 (1H support). A break below these levels could signal a shift in sentiment and potentially trigger a deeper correction. On the resistance side, immediate resistance lies at $0.7152 (1H resistance), followed by $0.71598 (1H resistance) and $0.71744 (1H resistance). A successful break above these resistance levels could open the door for further upside, targeting higher levels.
Zooming out to the daily chart, the key support level is $0.70557, followed by $0.69967 and $0.69409. These levels would likely act as strong floors in case of a significant pullback. On the upside, the key resistance levels are $0.71705, $0.72263, and $0.72853. Breaching these levels could pave the way for a sustained rally.
The Bull vs. Bear Case for AUDUSD
The bull case for AUDUSD rests on the overall bullish trend observed in the daily chart. The RSI, although in neutral territory, is trending upward, and the ADX confirms a strong uptrend. If AUDUSD can successfully break above the immediate resistance at $0.7152 and hold, it could attract further buying interest, potentially targeting the daily resistance levels at $0.71705 and beyond. The Stochastic on the daily timeframe also signals a bullish crossover, further supporting the upward momentum.
The bear case, however, hinges on the dollar index (DXY)'s current strength. As the DXY strengthens, AUDUSD tends to face headwinds. Moreover, the MACD histogram showing negative momentum on the daily chart raises concerns about a potential pullback. If AUDUSD fails to break above $0.7152 and instead breaks below the 1H support levels, it could signal a shift in sentiment and potentially trigger a deeper correction, targeting the daily support levels at $0.70557 and lower.
Watching the Economic Calendar
The economic calendar presents several potential catalysts for AUDUSD. The upcoming GBP data on Friday could indirectly impact AUDUSD through cross-currency dynamics. More directly, the upcoming USD data on Friday could have a significant impact on the dollar index and, consequently, on AUDUSD. Investors will be closely watching these releases to gauge the strength of the US economy and the potential implications for Federal Reserve policy.
Earlier in the week, the USD data on Wednesday and EUR data on Wednesday could have already influenced market sentiment. However, the immediate focus shifts to the upcoming GBP and USD data on Friday, which could provide fresh impetus for AUDUSD.
Trade Recommendation: Cautious Bullish Stance
Given the mixed signals and the potential for volatility, a cautious bullish stance seems appropriate for AUDUSD. The overall trend is bullish, but the dollar's strength and the conflicting indicator signals warrant caution. It is important to manage risk effectively and wait for confirmation before entering any positions.
AUDUSD breaks above $0.7152 resistance and holds, targeting $0.71705 and $0.72263. Confirmation comes from a sustained break of DXY below 99.00. This scenario assumes continued risk appetite and a weakening dollar.
AUDUSD fails to break above $0.7152 and breaks below $0.71296 support. Targets include $0.7115 and $0.71072. This scenario is triggered by continued DXY strength and risk-off sentiment in the market.
Risk Management and Forward-Looking Strategy
Given the upcoming economic data releases and the conflicting technical signals, risk management is paramount. Traders should consider using stop-loss orders to protect their capital and avoid over-leveraging their positions. Patience will likely be rewarded, as waiting for confirmation before entering any trades can significantly improve the odds of success.
Frequently Asked Questions: AUDUSD Analysis
What happens if AUDUSD breaks above $0.7152 resistance?
A break above $0.7152 resistance would likely open the door for further upside, targeting $0.71705 and potentially $0.72263. This scenario would be confirmed by a sustained break of the dollar index (DXY) below 99.00.
Should I buy AUDUSD at current levels of $0.71514 given the DXY strength?
Given the dollar index's strength, caution is warranted. It might be prudent to wait for a confirmed break above $0.7152 resistance before considering a long position. A stop-loss order below $0.71296 would help manage risk.
Is RSI at 62.1 on the daily chart a sell signal for AUDUSD right now?
While RSI at 62.1 suggests that AUDUSD is approaching overbought territory, it is not necessarily a sell signal on its own. It's important to consider other indicators and price action before making any decisions. A break below key support levels would provide further confirmation of a potential reversal.
How will the upcoming USD data on Friday affect AUDUSD this week?
The upcoming USD data on Friday could have a significant impact on the dollar index and, consequently, on AUDUSD. Stronger-than-expected data could boost the dollar, putting downward pressure on AUDUSD, while weaker-than-expected data could weaken the dollar, providing a tailwind for AUDUSD.
Technical Outlook Summary
| Indicator | Value | Signal |
|---|---|---|
| RSI (14) | 52.35 | Neutral |
| MACD Histogram | Negative | Bearish |
| Stochastic | 46.48 | Bullish |
| ADX | 19.51 | Weak Trend |
| Bollinger | Middle Band | Watch |
Key Levels
Support Levels
Resistance Levels
Track markets in real-time
AI-powered analysis, technical indicators and real-time price data.
Join Our Telegram Channel
Breaking market news, AI analysis and trading signals instantly.
Join Channel