

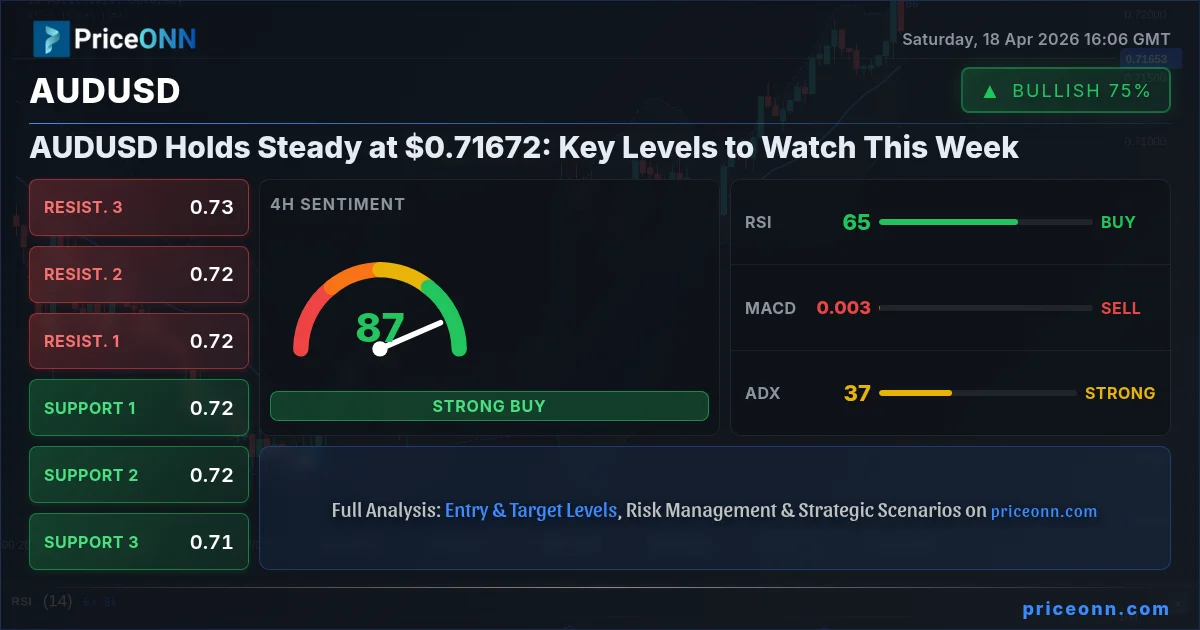
The Australian Dollar against the US Dollar, AUDUSD, has entered a critical juncture, trading around the $0.71672 mark as the market digests mixed signals and awaits clearer direction. This past week has been a period of consolidation, with the pair failing to decisively break key resistance at $0.71865 or significant support at $0.71416. As we head into the new trading week, all eyes are on these levels to determine the next significant move. The interplay between global risk sentiment, commodity prices, and central bank policies will be crucial in shaping AUDUSD's trajectory.
- AUDUSD is consolidating around $0.71672, with key resistance at $0.71865 and support at $0.71416.
- The 4-hour chart shows a strong bullish trend (ADX 36.71), but daily indicators are mixed, with RSI at 64.94 suggesting further upside potential while Stochastic is in overbought territory.
- Global risk appetite is a key driver; a surge in equities like the S&P 500 (currently 6572.87) typically supports AUDUSD, while a DXY strength (currently 97.9) can weigh on the pair.
- Traders are watching for a break of the $0.71865 resistance for a bullish continuation towards $0.72138, or a break below $0.71416 to confirm a bearish move towards $0.71240.
Navigating the AUDUSD Landscape: A Week of Sideways Action
The Australian Dollar has been caught in a bit of a tug-of-war against the US Dollar, exhibiting a neutral stance for much of the past week. Trading primarily between the $0.71416 support and the $0.71865 resistance, AUDUSD has shown a lack of conviction from either the bulls or the bears. This consolidation phase is typical after periods of significant volatility, as the market seeks to reassess its position based on incoming economic data and shifting global sentiment. The current price of $0.71672 reflects this indecision, sitting squarely in the middle of its recent trading range. Understanding the forces at play - from the strength of the US Dollar Index (DXY) to the performance of risk assets like the S&P 500 and the price of gold - is paramount for deciphering where AUDUSD might head next.
The technical indicators offer a somewhat conflicting picture, adding to the complexity. On the 4-hour chart, the Average Directional Index (ADX) stands at a robust 36.71, indicating a strong trend is in play, which is generally supportive of directional moves. However, the Relative Strength Index (RSI) on the daily chart hovers at 64.94, suggesting room for further upside before reaching overbought conditions. Yet, the Stochastic Oscillator on the daily time frame is showing %K at 89.56 and %D at 92.19, firmly in overbought territory and flashing a potential bearish divergence signal. This divergence between timeframes and indicators highlights the current market's indecision and the importance of waiting for clearer confirmation before committing to a directional trade.
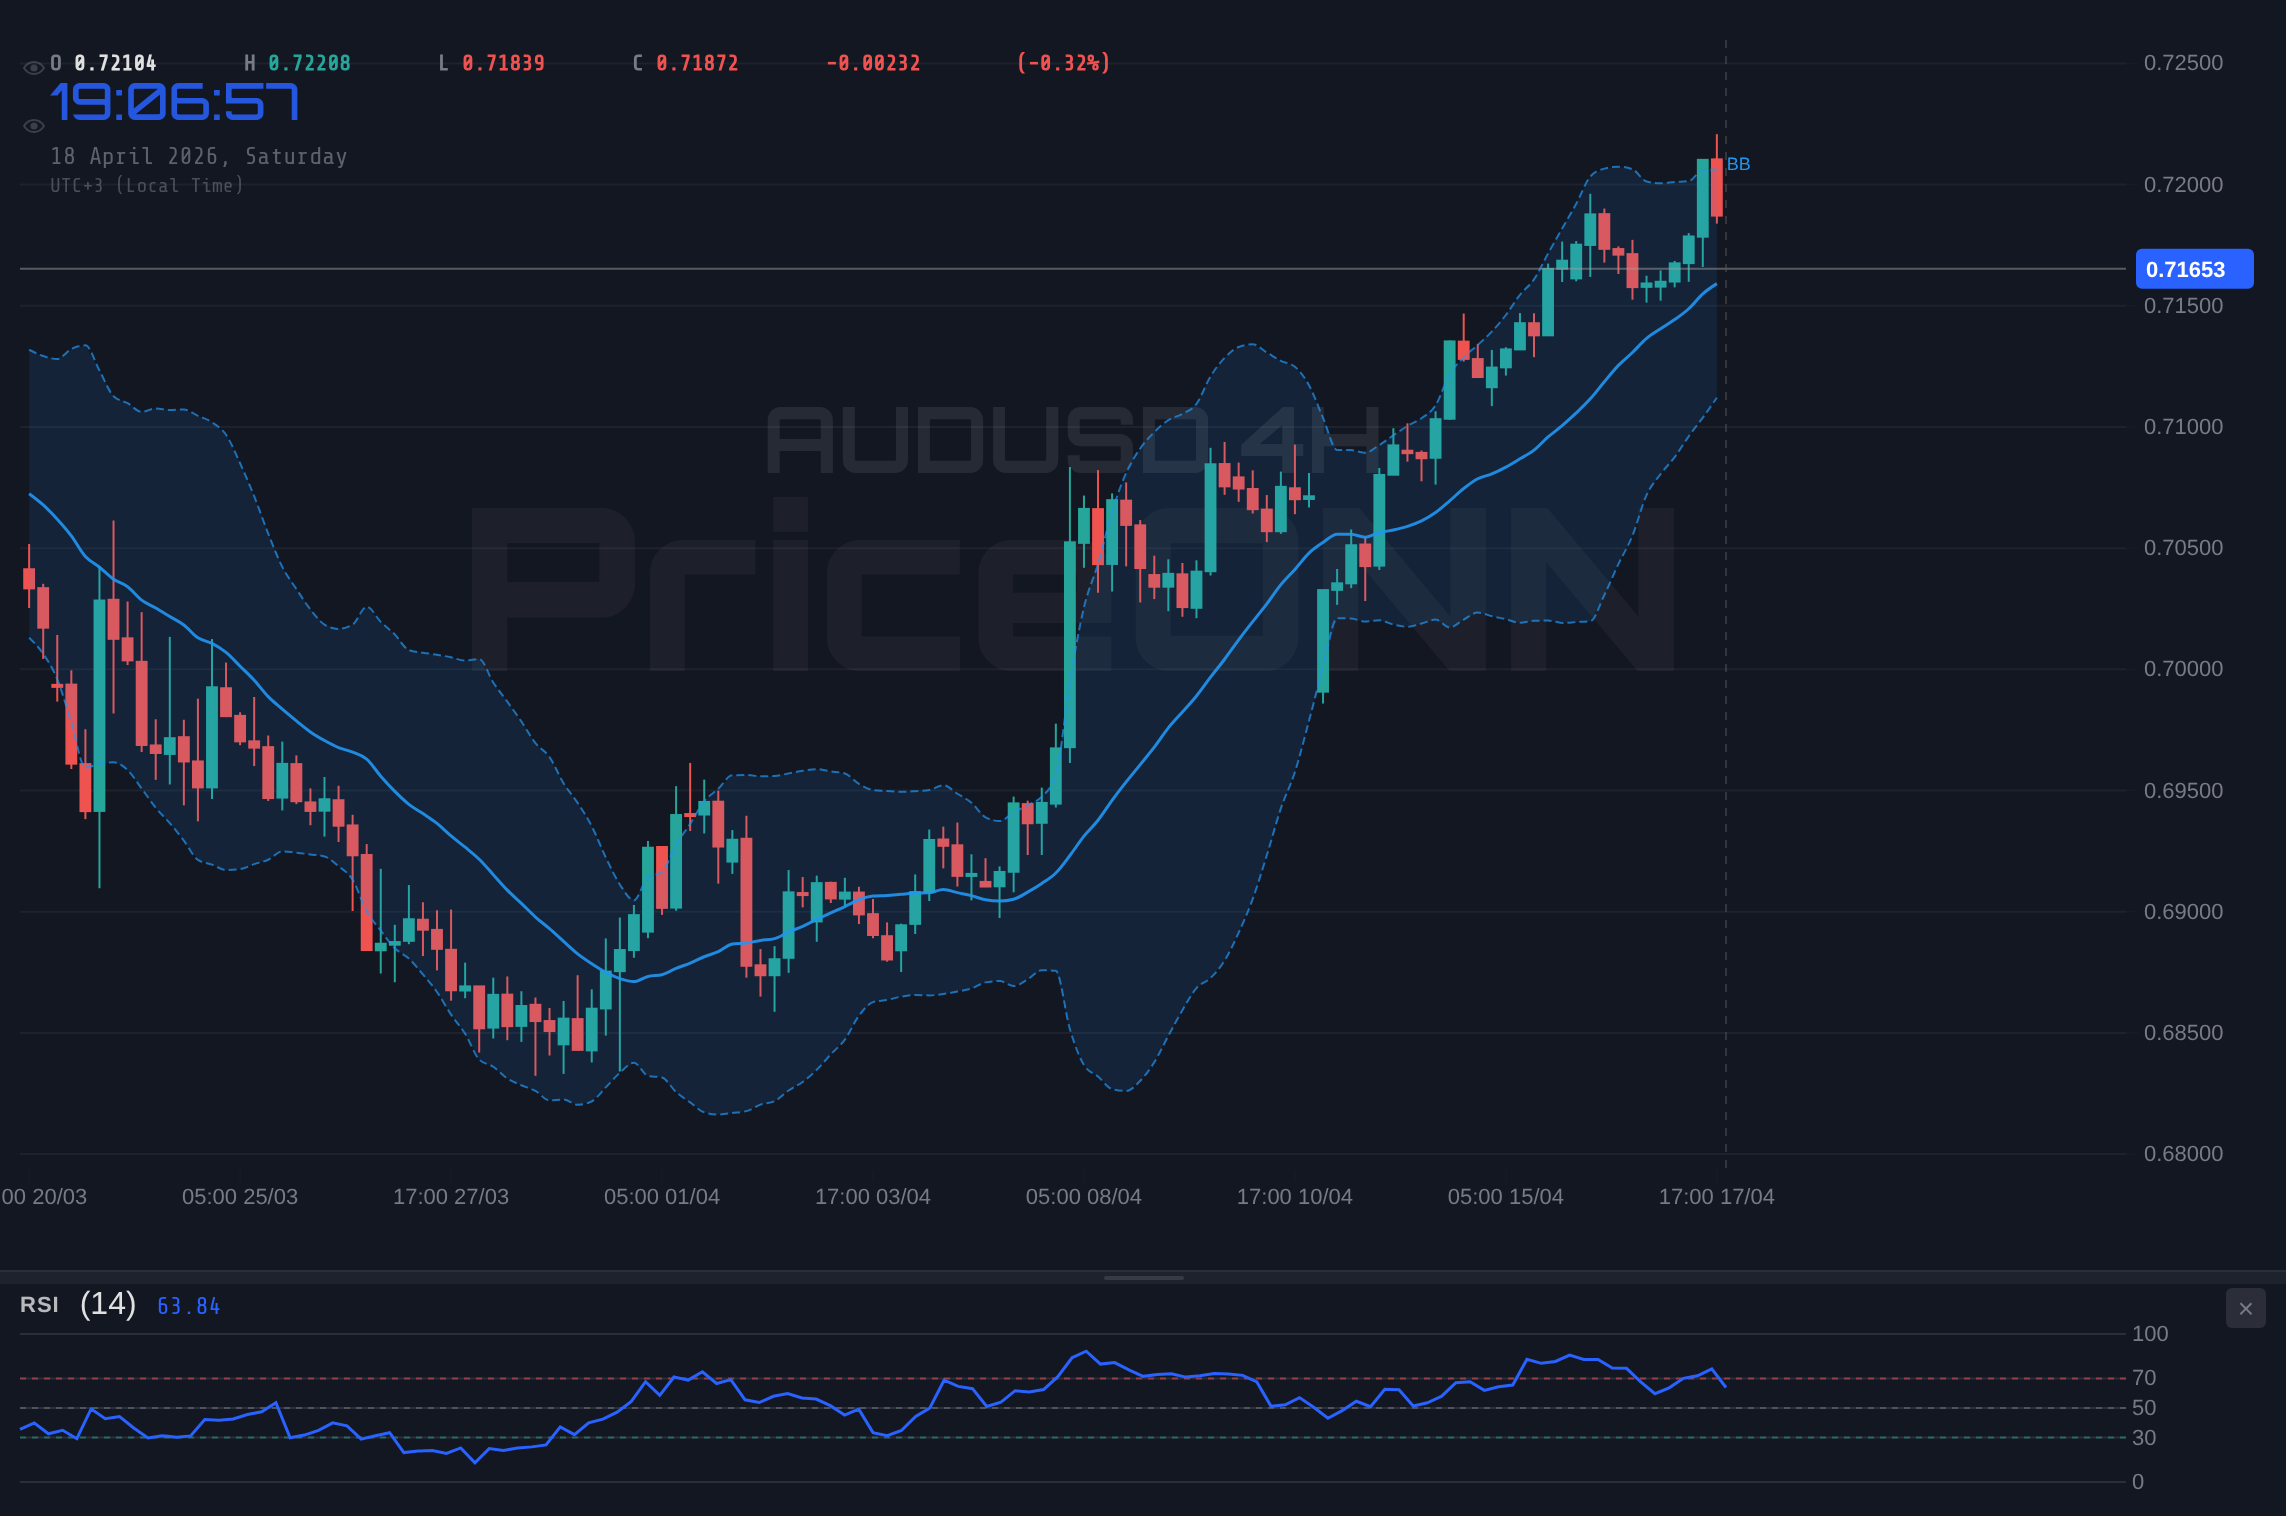
Furthermore, the broader market context cannot be ignored. The US Dollar Index (DXY) currently sits at 97.9, showing a slight bearish bias on the daily chart but with intraday momentum suggesting a potential rebound. Historically, a strengthening DXY often exerts downward pressure on currency pairs like AUDUSD. Conversely, risk sentiment plays a vital role. With the S&P 500 trading at 6572.87 and showing a strong daily upward move of 0.74%, a risk-on environment typically benefits the Australian Dollar, given its higher-yielding and commodity-linked nature. The recent dip in oil prices, with WTI at $86.42, could also be a factor, as Australia is a significant commodity exporter.
The Bull's Roadmap: Pushing Towards Higher Ground
For the bulls to regain control and drive AUDUSD higher, a decisive break above the immediate resistance level is necessary. The first significant hurdle stands at $0.71865. A sustained move and close above this level on the daily chart would invalidate the current consolidation and signal a potential continuation of the upward trend observed on the 4-hour timeframe. The ADX at 36.71 on the 4-hour chart reinforces the idea that if a breakout occurs, it could be strong. Confirmation would also come from continued strength in risk assets, such as the S&P 500 pushing towards new highs, and a softening US Dollar Index (DXY) below its immediate intraday resistance around 97.73.
If AUDUSD successfully clears the $0.71865 resistance, the next logical target would be the $0.72138 level, which has acted as a significant price point in recent weeks. Beyond that, the $0.72314 resistance level presents a more substantial challenge. A sustained rally above $0.72314 would suggest a broader bullish reversal, potentially opening the door for a move towards the $0.72693 mark. Such a scenario would likely be accompanied by a decline in the DXY and a robust risk-on sentiment across global markets, with commodities like gold (currently at $4834.08) also showing strength, indicating a general weakening of the US Dollar and a preference for riskier assets.
The technical indicators would need to align to support this bullish thesis. A daily RSI above 70, while potentially signaling overbought conditions, could indicate strong upward momentum if it continues to climb. Crucially, the Stochastic Oscillator would need to reverse its bearish divergence, with the %K line crossing back above the %D line and moving out of the extreme overbought zone (currently above 80). A confirmation from MACD, which is currently showing positive momentum on the daily chart, would further bolster the bullish case. The absence of any major negative geopolitical events or unexpected hawkish shifts from the Reserve Bank of Australia (RBA) would also be supportive.
The bullish scenario hinges on the pair decisively breaking through the $0.71865 resistance. This breakout needs to be supported by strong volume and sustained price action above this level. If the pair manages to hold this level as new support, it would significantly increase the probability of a move towards the $0.72138 and potentially the $0.72314 targets. The broader market environment must also favor risk appetite, with the DXY failing to regain strength and major equity indices continuing their upward trajectory. Any signs of renewed geopolitical tensions or a sudden shift in central bank rhetoric towards tightening could quickly derail this optimistic outlook.
Where Bears Take Control: A Test of Lower Levels
Conversely, a breakdown below the current support level at $0.71416 would signal a bearish turn for AUDUSD, potentially initiating a more significant downtrend. This scenario would likely be triggered by a combination of factors: a strengthening US Dollar, a decline in global risk appetite, and perhaps negative economic data from Australia. The ADX on the 4-hour chart, while strong, could indicate that a trend reversal is imminent if the price decisively breaks below key support. A daily close below $0.71416 would be the initial signal, suggesting that the consolidation phase is over and sellers are taking charge.
If AUDUSD breaks below $0.71416, the immediate downside target would be the $0.71240 support level. This represents a significant psychological and technical level that has previously capped downside movements. Further selling pressure could then push the pair towards the $0.70967 support. A move below this level would signal a more substantial bearish trend, potentially targeting the $0.70670 area, which is a substantial distance from current levels and would imply a significant shift in market sentiment. Such a move would likely coincide with a sharp rise in the DXY and a significant sell-off in global equity markets.
Technically, this bearish scenario would be confirmed by the daily Stochastic Oscillator remaining in overbought territory and failing to cross back down, or by the RSI moving decisively below 50. A bearish MACD crossover on the daily chart would add further conviction to the downside move. The failure of risk assets to hold their ground, with the S&P 500 falling below its 6533.23 support level, would be a strong concurrent signal. Additionally, any unexpectedly weak Australian economic data, such as poor employment figures or a significant drop in consumer confidence, could serve as the catalyst for such a bearish breakdown.
The invalidation of the bullish scenario would be the primary trigger for this bearish outlook. If AUDUSD fails to break above $0.71865 and instead succumbs to selling pressure, the path lower becomes more probable. A decisive close below $0.71416 would be the critical confirmation, opening up the targets towards $0.71240 and $0.70967. The broader market sentiment would need to turn decidedly risk-averse, potentially driven by geopolitical concerns or hawkish signals from major central banks, leading to a strengthening USD and a sell-off in commodities.
The Waiting Game: Caught in the Middle
The neutral scenario envisions AUDUSD remaining range-bound between its immediate support and resistance levels for an extended period. This outcome is plausible if neither the bulls nor the bears can muster enough conviction to break through the key levels, or if conflicting market signals continue to confuse price action. In this scenario, the pair might oscillate between $0.71416 and $0.71865, perhaps testing these levels multiple times without a decisive breach. This often occurs when there is significant uncertainty surrounding upcoming economic events, such as major central bank meetings or key inflation data releases.
Under a neutral scenario, technical indicators might show conflicting signals or move sideways. The RSI could hover around the 50-60 level, indicating indecision, while the Stochastic Oscillator might fluctuate in and out of overbought/oversold territory without establishing a clear trend. The ADX, which currently shows a strong trend on the 4-hour chart, might begin to weaken if the price action becomes choppy and lacks directional momentum. This suggests that the market is in a holding pattern, waiting for a catalyst to force a breakout.
The neutral range could be characterized by intraday volatility but a lack of significant follow-through. Traders operating in this environment would likely focus on scalping opportunities within the range or wait for a clear breakout. The DXY might also trade sideways, failing to establish a clear trend, and equity markets could experience choppy trading sessions. This 'waiting game' often precedes a more significant move, as the market builds energy for the eventual breakout. The key is to remain patient and avoid forcing trades when the setup is not clear.
The duration of this neutral phase would depend on external factors. A key economic data release that comes in significantly above or below expectations, a surprising geopolitical development, or a shift in central bank communication could all serve to break the stalemate. Until such a catalyst emerges, AUDUSD may remain trapped within its established range, offering limited opportunities for significant directional trades but potentially providing scope for range-bound trading strategies.
The Most Likely Path: Gauging Probabilities
Considering the current technical and market landscape, the most probable scenario for AUDUSD in the immediate short term appears to be a continuation of its cautious trading range, with a slight leaning towards a bullish bias if risk sentiment holds. The strong 4-hour ADX of 36.71 suggests underlying trend strength, and the daily RSI at 64.94 indicates room for upside before hitting overbought territory. However, the daily Stochastic's overbought reading and bearish divergence cannot be ignored, suggesting that any upward move might be met with profit-taking. Therefore, a scenario where AUDUSD tests the upper bounds of its range but struggles to decisively break $0.71865 seems most likely in the coming days.
I assign a 55% probability to a range-bound scenario, with potential for a test and rejection of the $0.71865 resistance. A secondary, albeit lower probability (35%), bullish scenario exists if a strong catalyst emerges, pushing the pair above $0.71865 and targeting $0.72138. The bearish scenario, while possible, currently holds a lower probability (10%) unless key support at $0.71416 breaks decisively, which would then significantly increase its likelihood. This assessment is heavily dependent on the broader market's risk appetite and the direction of the US Dollar Index.
The key to navigating this period is patience and discipline. Waiting for a clear breakout above $0.71865 with confirmation from other indicators and market conditions would be the preferred approach for bullish positions. Conversely, a confirmed break below $0.71416 would signal caution and potentially open shorting opportunities. Until then, trading within the range or staying on the sidelines might be the most prudent strategy, managing risk tightly on any short-term fluctuations.
What I'm Watching This Week
As we look ahead, several factors will be critical in determining AUDUSD's path. Firstly, the $0.71865 resistance level remains the immediate focal point. A sustained break above this level, supported by strong volume and positive market sentiment, would be a strong bullish signal. Secondly, I'll be closely monitoring the US Dollar Index (DXY). If it continues to falter below 97.73 on the intraday charts, it would likely provide tailwinds for AUDUSD. Finally, the upcoming economic data releases, particularly any high-impact US figures like retail sales or inflation data, will be crucial. Positive surprises for the US economy could strengthen the dollar and cap AUDUSD's upside, while weak data could bolster the case for a move higher in AUDUSD, especially if coupled with positive Australian data.
Bearish Scenario: Testing the Lower Bounds
10% ProbabilityNeutral Scenario: Range Consolidation
55% ProbabilityBullish Scenario: Breaking Resistance
35% ProbabilityFrequently Asked Questions: AUDUSD Analysis
What happens if AUDUSD breaks above the $0.71865 resistance level this week?
A sustained break above $0.71865 would invalidate the current neutral stance and likely trigger a move towards $0.72138. This scenario is favored if risk appetite remains strong and the DXY weakens further.
Should I buy AUDUSD at current levels around $0.71672 given the mixed signals?
Buying at current levels is not recommended due to conflicting signals and the proximity of key resistance at $0.71865. A better approach would be to wait for a confirmed breakout above resistance or a clear break below support at $0.71416.
Is the daily Stochastic Oscillator at 89.56/92.19 a sell signal for AUDUSD?
The Stochastic Oscillator in the extreme overbought zone (above 80) suggests that the recent upward momentum may be losing steam and could signal a potential pullback. However, strong uptrends can sometimes sustain overbought conditions, so confirmation from price action and other indicators is crucial.
How will upcoming US Retail Sales data affect AUDUSD this week?
Stronger-than-expected US Retail Sales could boost the US Dollar, potentially capping AUDUSD's upside or even triggering a move lower towards $0.71416. Conversely, weaker data might support a bullish move for AUDUSD, especially if Australian data remains positive.
| Indicator | Value | Signal | Interpretation |
|---|---|---|---|
| RSI (14) | 64.94 | Neutral | Suggests room for upside before overbought territory. |
| MACD Histogram | +0.0001 | Bullish | Positive momentum building. |
| Stochastic | K:89.56, D:92.19 | Bearish | In extreme overbought territory, suggesting potential pullback. |
| ADX (4H) | 36.71 | Strong Trend | Indicates a strong trend is in play on the 4-hour chart. |
| Bollinger Bands | Middle Band | Bullish Inclination | Price is trading above the middle band, suggesting upward pressure. |
While AUDUSD consolidates, the underlying market forces are constantly shifting. The interplay between global risk sentiment, commodity prices, and US Dollar strength will be the key determinants of its next move. Traders must remain vigilant, adhering to risk management principles and waiting for clear technical signals before committing capital. The market always provides opportunities, but patience is often the greatest virtue.
Track markets in real-time
AI-powered analysis, technical indicators and real-time price data.
Join Our Telegram Channel
Breaking market news, AI analysis and trading signals instantly.
Join Channel