

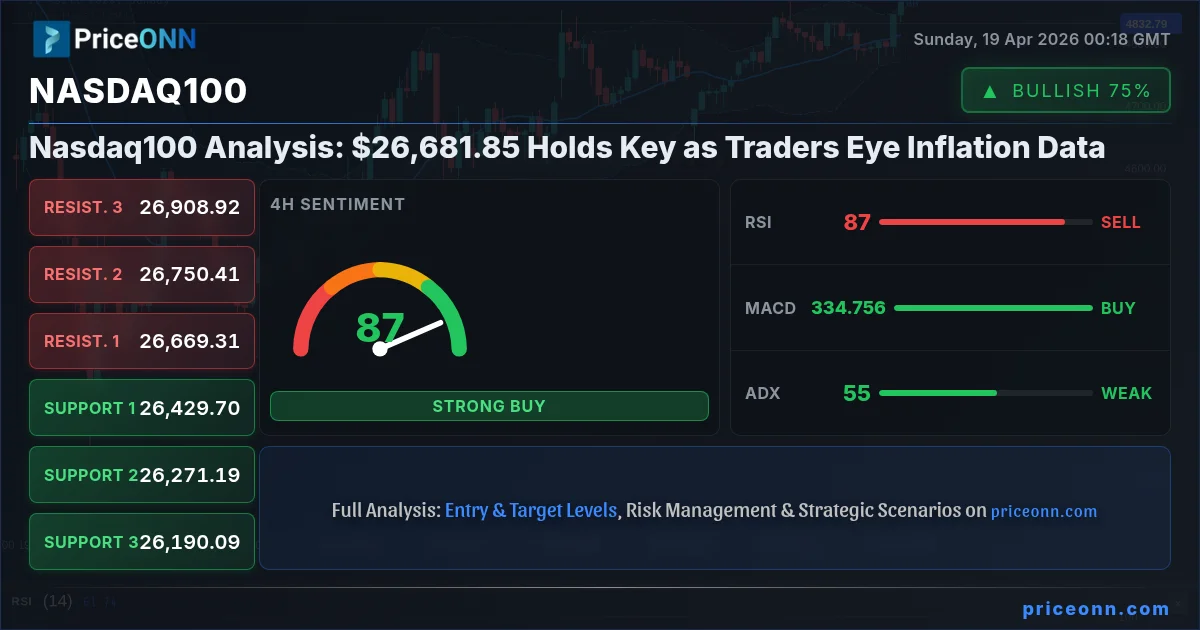
Last Friday, the Nasdaq100 finished the trading week at $26,681.85, a level that encapsulates a complex mix of bullish momentum and underlying caution. The tech-heavy index has been navigating choppy waters, influenced by a confluence of factors ranging from corporate earnings reports to shifting macroeconomic expectations. While the broader market sentiment has shown resilience, the path forward for the Nasdaq100 hinges on critical data releases and the adherence to key technical levels. This analysis delves into the current technical landscape, explores the fundamental drivers, and outlines potential scenarios for traders, scalpers, and long-term investors alike.
- The Nasdaq100 closed at $26,681.85, with a 1.44% gain for the week, but RSI at 72.53 signals overbought pressure on the 1H chart.
- Critical support sits at $26,527.88, tested multiple times, while resistance looms at $26,722.07.
- MACD histogram shows diminishing bullish momentum on the 1H chart, suggesting a potential slowdown despite the strong ADX reading of 34.15.
- Fed rate expectations and upcoming US inflation data are driving the Nasdaq100's correlation with the DXY, currently at 97.9.
Navigating the Nasdaq100: A Week of Contrasting Signals
The Nasdaq100's journey last week was a testament to the market's inherent volatility and the ever-present tug-of-war between bulls and bears. Closing at $26,681.85, the index managed to eke out a respectable 1.44% gain, painting a superficially optimistic picture. However, a deeper dive into the technical indicators reveals a more nuanced reality. On the 1-hour timeframe, the Relative Strength Index (RSI) hovers at 72.53, firmly entrenched in overbought territory. This reading, while not an immediate sell signal, suggests that the recent upward momentum might be losing steam and that a period of consolidation or even a minor pullback could be on the horizon. The ADX, a measure of trend strength, stands at a robust 34.15 on this timeframe, indicating that the current trend, whatever its direction, has conviction. Yet, the MACD histogram, currently positive, shows signs of waning bullish momentum, printing lower highs as the price pushed higher. This divergence between strong trend strength and weakening momentum is a classic sign of caution, suggesting that the rally might be becoming more fragile.
The 4-hour chart paints a slightly different, yet equally complex, picture. Here, the RSI sits at 62.83, still in bullish territory but not yet signaling extreme overbought conditions. This suggests that the longer-term trend might still have legs. The MACD on this timeframe is positive and above its signal line, reinforcing the bullish sentiment from a slightly longer perspective. However, the Stochastic oscillator, with %K at 97.85 and %D at 86.96, is flashing a severe overbought warning. This extreme reading indicates that the market is potentially due for a correction, regardless of the underlying trend strength. The ADX on the 4-hour chart is lower, at 24.23, suggesting a moderate trend, which aligns with the idea that the market might be entering a consolidation phase rather than a strong directional move. The daily chart, however, offers a concerning perspective. With an RSI of 45.35, the index is neither overbought nor oversold, but the MACD is negative and below its signal line, and the ADX is at 47.51, indicating a strong downtrend. This stark contrast between the shorter timeframes and the daily picture highlights the indecision currently plaguing the market. Traders must reconcile these conflicting signals, understanding that the short-term gains might be overshadowed by a potential longer-term downtrend if key support levels fail.
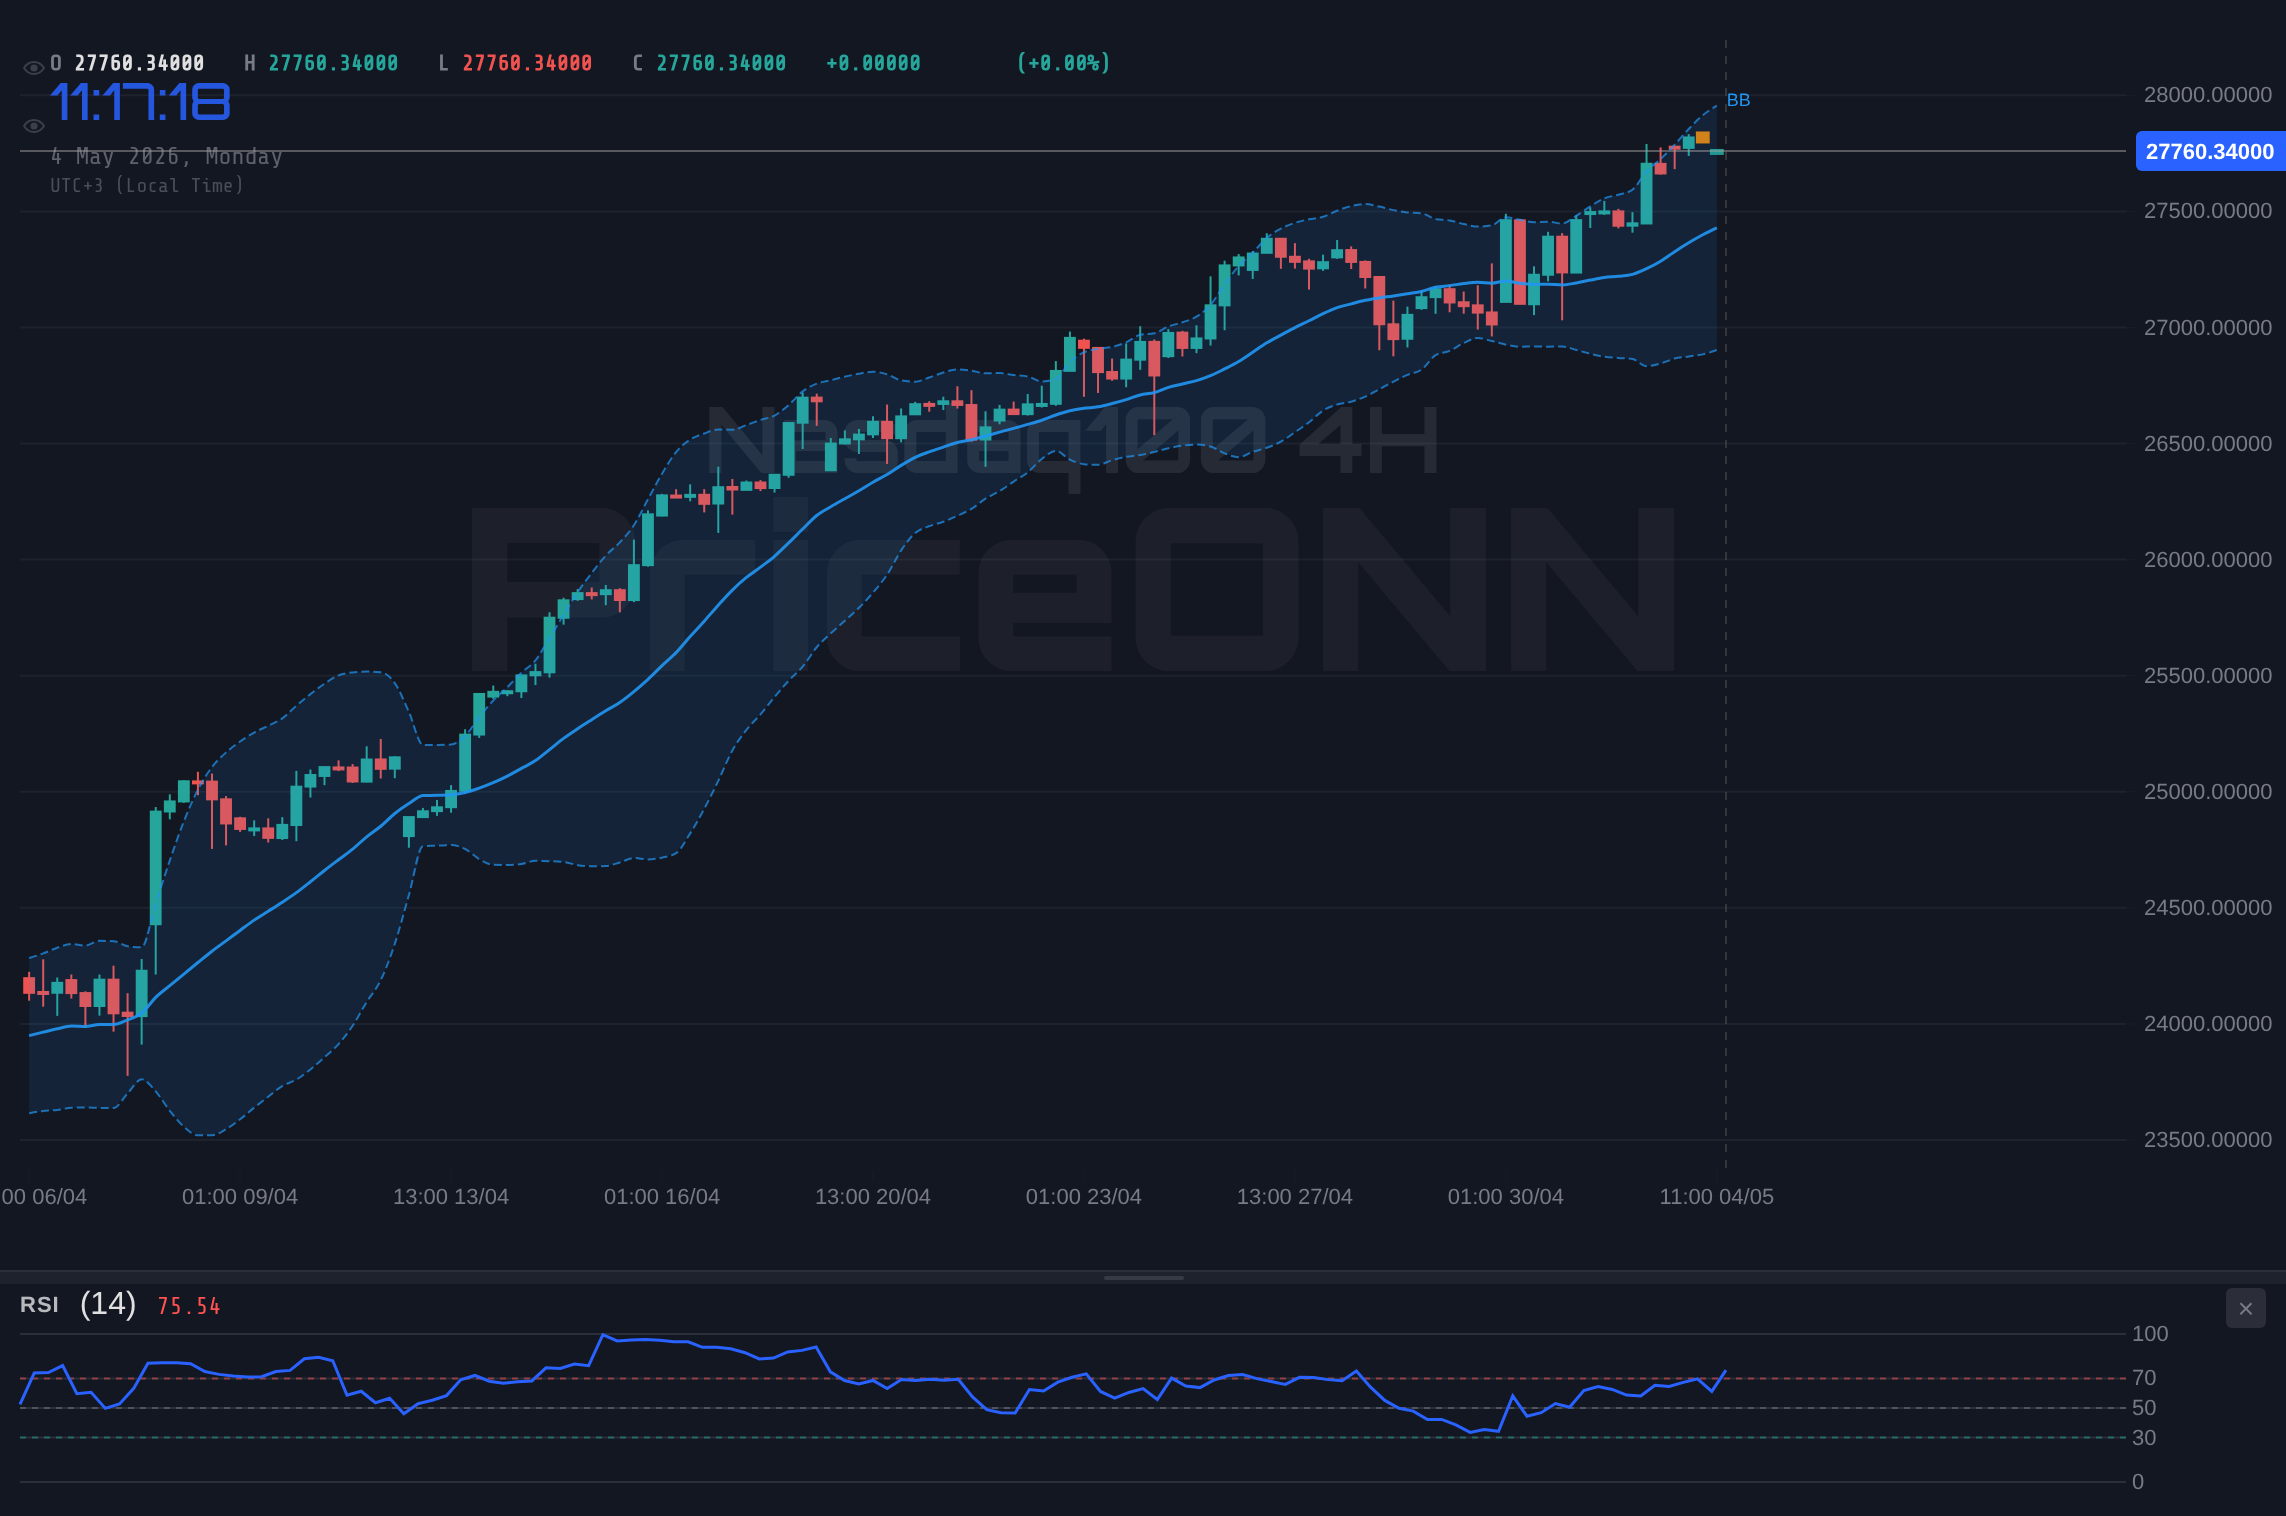
The correlation with macroeconomic factors cannot be overstated. The Dollar Index (DXY), currently trading at 97.9, plays a crucial role. Last week saw a slight dip in the DXY, which typically provides a tailwind for risk assets like the Nasdaq100. However, the relationship is not always linear. Persistent inflation concerns, signaled by the recent elevated US Retail Sales data (Actual: 207, Previous: 218), continue to keep the Federal Reserve's policy path uncertain. While the market has priced in some degree of caution from the Fed, any hawkish undertones from upcoming statements or data could quickly reverse the risk appetite. The correlation analysis reveals that a strengthening dollar often puts pressure on tech stocks, as it increases the cost of goods for international buyers and can signal tighter monetary policy. Conversely, a weakening dollar can boost foreign investment into U.S. equities, supporting indices like the Nasdaq100. The current DXY level of 97.9, while not extremely high, acts as a constant overhang, demanding close attention from traders monitoring the interplay between currency strength and equity performance. The market's reaction to upcoming inflation reports will be paramount in determining whether the Nasdaq100 can sustain its upward trajectory or if the overbought conditions on shorter timeframes will lead to a more significant correction.
Key Levels and What They Mean for Different Traders
For scalpers and short-term traders, the immediate price action around the $26,681.85 closing level is paramount. The 1-hour chart's resistance at $26,722.07 presents an immediate hurdle. A failure to decisively break and hold above this level, especially if accompanied by waning momentum on the MACD histogram, could signal an opportunity for a short-term short position, targeting the support at $26,527.88. The Stochastic oscillator's extreme overbought reading on this timeframe further supports the idea of potential short-term reversals. However, scalpers must remain agile, as a swift breakout above $26,722.07, perhaps fueled by positive economic news, could quickly invalidate this bearish short-term thesis and open the door to higher targets. The key is tight risk management and quick exits based on price action around these immediate levels.
Swing traders, operating on 4-hour and daily timeframes, have a broader perspective. The crucial support level on the 4-hour chart is $26,527.88, followed by $26,190.09. A break below $26,527.88 would be a significant bearish signal, potentially triggering a move towards the lower support levels. The ADX at 24.23 on this timeframe suggests a moderate trend, meaning that a break of support might not immediately result in a freefall but could lead to a period of consolidation before further downside. On the resistance side, the $26,722.07 level is the immediate target. A sustained hold above this could signal a continuation of the bullish trend, with the next significant resistance likely around $26,908.92. Swing traders should pay close attention to the daily chart's overall trend. The negative MACD and strong ADX (47.51) on the daily chart suggest that the underlying trend might be bearish, making any upside moves potentially corrective rather than indicative of a new bull run. Therefore, while looking for bullish setups on shorter timeframes, swing traders must remain aware of the bearish bias on the daily chart and be prepared to adjust their positions if the daily trend reasserts itself.
For long-term investors, the focus shifts from intraday fluctuations to broader macroeconomic trends and the underlying health of the tech sector. The Nasdaq100's closing price of $26,681.85 is less important than the fundamental factors driving its long-term value. Key considerations include the trajectory of interest rates, inflation expectations, and the earnings growth of major Nasdaq constituents. While technical indicators can provide valuable insights into market sentiment and potential turning points, they are secondary to the fundamental picture for long-term investment decisions. The recent surge in oil prices, for instance, acts as a double-edged sword: it can signal economic strength but also fuels inflation fears, potentially leading to higher interest rates that disproportionately affect growth stocks prevalent in the Nasdaq100. The geopolitical landscape, particularly tensions in the Strait of Hormuz, adds another layer of uncertainty, impacting energy prices and, by extension, corporate costs and consumer spending. Long-term investors should monitor central bank policy statements, inflation reports, and GDP figures, using technical levels primarily as zones for potential accumulation or as indicators of significant trend shifts rather than short-term trading signals.
Correlation Analysis: Beyond the Nasdaq100 Chart
To truly understand the Nasdaq100's potential trajectory, we must examine its relationship with other key markets. The Dollar Index (DXY), currently at 97.9, serves as a crucial barometer for global risk sentiment and monetary policy expectations. Historically, a rising DXY tends to coincide with a weakening Nasdaq100, as a stronger dollar can make US tech exports more expensive and signal tighter financial conditions that stifle growth stocks. Conversely, a falling DXY often provides a supportive backdrop for the index. Last week's slight dip in the DXY offered some relief, but the underlying strength suggested by its 1H chart's ADX of 22.12 indicates that the dollar remains a potent force. Traders must watch for decisive breaks in the DXY; a move below its 1H support at 97.62 could further embolden Nasdaq bulls, while a push back towards 97.98 would likely dampen enthusiasm.
Equities markets, particularly the S&P 500 and Nasdaq, exhibit a high degree of correlation. The S&P 500's recent gain of 0.74% to 6572.87, coupled with the Nasdaq 100's own advance, suggests a broad-based risk-on sentiment in the equity space. However, the S&P 500's daily chart shows a strong downtrend (ADX 47.51) despite its recent recovery, and its 1H RSI at 70.95 is also entering overbought territory. This suggests that the equity rally might be fragile and susceptible to a reversal if broader economic concerns resurface. The Nasdaq100's performance is intrinsically linked to the tech sector's health, which often leads the broader market in both upswings and downswings. If the S&P 500 falters, it's highly probable that the Nasdaq100 will follow suit, potentially exacerbating any downside move.
Oil prices, represented by Brent crude at $92.57, remain a significant factor due to their inflationary implications. The sharp 6.9% decline in Brent last week from its highs reflects easing geopolitical tensions or perhaps a reassessment of demand versus supply. However, oil prices remain elevated compared to historical averages, and any resurgence in geopolitical risks, such as renewed tensions around the Strait of Hormuz, could quickly send prices spiraling upwards again. Higher oil prices translate to higher transportation and production costs across the economy, potentially squeezing corporate profit margins and dampening consumer spending – both negative factors for the Nasdaq100. The current Brent price, while lower than its peak, still represents a level where inflation concerns linger. Traders should monitor oil price movements closely; a sustained rally in oil could act as a significant headwind for the tech index, even if other indicators appear bullish in the short term.
Bond yields also play a critical role. While specific yield data isn't provided, the general principle holds: rising bond yields typically increase the cost of capital for companies and make fixed-income investments more attractive relative to equities. This can lead to a rotation out of growth stocks, which form the backbone of the Nasdaq100. Conversely, falling yields can signal economic slowdown fears or a flight to safety, but they can also make borrowing cheaper, potentially supporting equity valuations. The market's interpretation of inflation data will heavily influence bond yields. If inflation proves stickier than expected, yields are likely to rise, putting pressure on the Nasdaq100. If inflation moderates, yields may fall, offering some support.
Economic Calendar Watchlist and Potential Market Impact
The economic calendar for the coming week is packed with high-impact events that could significantly sway market sentiment and impact the Nasdaq100. The release of UK inflation data (GBP, Actual: 0.5%, Forecast: 0.1%) showed a notable overshoot, indicating persistent price pressures in the UK economy. This could lead the Bank of England to maintain a hawkish stance, influencing global currency markets and risk appetite. Similarly, the Eurozone inflation figures (EUR, Actual: 2.6%, Forecast: 2.5%) also came in slightly above expectations, suggesting that inflationary pressures are not entirely abating across major economies. These readings reinforce the narrative that central banks might need to keep interest rates higher for longer, a scenario that generally weighs on growth-oriented assets like the Nasdaq100.
The United States calendar is equally critical. The latest US Retail Sales data (Actual: 207, Previous: 218) showed a decline, which might be interpreted in two ways: it could signal weakening consumer demand, potentially leading to slower economic growth and a less aggressive Fed, or it could be a temporary blip in an otherwise resilient consumer spending landscape. The market's reaction will depend on the broader context and forward-looking statements accompanying the data. Crucially, upcoming employment figures, including the Non-Farm Payrolls (NFP), will be closely scrutinized. While the exact forecast numbers for the upcoming releases are not provided in the current data, the *previous* NFP reading of 0.6% suggests a potentially robust labor market. If the actual figures come in significantly higher, it could reignite inflation concerns and push back expectations of Fed rate cuts, negatively impacting the Nasdaq100. Conversely, weaker-than-expected job growth might be seen as a positive signal for equities if it implies a less hawkish Fed.
The interplay between these economic releases and central bank policy expectations is complex. The market is constantly trying to price in the likelihood of future interest rate adjustments. Fed Fund Futures and Overnight Index Swaps (OIS) data, if available, would provide a clearer picture of market expectations. However, even without precise figures, the general trend of inflation data and employment reports will guide these expectations. If inflation remains stubbornly high and the labor market stays strong, the Federal Reserve may be forced to delay any rate cuts, potentially leading to increased volatility in the Nasdaq100. Conversely, signs of cooling inflation and a softening labor market could pave the way for earlier rate cuts, providing a significant tailwind for the tech index. Investors and traders must remain attuned to these macroeconomic shifts, as they often override short-term technical signals and dictate the broader market direction.
Geopolitical Undercurrents and Their Impact
Beyond the economic data, geopolitical developments continue to cast a long shadow over financial markets, including the Nasdaq100. The situation surrounding the Strait of Hormuz, a critical chokepoint for global oil supply, remains a significant source of potential volatility. Reports of its temporary reopening provided some relief to oil prices last week, contributing to the decline in Brent crude. However, the underlying tensions persist, and any flare-up could rapidly send oil prices higher, reigniting inflation fears and potentially triggering a flight to safer assets. This would likely put downward pressure on the Nasdaq100, which is sensitive to both inflation and risk appetite.
The broader geopolitical climate, including ongoing conflicts and trade relations between major economic powers, adds another layer of uncertainty. While specific trade war escalations or major diplomatic breakthroughs haven't been highlighted in the provided news snippets for the Nasdaq100's immediate context, these factors are always simmering beneath the surface. Shifts in US-China relations, for example, can impact global supply chains and corporate earnings, particularly for tech companies with significant international operations. Investors must remain aware of these macro-level risks, as they can trigger sudden market downturns irrespective of purely technical signals. The current environment suggests a cautious approach, where geopolitical stability is a prerequisite for sustained risk-on sentiment, which in turn benefits growth-oriented indices like the Nasdaq100.
Scenario Analysis: Mapping Potential Nasdaq100 Moves
Bearish Scenario: Consolidation and Downside Risk
65% ProbabilityNeutral Scenario: Range-Bound Trading
25% ProbabilityBullish Scenario: Sustained Rally
10% ProbabilityThe technical indicators present a mixed outlook, but the prevailing signals lean towards caution. The daily chart's bearish trend (ADX 47.51) and negative MACD, coupled with the 1-hour RSI's overbought condition at 72.53, suggest that the path of least resistance might be downwards, at least in the short to medium term. The bearish scenario, with a 65% probability, hinges on the Nasdaq100 failing to hold its intraday support levels and succumbing to selling pressure, potentially driven by disappointing economic data or hawkish central bank rhetoric. A break below the crucial 4-hour support at $26,190.09 would be the primary trigger, invalidating any near-term bullish aspirations and opening the door for targets at $25,859.42 and potentially $25,614.53. This scenario is further supported by the Stochastic oscillator's extreme overbought readings on shorter timeframes, indicating a potential for a sharp reversal.
Conversely, the bullish scenario, assigned a lower 10% probability, requires a decisive breakout above key resistance levels. For this to materialize, the Nasdaq100 would need to convincingly clear the daily resistance at $26,714.90, ideally with increasing volume and a confirmation from other indicators. The trigger for this scenario would be a sustained hold above this level, invalidating the bearish thesis. If successful, targets could extend towards $26,908.92 and potentially a psychological level around $27,100. However, given the current daily chart setup and the overbought conditions on intraday charts, this remains a less probable outcome without significant fundamental catalysts. The neutral scenario, representing a 25% probability, anticipates a period of consolidation. This would involve the index trading within a defined range, likely between the 1-hour resistance of $26,722.07 and support at $26,527.88. Such a phase could occur as the market awaits clearer direction from upcoming economic data or central bank communications. Trading within this range would require careful management, with potential for range-bound strategies, but the risk of a breakout in either direction would remain.
Historical Context and Trader Archetypes
Looking back, periods of high ADX readings on daily charts for the Nasdaq100, such as the current 47.51, have often preceded significant market turns. For instance, following the market downturn in early 2024, a similar strong downtrend signal on the daily ADX preceded a sharp decline. However, the subsequent recovery saw periods where intraday charts showed overbought conditions (RSI > 70), similar to what we observe now, followed by brief pullbacks before the larger trend resumed. The key difference now is the persistence of inflation data and the uncertainty surrounding Fed policy, which adds a layer of complexity not present in all past high-ADX scenarios. Understanding these historical patterns is crucial; while past performance is not indicative of future results, it provides valuable context for interpreting current market behavior.
For scalpers, the current environment offers opportunities in the short-term overbought signals on the 1H chart. A failure to break $26,722.07 could present a quick shorting opportunity targeting $26,527.88. However, the strong ADX on the daily chart means these scalps must be managed with extremely tight stops, as a sudden trend continuation could quickly turn a profitable trade into a loser. The Stochastic oscillator's extreme readings on the 1H chart reinforce the idea that pullbacks are possible, but the overall trend is still a dominant factor.
Swing traders should focus on the 4-hour and daily charts. The critical support at $26,190.09 on the daily chart is a key level to watch. A break below this level would invalidate bullish short-term setups and signal a potential shift towards the bearish scenario. Conversely, holding above $26,527.88 and breaking $26,714.90 could initiate a bullish swing trade. The divergence between the positive MACD on the 4H chart and the negative MACD on the daily chart presents a classic swing trading dilemma: do you bet on the short-term strength or the longer-term weakness? Confirmation from volume and sustained price action above key levels would be crucial for initiating bullish swings.
Long-term investors, meanwhile, should view the current price of $26,681.85 as part of a larger trend. The persistent inflation concerns and the Fed's data-dependent approach mean that the macroeconomic backdrop remains the primary driver. While the Nasdaq100 has shown resilience, the potential for higher-for-longer interest rates poses a significant risk to growth stocks. Investors should focus on the fundamental health of companies within the index, their ability to pass on costs, and their long-term growth prospects in a potentially higher-rate environment. Technical levels like $26,190.09 and $25,859.42 serve as important zones to watch for potential accumulation opportunities if the market corrects significantly, but the investment thesis should be driven by fundamental analysis rather than short-term price action.
The Road Ahead: Key Events and Outlook
The upcoming week promises to be pivotal for the Nasdaq100. The focus will undoubtedly remain on inflation data and any signals from the Federal Reserve regarding its monetary policy stance. Any indication that inflation is proving more persistent than anticipated could lead to a reassessment of rate cut timelines, putting downward pressure on the index. Conversely, signs of cooling inflation could bolster risk sentiment and support further gains. The correlation with the DXY will be closely watched; a sustained weakening of the dollar could provide a tailwind, while a strengthening dollar might limit upside potential.
Technically, the $26,681.85 closing price places the Nasdaq100 precariously between immediate resistance and crucial support levels. The 1-hour chart's overbought RSI and diverging MACD suggest that immediate upside might be capped, favoring a period of consolidation or a pullback. However, the strong ADX on the daily chart (47.51) indicates that if a trend does emerge, it could be powerful. Traders will be looking for clear breaks of the key levels identified: $26,722.07 to the upside, and $26,190.09 to the downside. The outcome of these level battles will largely dictate the Nasdaq100's direction in the coming days.
Frequently Asked Questions: Nasdaq100 Analysis
What happens if the Nasdaq100 breaks below the key support level of $26,190.09?
If the Nasdaq100 closes below $26,190.09 on the 4-hour chart, it invalidates the current bullish short-term outlook. This would likely trigger a move towards the next significant support at $25,859.42, suggesting a potential continuation of the bearish trend indicated by the daily ADX of 47.51.
Should I buy the Nasdaq100 at current levels around $26,681.85 given the RSI at 72.53 on the 1H chart?
Buying at current levels around $26,681.85 is risky due to the 1H RSI at 72.53 signaling overbought conditions. A more prudent approach would be to wait for a pullback towards support levels like $26,527.88 or confirmation of a sustained breakout above $26,722.07, though the latter has a lower probability based on current daily trends.
Is the RSI at 72.53 on the 1H chart a sell signal for the Nasdaq100 right now?
An RSI of 72.53 on the 1-hour chart is considered overbought, but it's not an automatic sell signal. It indicates that the recent upward momentum may be unsustainable and suggests a potential for consolidation or a minor pullback. Confirmation from other indicators like MACD divergence or a break of intraday support would be needed for a strong sell signal.
How will upcoming US inflation data affect the Nasdaq100 this week, given the DXY is at 97.9?
Higher-than-expected inflation data could lead to fears of prolonged higher interest rates, strengthening the DXY at 97.9 and pressuring the Nasdaq100. Conversely, cooling inflation might weaken the dollar and boost risk appetite, supporting the Nasdaq100, especially if it signals potential Fed rate cuts.
Technical Outlook Summary
| Indicator | Value | Signal | Interpretation |
|---|---|---|---|
| RSI (14) | 72.53 | Overbought | 1H chart shows extreme buying pressure, potential for pullback. |
| MACD Histogram | +0.73 | Divergence | 1H chart shows weakening bullish momentum despite price rise. |
| Stochastic | K:97.85, D:86.96 | Extreme Overbought | 4H chart flashing severe overbought warning, suggesting correction likely. |
| ADX | 47.51 | Strong Downtrend | Daily chart indicates a powerful downtrend, despite recent intraday gains. |
| Bollinger | Upper Band | Breakout | 1D chart price is above the upper band, indicating strong upward momentum but potential overextension. |
Track markets in real-time
AI-powered analysis, technical indicators and real-time price data.
Join Our Telegram Channel
Breaking market news, AI analysis and trading signals instantly.
Join Channel