

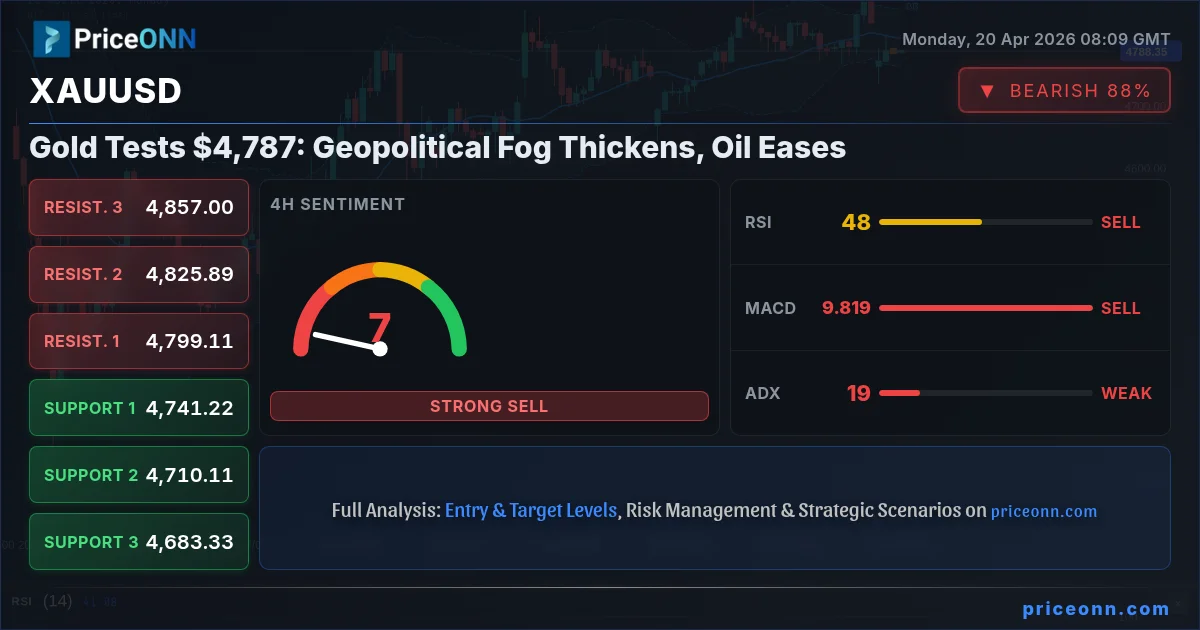
The precious metal, gold (XAUUSD), is currently navigating a critical juncture, trading around the $4,787 mark. This price point represents more than just a number; it's a battleground where competing market forces are vying for control. With geopolitical tensions in the Middle East simmering once again and oil prices showing a mixed picture, the narrative surrounding gold is becoming increasingly complex. The market is caught between the fading hopes of a ceasefire and the persistent underlying demand for safe-haven assets, creating a delicate balance that traders are closely watching.
- With RSI at 43.91 on the 1H chart, gold shows neutral momentum with a slight downward bias, indicating a lack of strong conviction.
- The critical support level for XAUUSD sits at $4,775.85, a breach of which could trigger further downside.
- MACD histogram negative momentum suggests selling pressure, but the Stochastic oscillator on the 1H chart is showing a bullish signal (%K > %D), creating conflicting signals.
- The Dollar Index (DXY) at 98.01 is showing a mixed picture, with a daily trend pointing down but a 4H trend neutral, creating an uncertain environment for gold.
The narrative at play this week is a tug-of-war between the bulls and the bears, with gold prices hovering precariously. On one hand, the fading optimism surrounding potential ceasefires in the Middle East has injected a dose of caution back into the markets. This geopolitical uncertainty typically fuels demand for gold as a safe-haven asset. However, this is being counterbalanced by other market dynamics, including shifts in risk appetite reflected in the S&P 500 and Nasdaq, and the fluctuating strength of the US dollar. The current price action around $4,787.50 suggests indecision, with neither side able to establish firm control. Analyzing the multi-timeframe technical indicators reveals a conflicting picture, underscoring the current market chop and the need for clear directional signals before committing to a significant trade.
The immediate technical landscape for XAUUSD presents a picture of neutrality, particularly on the 1-hour timeframe. The ADX at 24.88 indicates a moderately trending market, but the overall signal leans towards 'SELL' with 6 out of 8 indicators suggesting caution. This isn't a picture of capitulation, but rather a market that's lost its immediate upward momentum. The RSI(14) at 43.91 is firmly in neutral territory, showing no signs of being overbought or oversold, but its slight downward inclination hints at prevailing bearish sentiment in the short term. The MACD is also below its signal line, reinforcing this cautious outlook. However, the Stochastic oscillator offers a glimmer of hope for the bulls, with the %K line crossing above the %D line, suggesting a potential short-term bounce. This divergence between the momentum indicators is precisely what creates the 'WATCH_ZONE' condition, implying that a clear breakout or breakdown is needed to establish a high-probability trade setup. The key level to watch here is the resistance at $4,798.93; a decisive move above this could invalidate the immediate bearish lean.
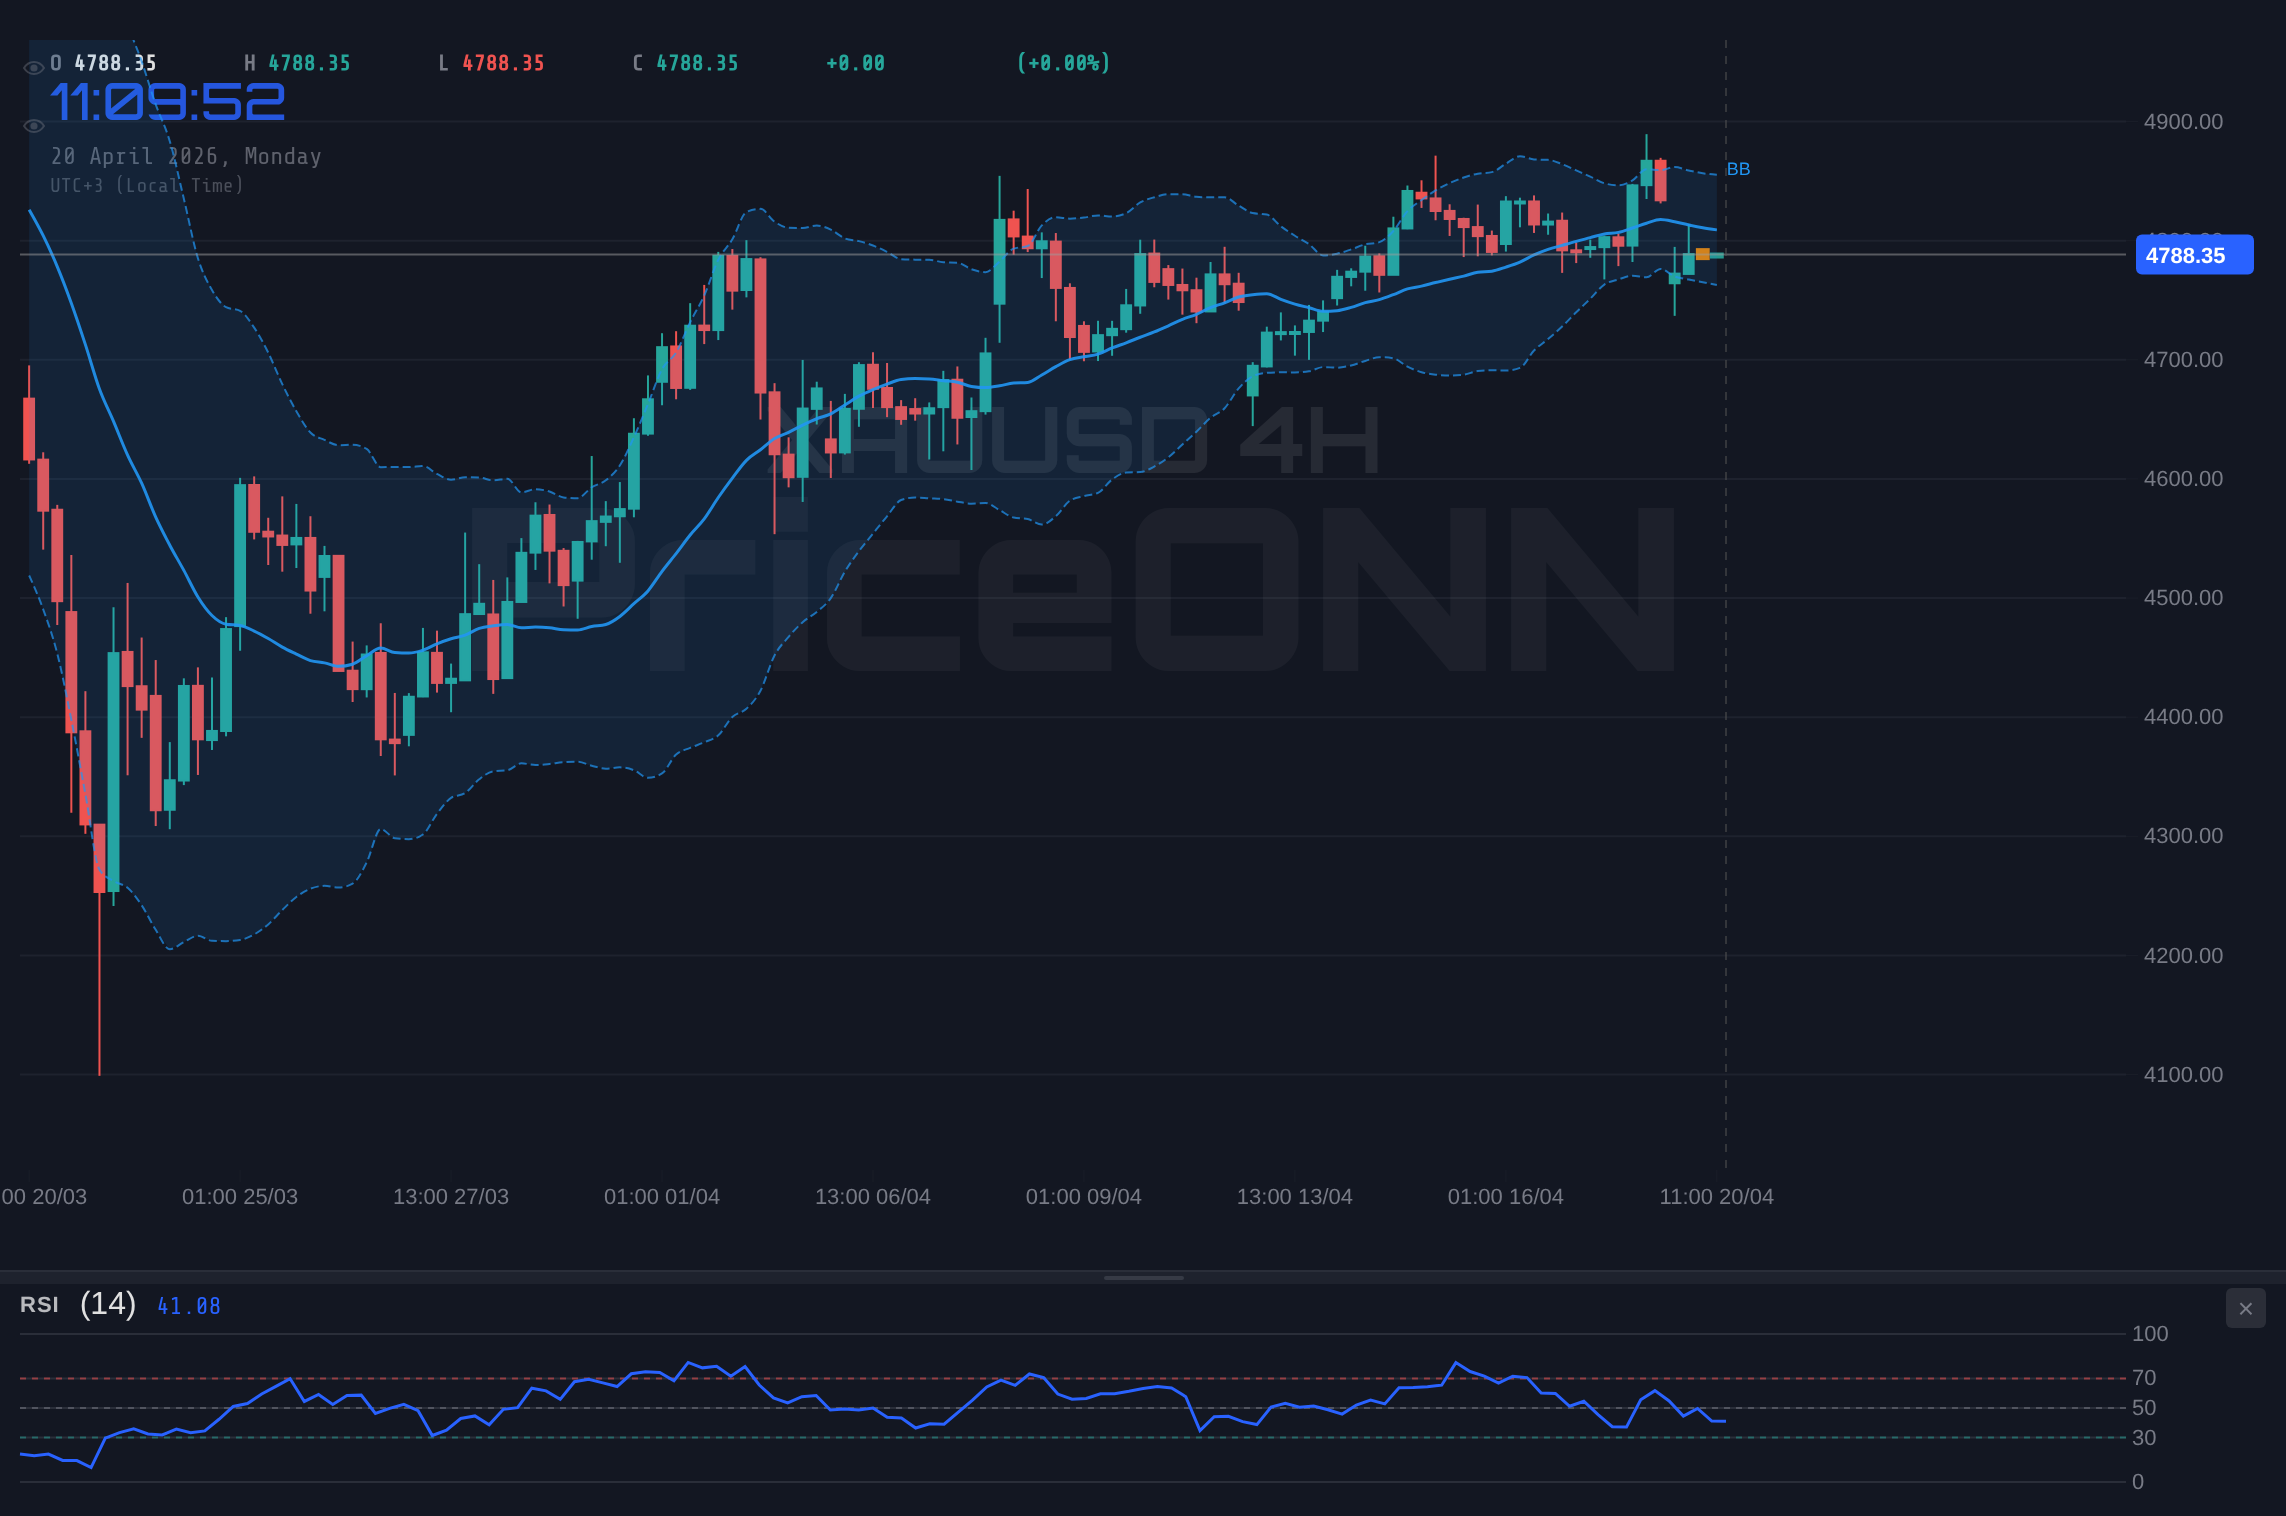
Diving deeper into the 4-hour chart, the trend shows a stronger bullish inclination with a power rating of 90%, yet the overall signal is still 'SELL'. This apparent contradiction highlights the complexity of the current market. While the longer-term trend might be considered upward, the immediate price action is facing headwinds. The RSI(14) at 48.01 is hovering just below the 50 level, and the MACD continues to show negative momentum. The Stochastic indicator here is giving a clear 'SELL' signal (%K
Zooming out to the daily timeframe, the picture becomes more optimistic for gold. The trend is officially classified as 'Downtrend' with a power of 86%, but the overall signal is a strong 'BUY'. This is where the multi-timeframe analysis truly shines, revealing a potential divergence. The RSI(14) at 50.95 is neutral but showing a rising tendency, MACD is in positive territory and above its signal line, and the Bollinger Bands are suggesting an upward bias. The Stochastic, while showing a 'SELL' signal (%K
The Dollar Index (DXY) plays a crucial role in the gold narrative. Currently trading at 98.01, its movement has a direct correlation with gold prices, especially in the current geopolitical climate. The DXY's 1-hour chart shows a 'BUY' signal with positive MACD momentum and a rising RSI, suggesting short-term dollar strength. However, the 4-hour chart presents a neutral trend, and the daily chart indicates a downtrend with a 'SELL' signal. This mixed picture for the dollar adds another layer of complexity. If the dollar were to strengthen significantly, it would likely put downward pressure on gold, pushing it towards its support levels. Conversely, a weaker dollar, as suggested by the daily trend, could provide a tailwind for gold, potentially helping it break through the resistance levels. The current indecision in the DXY mirrors the uncertainty seen in gold, indicating that broader currency market sentiment is also in flux.
Oil prices, specifically Brent crude at $96.93, are a significant factor influencing inflation expectations and, by extension, gold's appeal as an inflation hedge. Brent has seen a substantial daily gain of 4.86%, indicating renewed upward pressure in the energy markets. The 1-hour chart shows a 'BUY' signal with positive momentum, while the 4-hour chart leans towards 'SELL' with negative MACD. The daily chart, however, presents a bearish signal despite a strong ADX of 32.19, suggesting a powerful downtrend is in place. This conflicting data for oil highlights the market's sensitivity to geopolitical events in the Middle East, which have historically been a major driver of crude prices. If oil prices continue to climb due to escalating tensions, it could fuel inflation fears, making gold more attractive. Conversely, if the geopolitical risks subside and oil prices ease, it might reduce the inflation hedge demand for gold.
Looking at the broader equity markets, the S&P 500 is up 0.74% at 6572.87, while the Nasdaq 100 has seen a dip of 0.81% to 26465.14. This divergence is noteworthy. The S&P 500's upward momentum, despite a bearish signal on its 1-hour chart, suggests underlying strength, potentially indicating a growing risk appetite. However, the Nasdaq's decline signals caution in the tech sector, which can sometimes spill over into broader market sentiment. A risk-off environment, where major indices like the Nasdaq falter, typically benefits safe-haven assets like gold. Conversely, a sustained rally in equities, particularly in the tech-heavy Nasdaq, could divert investment away from gold. The current mixed signals from the US equity indices add to the overall uncertainty, making it difficult to gauge the prevailing market sentiment definitively. The key is to watch if the Nasdaq's weakness persists and if it drags down the broader market.
The performance of other major currency pairs also offers clues. EUR/USD is trading at 1.17593, showing a slight daily decline. The 1-hour and 4-hour charts lean towards 'SELL', but the daily chart gives a strong 'BUY' signal. This mirrors the conflicting signals seen in gold and the dollar. A stronger Euro could potentially weaken the dollar, providing a tailwind for gold, but the immediate technicals suggest otherwise. GBP/USD at 1.34997 is also showing mixed signals across timeframes, with short-term 'SELL' and daily 'BUY' signals. AUD/USD at 0.71484 and NZD/USD at 0.58691 are showing similar patterns, with short-term bearishness and longer-term bullish tendencies. This widespread conflict across major currency pairs reinforces the idea that the market is in a consolidation phase, awaiting a clearer fundamental or technical catalyst.
The current technical condition suggests that gold is in a 'WATCH_ZONE'. The ADX values across different timeframes (1H: 24.88, 4H: 19.02, 1D: 21.26) generally indicate moderate to weak trend strength. This means that any moves are likely to be within a range, or a breakout is yet to be confirmed. The Stochastic oscillator provides conflicting signals: bullish on the 1H, bearish on the 4H, and bearish on the 1D. RSI readings are also mixed, ranging from 43.91 (1H) to 50.95 (1D). This lack of clear directional consensus across indicators, coupled with the mixed geopolitical and macroeconomic backdrop, makes definitive short-term trading risky. A clear setup would emerge if these indicators began to align. For instance, a daily close above the resistance level of $4,798.93, accompanied by stronger bullish momentum across multiple timeframes and a rising RSI above 50, would signal a more reliable upside potential.
The interplay between gold and oil prices, particularly Brent crude at $96.93, is a critical element to monitor. The significant daily jump in oil prices suggests that geopolitical risks are being priced back into the energy market. If these tensions continue to escalate, especially around the Strait of Hormuz, we could see further upward pressure on oil. This, in turn, could boost gold's appeal as an inflation hedge. However, the conflicting signals on the oil charts, with the daily timeframe showing a strong downtrend despite the recent jump, indicate that the market is still digesting the news. The market needs to see sustained upward momentum in oil prices, coupled with a clear increase in inflation expectations, to trigger a significant flight to gold based on this factor alone.
The debate between bulls and bears for XAUUSD hinges on several key levels and unfolding events. The bulls are looking for a decisive break above the immediate resistance at $4,798.93. If gold can clear this level and sustain its position, the next targets would be $4,802.83 and potentially push towards the daily resistance at $4,893.01. This scenario would be supported by a weakening dollar (DXY falling below 98.00) and a surge in risk aversion, prompting safe-haven flows into gold. Conversely, the bears are watching the support at $4,775.85. A break below this level, especially on increased volume, could signal a move towards the 4-hour support at $4,741.22 and the daily support at $4,708.31. This bearish outcome would likely be triggered by de-escalation in the Middle East, a strengthening dollar, and a renewed risk-on sentiment in the equity markets. The current indecisive technicals make it a 50-50 proposition in the very short term.
The current 'WATCH_ZONE' status for XAUUSD implies that patience is the most prudent strategy for traders. While the daily chart offers a more constructive outlook, the short-term intraday charts are clouded with conflicting signals. The lack of a clear trend and the presence of divergent indicators suggest that the market is consolidating its recent moves. A decisive move above the $4,798.93 resistance, supported by positive momentum across multiple timeframes and a falling DXY, would be the first step towards a bullish confirmation. Conversely, a failure to hold the support at $4,775.85, coupled with rising oil prices and continued geopolitical uncertainty, could signal a deeper correction. Until then, managing risk and waiting for a clearer technical or fundamental catalyst is the recommended approach.
The market sentiment is currently characterized by a cautious optimism, tempered by lingering geopolitical risks. While some economic data points, like the recent oil price surge, suggest underlying inflationary pressures, the overall picture remains mixed. The Federal Reserve's stance, which is data-dependent, continues to be a major influence. Any indication of a prolonged higher interest rate environment could weigh on gold, while signs of economic slowdown or increased uncertainty could bolster its safe-haven appeal. The current price action around $4,787.50 reflects this ambiguity. Traders are looking for confirmation – a clear break of resistance or support – before committing significant capital. The battle between bulls and bears is far from over, and the coming days will be crucial in determining gold's next significant move.
Bearish Scenario: Consolidation Below Resistance
65% ProbabilityNeutral Scenario: Range-Bound Volatility
25% ProbabilityBullish Scenario: Breakout Above Resistance
10% ProbabilityFrequently Asked Questions: XAUUSD Analysis
What happens if XAUUSD breaks below the $4,775.85 support level?
A break below $4,775.85 on the 1-hour chart would invalidate the current neutral stance and could lead to a test of the $4,779.75 and $4,775.85 support levels. This would likely be accompanied by a strengthening dollar and fading risk appetite.
Should I buy XAUUSD at current levels around $4,787.50 given the mixed signals?
Buying at current levels is not advised due to conflicting technical signals across timeframes. A high-probability setup would require confirmation, such as a daily close above $4,798.93 or a clear break below $4,775.85.
Is the RSI at 43.91 a sell signal for XAUUSD right now?
An RSI of 43.91 on the 1-hour chart is in the neutral zone, not an oversold or overbought signal. While it shows a slight downward tendency, it doesn't provide a strong sell signal on its own. Confirmation from other indicators or price action is needed.
How will rising oil prices around $96.93 affect XAUUSD this week?
Rising oil prices, like the current Brent crude level of $96.93, can increase inflation expectations, potentially boosting gold's appeal as an inflation hedge. However, this effect is counteracted by dollar strength and risk appetite trends, creating a complex dynamic.
Track markets in real-time
AI-powered analysis, technical indicators and real-time price data.
Join Our Telegram Channel
Breaking market news, AI analysis and trading signals instantly.
Join Channel