

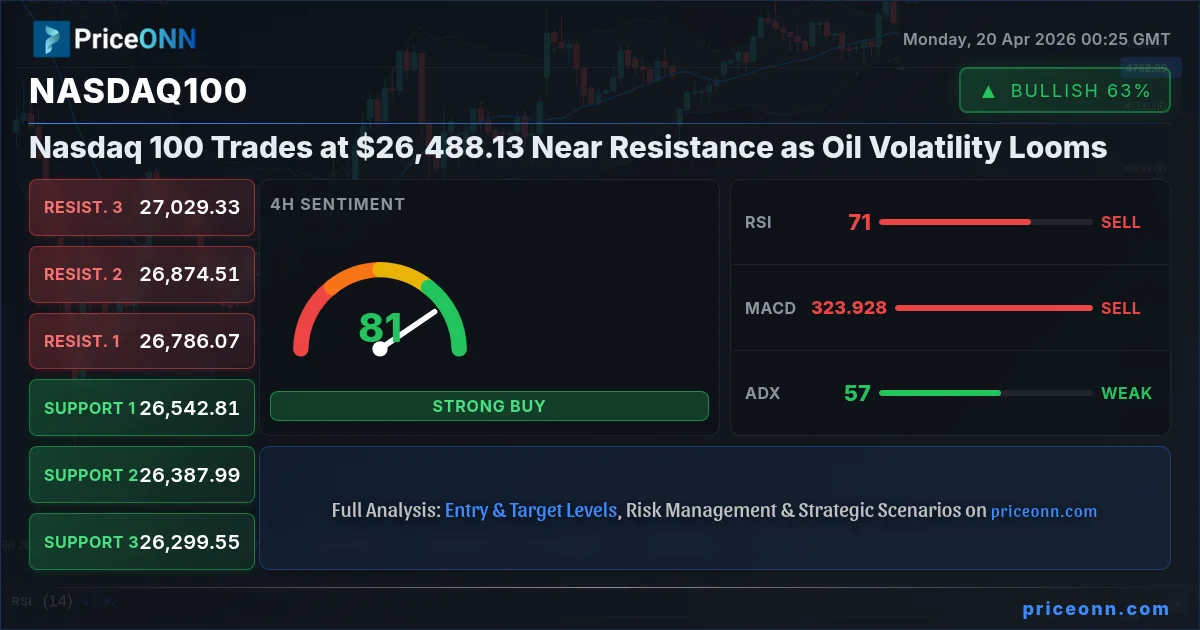
The financial markets are a complex tapestry, and right now, the threads connecting the Nasdaq 100's performance to the volatile energy sector and a strengthening dollar are particularly tight. With the Nasdaq 100 currently trading at $26,488.13, investors are weighing a confluence of technical signals against a backdrop of shifting macroeconomic winds. The recent surge in Brent crude oil prices, coupled with the persistent strength of the US Dollar Index (DXY), presents a challenging environment for risk assets. This analysis delves into the intricate interplay between these markets, exploring how the current technical setup for the Nasdaq 100, particularly its proximity to resistance levels, might be influenced by these broader forces. Understanding these cross-market dynamics is crucial for navigating the choppy waters ahead.
- Nasdaq 100 hovers near resistance at $26,488.13, with the 4-hour chart showing RSI at 71.9 signaling potential overbought conditions.
- Critical resistance for the Nasdaq 100 is identified at $26,786.07, while key support lies at $26,542.81.
- DXY strength at 98.08 adds pressure, suggesting a cautious stance for riskier assets like tech stocks.
- Oil volatility, with Brent at $97.16, contributes to broader market uncertainty, potentially impacting investor risk appetite for the Nasdaq 100.
Navigating Resistance: The Nasdaq 100's Tightrope Walk
The $26,488.13 Crossroads
The Nasdaq 100, a bellwether for the tech-heavy segment of the market, is currently perched at a critical juncture. Trading at precisely $26,488.13, the index is approaching significant resistance levels that have historically acted as a ceiling for price advancements. On the 1-hour chart, the ADX at 32.29 indicates a strong trend, but this is contrasted by the MACD's negative momentum and a Stochastic oscillator showing a potential downturn from overbought territory. This divergence highlights the immediate challenge: can the bulls push through the overhead resistance, or will profit-taking emerge? The daily chart paints a slightly more optimistic picture with a bullish MACD and Bollinger bands suggesting an upward trend, but the RSI at 73.92 on the daily timeframe signals that the market may be entering 'overbought' territory, a zone where pullbacks become more probable. This delicate balance between short-term caution and longer-term bullish signals creates a nuanced outlook for traders.
Why Nasdaq 100 Volatility Analysis Points to a Potential Shift
The interplay of indicators on the Nasdaq 100 currently suggests a market at a crossroads. While the 4-hour chart shows a robust trend with an ADX reading of 56.5, indicating strong momentum, other indicators present a more cautious view. The RSI on the same timeframe is at 71.9, a level often associated with overbought conditions, implying that the recent upward move might be losing steam. Similarly, the Stochastic oscillator, with K at 85.76 and D at 87.28, is deep in overbought territory, hinting at a potential reversal or at least a period of consolidation. This is compounded by the 1-hour chart, where the RSI sits at 51.39 and the MACD shows negative momentum. This conflict between timeframes suggests that while the broader trend might still be upwards, short-term traders should be wary of extended rallies without further confirmation. The key will be how the index reacts to the resistance levels identified around $26,786.07.
Macroeconomic Currents: DXY Strength and Oil's Wild Ride
The Dollar's Grip: DXY at 98.08
The US Dollar Index (DXY) is currently trading at 98.08, showing a clear upward trend on the 1-hour chart with an ADX of 22.35. This strength in the dollar often acts as a headwind for risk assets, including the Nasdaq 100. A stronger dollar makes US exports more expensive and can reduce the repatriated earnings of multinational corporations, many of which are heavily represented in the tech sector. Furthermore, a rising DXY can signal a 'risk-off' sentiment in the market, where investors flock to the perceived safety of the dollar, pulling capital away from equities. The DXY's daily chart, however, presents a more bearish picture with RSI at 43.01 and a negative MACD, suggesting that the dollar's current strength might be a short-term phenomenon rather than a sustained rally. This divergence adds another layer of complexity, as traders must consider whether the dollar's upward momentum will continue to pressure the Nasdaq 100 or if a reversal is imminent.
Oil's Volatility: Brent at $97.16 and its Ripple Effect
The energy markets are currently experiencing significant turbulence, with Brent crude oil trading at $97.16. The daily chart shows a bearish signal with ADX at 34.16, indicating a strong downward trend, yet the 1-hour chart displays a bullish signal with an ADX of 35.12. This internal conflict highlights the choppiness in oil prices. Oil price volatility is a critical factor for the broader market sentiment. Surging oil prices can fuel inflation concerns, prompting central banks to consider more aggressive monetary tightening, which is typically bearish for equities. Conversely, falling oil prices can alleviate inflation fears but might also signal weakening global demand, another negative for risk assets. The recent news regarding the Strait of Hormuz and the potential for geopolitical tensions to disrupt supply adds another layer of uncertainty. This oil market volatility directly impacts inflation expectations and investor risk appetite, which in turn can influence the Nasdaq 100's trajectory. A sustained rise in oil prices could lead to increased inflation fears, pressuring the Fed and subsequently weighing on tech stocks.
Intermarket Dynamics: Correlating Nasdaq 100 with Broader Trends
The Nasdaq 100 does not trade in a vacuum. Its correlation with other major market indices and assets provides crucial context. Currently, the S&P 500 is trading at 6572.87, showing a strong upward trend on the 1-hour chart (ADX 49.72) but a bearish trend on the daily chart (ADX 47.51). This mixed picture in the broader equity market mirrors the Nasdaq 100's own internal conflicts. The Nasdaq 100's daily chart shows a bearish trend with an ADX of 29.85, but its 4-hour chart indicates a strong bullish trend (ADX 56.5). This suggests that while the short-to-medium term trend might be positive, the longer-term outlook requires careful monitoring. The Dow Jones Industrial Average, at 49001, also presents a mixed technical picture, with a strong bullish trend on the 4-hour chart (ADX 21.27) but a bearish trend on the 1-hour chart (ADX 38.86). This divergence across major indices implies that the market is in a state of flux, with conflicting signals demanding a cautious approach. The correlation between these indices and the Nasdaq 100 is vital; a broad-based sell-off in equities would likely drag the Nasdaq 100 lower, regardless of its individual technical setup.
Geopolitical Undercurrents and Inflationary Pressures
The Lingering Threat of Inflation
Inflation remains a central theme in market commentary, and its influence on central bank policy is paramount. While the provided economic calendar data for the upcoming week is sparse on high-impact releases for the next few days, the general concern over inflation persists. Elevated oil prices, as seen with Brent crude at $97.16, are a significant contributor to this inflationary pressure. If oil prices continue to climb, it could force the Federal Reserve to maintain a hawkish stance on interest rates for longer than anticipated. Higher interest rates increase the cost of borrowing for companies, impacting their profitability and often leading to a re-evaluation of equity valuations, particularly for growth-oriented tech stocks within the Nasdaq 100. The sensitivity of the tech sector to interest rate expectations means that any hint of sustained inflation could trigger a notable pullback. Traders are therefore closely watching any developments that could signal a shift in the inflation outlook.
Geopolitical Tensions and Risk Sentiment
Geopolitical events continue to cast a shadow over global markets. Recent news highlighted the fluctuating situation around the Strait of Hormuz, a critical chokepoint for oil supply. While tensions can ease, as indicated by a temporary reopening, the underlying risks remain. Such geopolitical instability often triggers 'risk-off' sentiment, where investors move away from riskier assets like equities and cryptocurrencies towards perceived safe havens such as gold, the US dollar, or government bonds. The DXY's current strength at 98.08 could be partly attributed to this risk aversion. For the Nasdaq 100, increased geopolitical uncertainty can lead to heightened volatility and potential sell-offs, as investors prioritize capital preservation over growth. The market's reaction to these events is often swift and can override purely technical considerations. Therefore, staying informed about geopolitical developments is as crucial as analyzing price charts.
Central Bank Watch: The Fed's Balancing Act
The Federal Reserve's monetary policy decisions are a primary driver for equity markets, especially growth stocks like those in the Nasdaq 100. While no immediate high-impact US economic data is scheduled in the next 72 hours according to the provided calendar, the market remains highly sensitive to any signals from Fed officials regarding future interest rate policy. The current DXY strength might be interpreted as a sign that market participants are anticipating a more hawkish stance from the Fed, perhaps due to persistent inflation concerns stemming from high energy prices. The Nasdaq 100's correlation with the dollar suggests that any indication of tighter monetary policy could put downward pressure on the index. Investors will be scrutinizing any commentary from Fed members for clues about the central bank's next move, as interest rate expectations continue to be a dominant theme influencing equity valuations.
Trading Scenarios for the Nasdaq 100
Bearish Scenario: Testing Lower Support Levels
55% ProbabilityConsolidation Scenario: Range-Bound Trading
25% ProbabilityBullish Scenario: Breaking Through Resistance
20% ProbabilityGiven the conflicting signals across different timeframes and the looming macroeconomic uncertainties, a period of consolidation or a pullback seems more probable in the short term. Traders should look for clear confirmation before committing to a direction, paying close attention to the $26,542.81 support level and the $26,786.07 resistance.
FAQ Section for Nasdaq 100 Analysis
What happens if the Nasdaq 100 breaks below the $26,542.81 support level?
If the Nasdaq 100 closes decisively below $26,542.81, it would likely trigger a bearish scenario, potentially leading to a test of lower support levels. The next significant targets would be $26,387.99 and $26,299.55, as indicated by the 4-hour chart's support structure.
Should I buy the Nasdaq 100 at current levels around $26,488.13 given the mixed signals?
Buying at $26,488.13 requires caution due to the proximity to resistance and conflicting indicator signals. A more prudent approach might be to wait for a confirmed breakout above $26,786.07 or a clear bounce from support near $26,542.81, especially if coupled with a less hawkish DXY or stabilizing oil prices.
Is the RSI at 71.9 on the 4-hour chart a sell signal for the Nasdaq 100 right now?
An RSI of 71.9 on the 4-hour chart suggests overbought conditions, which historically can precede a pullback or consolidation. While not an immediate sell signal on its own, it warrants attention and suggests that further upside may be limited without additional bullish confirmation.
How might continued DXY strength at 98.08 affect the Nasdaq 100's outlook this week?
Continued strength in the DXY, currently at 98.08, generally exerts downward pressure on risk assets like the Nasdaq 100. It could signal risk aversion or anticipation of tighter Fed policy, potentially capping upside potential for the index unless key support levels hold firm.
Track markets in real-time
AI-powered analysis, technical indicators and real-time price data.
Join Our Telegram Channel
Breaking market news, AI analysis and trading signals instantly.
Join Channel