

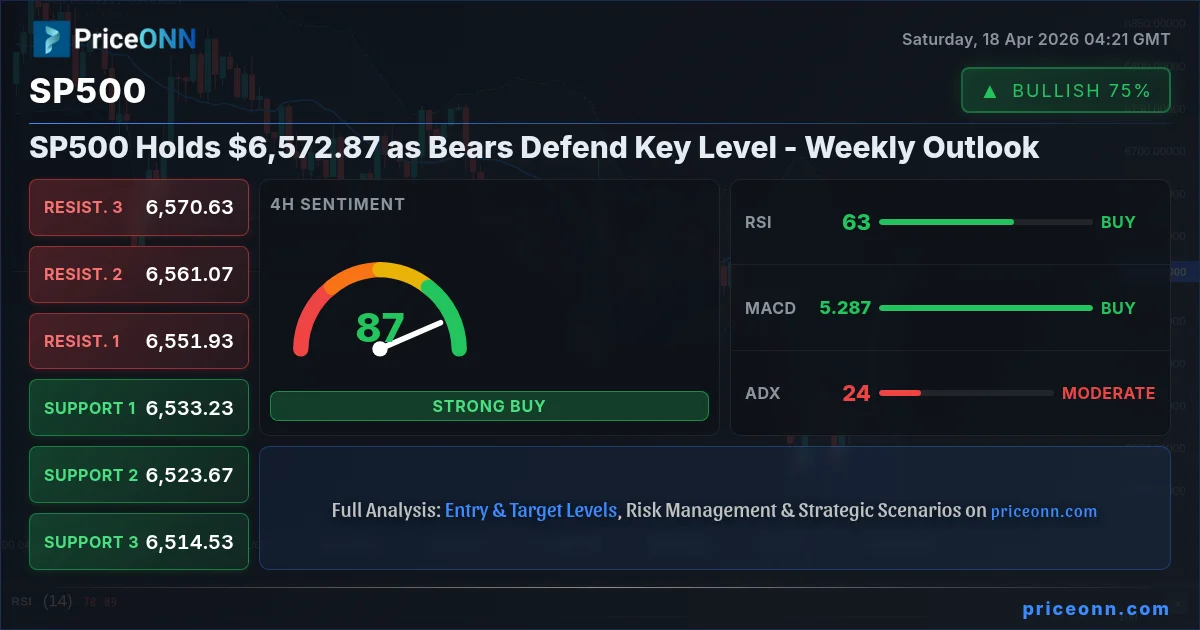
The S&P 500 (SP500) closed last week at $6,572.87, a pivotal point where both bullish and bearish forces are intensely battling. This level has become the line in the sand for market participants, dictating the short-term sentiment and potential direction for the broader US equity market. Last week's price action, characterized by volatility and indecision around this key figure, suggests that the upcoming week will be critical in determining whether the index consolidates, reverses, or pushes higher. Having tracked SP500 through significant market shifts, it's clear that $6,572.87 represents more than just a price point; it's a psychological barrier and a confluence of technical indicators that traders are closely watching.
- SP500's RSI stands at 62.83 on the 4H chart, indicating strong upward momentum but not yet in overbought territory, suggesting room for further upside.
- The critical support level for SP500 sits at $6,533.23, a level that held firm last week, acting as a floor for the bulls.
- MACD histogram on the 4H chart shows positive momentum, aligning with the bullish bias, while the 1H chart shows negative momentum, indicating potential short-term pullbacks.
- The correlation with DXY at 97.72 suggests that a weaker dollar could provide a tailwind for equities, though the market is currently showing mixed signals.
Navigating the $6,572.87 Crossroads: A Technical Perspective
The 1-Hour Chart: A Battleground for Short-Term Sentiment
Looking at the 1-hour chart for the SP500, the picture is one of intense crosscurrents. The trend is firmly classified as 'Yükseliş' (Uptrend) with a strong 100% power rating, yet the technical signals present a more nuanced view. The current price of $6,572.87 hovers just below the immediate resistance at $6,577.27. Support levels are clearly defined, with the nearest at $6,547.63, followed by $6,535.07 and $6,526.53. The RSI(14) is at 70.95, firmly in overbought territory on this timeframe. This reading, while indicating strong recent upward movement, often precedes consolidation or a minor pullback as buyers pause to take profits. It's a classic sign that the market might be getting a little too extended on the short term.
The MACD indicator on the 1-hour chart shows negative momentum, with the MACD line below its signal line. This is a bearish signal on this very short timeframe, contrasting with the overall uptrend. This divergence is crucial; it suggests that the upward momentum seen on longer timeframes might be facing headwinds in the immediate trading hours. The Bollinger Bands are positioned above the middle band, supporting the idea of an uptrend, but the RSI's position warns of potential exhaustion. Stochastic K=65.73 and D=73.5 also indicate overbought conditions, with %K
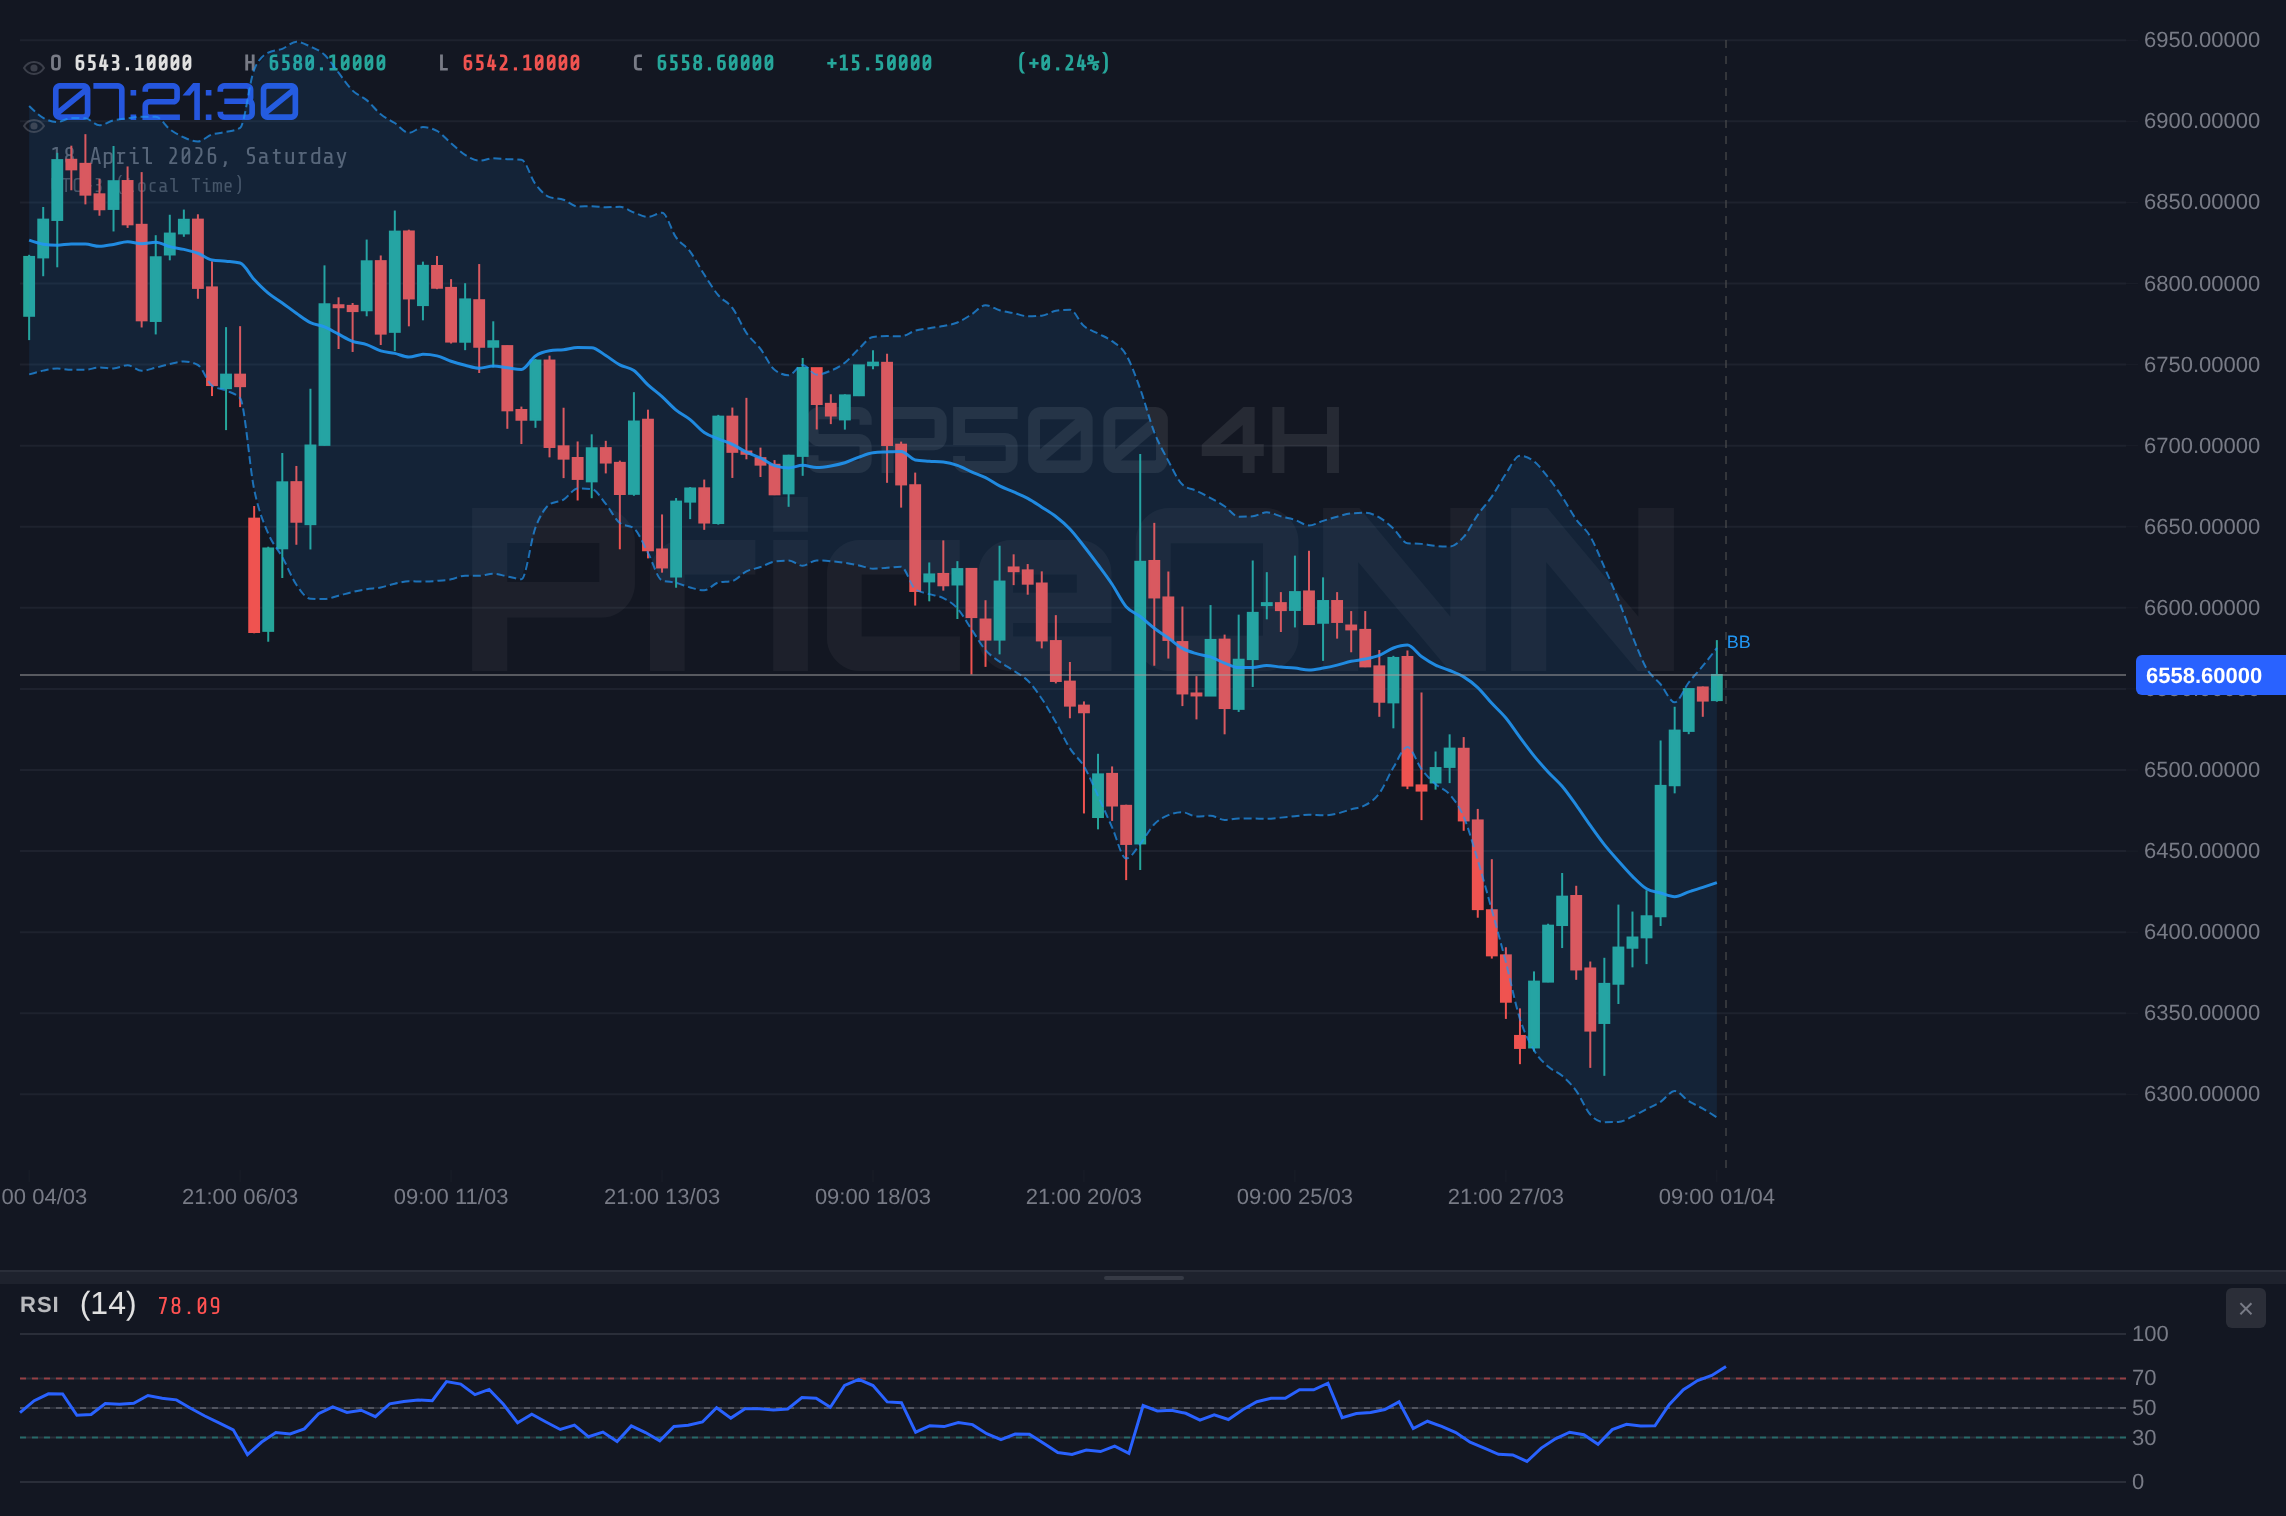
The 4-Hour Chart: Sustaining the Bullish Momentum
Stepping back to the 4-hour timeframe offers a more robust view of the SP500's trend. Here, the trend is also classified as 'Yükseliş' (Uptrend), with a strong 50% power rating. The current price of $6,572.87 is comfortably above the middle Bollinger Band, indicating sustained buying pressure. The support levels are more significant on this timeframe: $6,533.23, $6,523.67, and $6,514.53. These levels represent stronger potential turning points if the market decides to pull back. The RSI(14) is at 62.83, which is in neutral territory but leaning towards bullish, suggesting there's still room for the index to climb without being severely overbought. This is a healthier reading than the 1-hour RSI, implying the broader upward move has legs.
The MACD indicator on the 4-hour chart shows positive momentum, with the MACD line above its signal line. This aligns with the overall bullish sentiment and reinforces the idea that the larger trend remains intact. Stochastic K=97.85 and D=86.96 are deep in overbought territory, a reading that has persisted for some time. While this can indicate a strong uptrend, it also suggests that any pullback could be sharp if selling pressure emerges. The ADX at 24.23 indicates a moderately strong uptrend, which is consistent with the price action. The confluence of positive MACD and a strong RSI, despite the extremely overbought Stochastic, gives a solid 'AL' (Buy) signal on this timeframe, with 6 buys, 2 sells, and 0 neutral. It paints a picture of a market that is trending upwards, but where caution is still warranted due to stretched short-term indicators.
The Daily Chart: The Bigger Picture and Long-Term Trend
Examining the daily chart provides the most critical context for the SP500's current position. The trend here is classified as 'Düşüş' (Downtrend) with a 100% power rating. This is a significant divergence from the shorter timeframes and highlights the ongoing debate between short-term optimism and longer-term structural concerns. The current price of $6,572.87 is well below the key daily resistance levels, which are situated at $6,605.07, $6,685.83, and $6,832.67. These resistance points are formidable, and breaking through them would require significant bullish conviction and likely a shift in the underlying macro narrative. The support levels on the daily chart are much further down: $6,377.47, $6,230.63, and $6,149.87. These are the levels that would come into play if the longer-term downtrend reasserts itself.
The RSI(14) on the daily chart is at 45.35, sitting in neutral territory but clearly indicating a bearish bias, reflecting the downtrend. This reading suggests that rallies are being met with selling pressure, and the market is struggling to regain upward momentum. The MACD indicator is also showing negative momentum, with the MACD line below its signal line, confirming the bearish trend. This reinforces the idea that the recent strength might be a counter-trend rally within a larger bearish structure. The Bollinger Bands are trading below the middle band, another bearish signal. Stochastic K=42.97 and D=29.88 indicate a bullish divergence, with %K > %D, suggesting that while the trend is down, the selling pressure might be easing, and a bounce is possible. However, the ADX at 47.51 confirms a strong downtrend. The overall signal on the daily chart is 'SAT' (Sell) with 2 buys, 5 sells, and 0 neutral. This daily perspective is crucial: it reminds us that the recent upward moves, while present on shorter timeframes, are occurring within a larger, dominant bearish trend. Any bullish thesis must contend with these daily signals.
Correlation Dynamics: DXY, Bonds, and Risk Sentiment
The Dollar Index (DXY) and Its Influence
The relationship between the US Dollar Index (DXY) and major risk assets like the SP500 is a cornerstone of market analysis. Currently, the DXY is trading at 97.72, showing a slight dip of -0.06% for the day. On the 1-hour chart, the DXY shows a neutral trend with a 50% power rating, RSI at 56.83, and MACD with negative momentum. However, the 4-hour chart presents a different picture: neutral trend, but RSI at 47.84 (bearish bias) and MACD showing positive momentum. The daily chart, however, is more decisively bearish, with RSI at 40.62 and negative MACD momentum, indicating a potential weakening of the dollar in the longer term. The ADX readings across timeframes are mixed, suggesting some trend strength but not overwhelmingly so.
When the DXY weakens, it typically correlates with increased risk appetite in assets like the SP500 and gold, as investors move away from the perceived safety of the dollar. Conversely, a strengthening dollar often puts pressure on these assets. At $6,572.87, the SP500's performance is sensitive to these dollar movements. If the DXY continues its bearish trend on the daily chart, it could provide a supportive tailwind for equities, potentially helping the SP500 to overcome the resistance at $6,572.87 and challenge higher levels. However, the mixed signals between the 1-hour and 4-hour charts mean this relationship is not providing a clear directional cue just yet. Traders must remain vigilant; a sharp move in the DXY could quickly shift the sentiment for the SP500.
Treasury Yields and Risk Appetite
Treasury yields, particularly those on longer-dated bonds like the 10-year Treasury, are another critical barometer of market sentiment and economic expectations. While specific yield data isn't provided in the live market feed, general market knowledge indicates that rising yields often correlate with increasing risk appetite, benefiting equities as investors anticipate stronger economic growth and potentially higher corporate earnings. Conversely, falling yields can signal a 'flight to safety,' putting pressure on stocks as investors seek the perceived security of government debt. The current market environment, with the SP500 trading around $6,572.87, is likely influenced by the trajectory of yields. If yields are trending upwards, it would support the bullish case for the SP500, especially if it's driven by positive economic data rather than inflation fears.
However, the dichotomy seen in the SP500's own technical indicators - bullish on shorter timeframes but bearish on the daily chart - suggests that the underlying economic narrative is complex. Are yields rising because of strong growth expectations, or because of persistent inflation concerns that might eventually prompt aggressive central bank action? This ambiguity is likely contributing to the volatility around the $6,572.87 level. The market is essentially weighing the prospect of economic expansion against the risk of inflation and subsequent monetary tightening. The interplay between bond yields and equity prices remains a key dynamic to monitor as we head into the next trading week.
Commodities: The Inflationary Signal
Commodities, particularly oil, serve as a vital indicator of inflationary pressures and global demand. Brent crude is currently trading at $92.54, showing a significant daily drop of -6.93%. WTI crude is also down, trading at $86.42 after a -6.71% decline. This sharp fall in oil prices is noteworthy. Historically, high oil prices have been a significant driver of inflation concerns, often leading to fears of aggressive central bank tightening, which can dampen economic growth and pressure stock markets. The fact that oil prices have fallen sharply suggests that either supply concerns are easing, or global demand expectations are being revised downwards.
This decline in oil prices could have a dual effect on the SP500. On one hand, lower energy costs can reduce inflationary pressures, potentially easing the path for central banks to adopt a more accommodative stance or at least pause rate hikes. This could be seen as a positive for equities. On the other hand, a steep drop in oil prices can also be interpreted as a signal of weakening global economic activity, which is inherently bearish for corporate earnings and thus for the SP500. The current price action around $6,572.87 suggests the market is grappling with this dichotomy. Is the drop in oil a sign of cooling inflation, or a precursor to a broader economic slowdown? The answer will significantly influence the SP500's trajectory.
Geopolitical Undercurrents and Market Sentiment
Global Risk Appetite: A Tightrope Walk
Market sentiment, often described as 'risk-on' or 'risk-off,' is a powerful driver of asset prices. Currently, the SP500's struggle around $6,572.87 reflects a market that is neither fully embracing risk nor fleeing from it. The S&P 500 itself is showing a mixed picture technically, with strong short-term uptrends but a dominant long-term downtrend on the daily chart. The Nasdaq 100, trading at $26,682.75, is showing a more robust bullish trend across multiple timeframes, indicating that the tech sector might be leading the charge or is more resilient. However, the Dow Jones Industrial Average (DJIA) at $49,470.50 is also showing strong bullish signals on shorter timeframes, despite a neutral daily trend.
The recent news flow is also contributing to this mixed sentiment. Reports of Bitcoin consolidating near $75,000 suggest a cautious optimism in the crypto space, often seen as a risk-on asset. Simultaneously, the strength in the Canadian dollar (USD/CAD falling below 1.3700) linked to oil prices could indicate underlying strength in commodity-linked currencies, which sometimes aligns with risk appetite. However, the mention of gold prices consolidating near $4,900, with potential for a breakout, hints at underlying safe-haven demand or inflation concerns. This complex web of signals means that the SP500's move above $6,572.87 will likely depend on a clearer macro narrative emerging, one that decisively tilts the scales towards risk-on or risk-off.
Specific Geopolitical Flashpoints
While the provided data doesn't detail specific geopolitical events, the general market context is always influenced by global stability. Tensions in the Middle East, ongoing geopolitical realignments, and potential trade disputes remain background risks that can quickly elevate volatility. For instance, any escalation of conflict in energy-producing regions could rapidly drive oil prices higher, reigniting inflation fears and potentially triggering a risk-off move that would pressure the SP500. Conversely, signs of de-escalation or diplomatic progress could bolster risk sentiment and support equity markets.
The strength of the US dollar, or lack thereof, is also often intertwined with geopolitical stability. A flight to the dollar as a safe haven can occur during times of global uncertainty, which, as noted, can pressure the SP500. The current DXY level of 97.72 and its mixed technical signals suggest that global uncertainty is present but not yet at a fever pitch that would cause a full-blown flight to safety. The market appears to be in a holding pattern, waiting for clearer catalysts. The price action around $6,572.87 reflects this cautious stance – buyers are present, but significant conviction for a sustained breakout is lacking until geopolitical risks abate or a strong bullish macro narrative takes hold.
Trade Scenarios for the SP500 Around $6,572.87
Bearish Scenario: Retreat Below Key Support
60% ProbabilityNeutral Scenario: Consolidation Around $6,572.87
25% ProbabilityBullish Scenario: Breakout Above Resistance
15% ProbabilityEconomic Calendar Watchlist and Market Impact
The economic calendar for the upcoming week holds several key releases that could significantly influence the SP500's trajectory around the $6,572.87 mark. While the past week saw data releases like [GBP] actual 0.5 vs forecast 0.1, indicating stronger than expected manufacturing output, and [EUR] actual 2.6 vs forecast 2.5 for industrial production, suggesting modest economic resilience in Europe, the focus now shifts to upcoming US data. The upcoming US Non-Farm Payrolls (NFP) report, with a forecast of 207k versus a previous of 218k, will be paramount. A significantly weaker number could fuel recession fears and pressure stocks, while a stronger-than-expected result might reignite inflation concerns and prompt hawkish central bank expectations.
Furthermore, upcoming US inflation data, such as the Personal Consumption Expenditures (PCE) price index (actual -0.913 vs forecast 2.1), will be crucial. If inflation proves to be more persistent than anticipated, it could force the Federal Reserve into more aggressive tightening, creating headwinds for the SP500. Conversely, signs of cooling inflation could support a more dovish outlook, potentially boosting risk assets. The market's reaction to these data points will be key. Will the SP500 rally on positive economic news, or will it falter on fears of renewed inflation? The current price action at $6,572.87 suggests traders are adopting a wait-and-see approach, prioritizing key economic data before committing to a significant directional move. The interplay between growth and inflation signals will be the primary narrative driver.
Frequently Asked Questions: SP500 Analysis
What happens if SP500 breaks below the $6,533.23 support level?
If SP500 closes decisively below $6,533.23 on a 4-hour chart, the bearish scenario becomes more probable. This would likely trigger a move towards the next support at $6,523.67, as market sentiment shifts towards risk aversion.
Should I buy SP500 at current levels of $6,572.87 given the mixed signals?
Buying at $6,572.87 requires careful risk management. The 1H chart shows overbought conditions and negative MACD momentum, suggesting short-term caution. A confirmed break above $6,577.27 with strong volume would offer a higher-probability bullish setup, while a break below $6,533.23 invalidates the immediate upside potential.
Is the RSI at 70.95 on the 1H chart a sell signal for SP500 right now?
An RSI of 70.95 on the 1-hour chart indicates overbought conditions, which can precede a short-term pullback or consolidation. While not an immediate sell signal on its own, it warrants caution for new long entries and suggests that profit-taking might occur. Confirmation from other indicators like MACD or price action breaking key levels is needed.
How will the upcoming NFP data affect SP500 this week?
The Non-Farm Payrolls (NFP) data, forecasted at 207k, could significantly impact the SP500. A much weaker number might increase recession fears, pressuring stocks downwards from $6,572.87. Conversely, a stronger-than-expected result could boost risk appetite, potentially helping the SP500 break higher, assuming it doesn't solely ignite inflation concerns.
| Indicator | Value | Signal | Interpretation |
|---|---|---|---|
| RSI (14) | 62.83 | Neutral | Sustained momentum, room to move |
| MACD Histogram | Positive | Bullish | Positive momentum building |
| Stochastic | K=97.85, D=86.96 | Overbought | Caution warranted, potential reversal zone |
| ADX | 24.23 | Moderate Trend | Upward trend is present and strengthening |
| Bollinger | Middle Band | Watch | Price is above middle band, indicating bullish bias |
Track markets in real-time
AI-powered analysis, technical indicators and real-time price data.
Join Our Telegram Channel
Breaking market news, AI analysis and trading signals instantly.
Join Channel