

The yellow metal, XAUUSD, is currently navigating a critical juncture, trading around the $4,834.08 mark as the week draws to a close. This price point represents a significant area of interest, sitting precariously close to resistance levels that have previously capped rallies. As we head into the weekend, traders are dissecting a complex tapestry of technical indicators, geopolitical undercurrents, and shifting macroeconomic expectations to gauge the precious metal's next move. The question on everyone's mind is whether the current momentum can overcome the overhead supply, or if a pullback is imminent.
- RSI at 53.91 on the daily chart indicates a neutral stance, with a slight upward bias, suggesting neither extreme overbought nor oversold conditions currently dominate.
- The critical support level for XAUUSD is holding firm around $4,763, a level that has been tested multiple times in recent trading sessions.
- MACD on the daily timeframe shows positive momentum, with the MACD line above the signal line, hinting at potential underlying strength despite proximity to resistance.
- Correlation with the Dollar Index (DXY), currently trading around 97.9, remains a key factor; a strengthening dollar typically exerts downward pressure on gold prices.
Navigating the $4,834.08 Crossroads: A Technical Deep Dive
On the 1-hour chart, XAUUSD presents a somewhat neutral picture, with the trend strength at 50%. Support is noted at $4,853.47, $4,848.68, and $4,841.39, while resistance looms at $4,865.55, $4,872.84, and $4,877.63. The RSI(14) at 53.37 hovers in neutral territory, showing a slight upward lean, suggesting buyers are present but not yet in control. MACD is exhibiting positive momentum, trading above its signal line, which is a constructive sign. However, the Stochastic oscillator, with K=64.62 and D=79.54, is flashing a bearish signal (%K
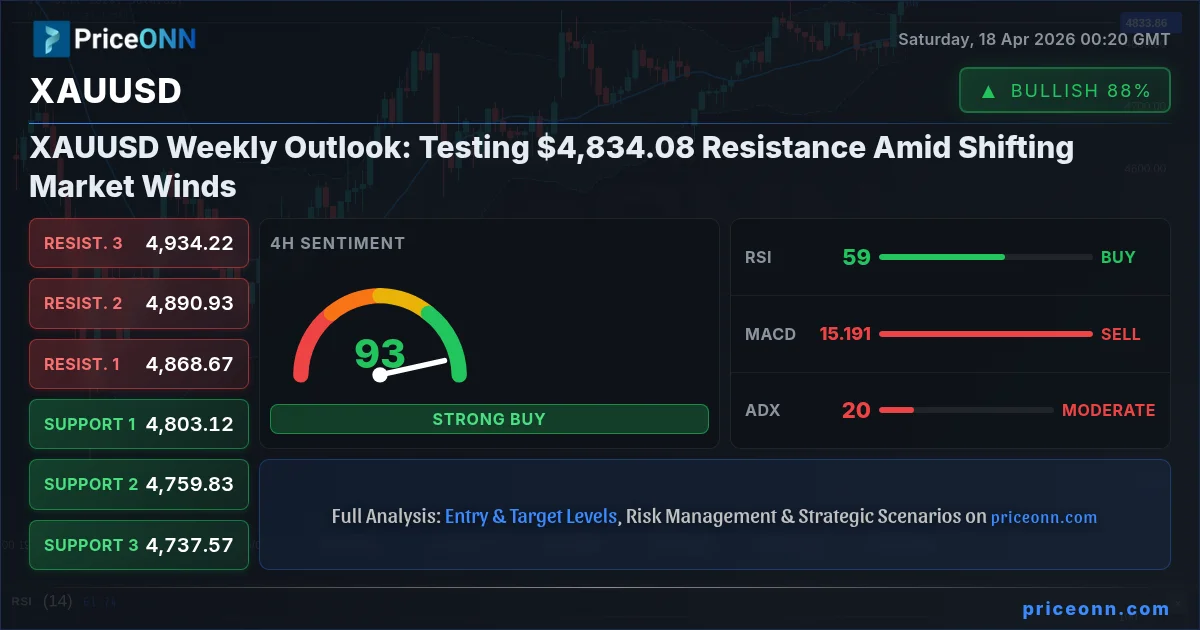
Stepping back to the 4-hour timeframe, the trend shifts to a more defined 'Uptrend' with 95% strength. Here, support levels are more robustly defined at $4,803.12, $4,759.83, and $4,737.57. Resistance remains in the vicinity of $4,868.67 and $4,890.93. The RSI(14) at 59.02 remains in neutral territory, continuing its upward trajectory, which aligns with the bullish trend. Notably, the MACD here shows negative momentum, with the MACD line below its signal line, contrasting with the 1-hour chart and suggesting potential slowing momentum on this timeframe. The Stochastic oscillator (K=64.4, D=44.28) provides a bullish signal (%K > %D), reinforcing the uptrend. The ADX at 20.46 indicates a moderately strong uptrend. The overall signal here is a strong 'BUY' (7 Buy, 1 Sell, 0 Neutral), painting a more optimistic picture than the 1-hour chart, though the MACD divergence is something to monitor.
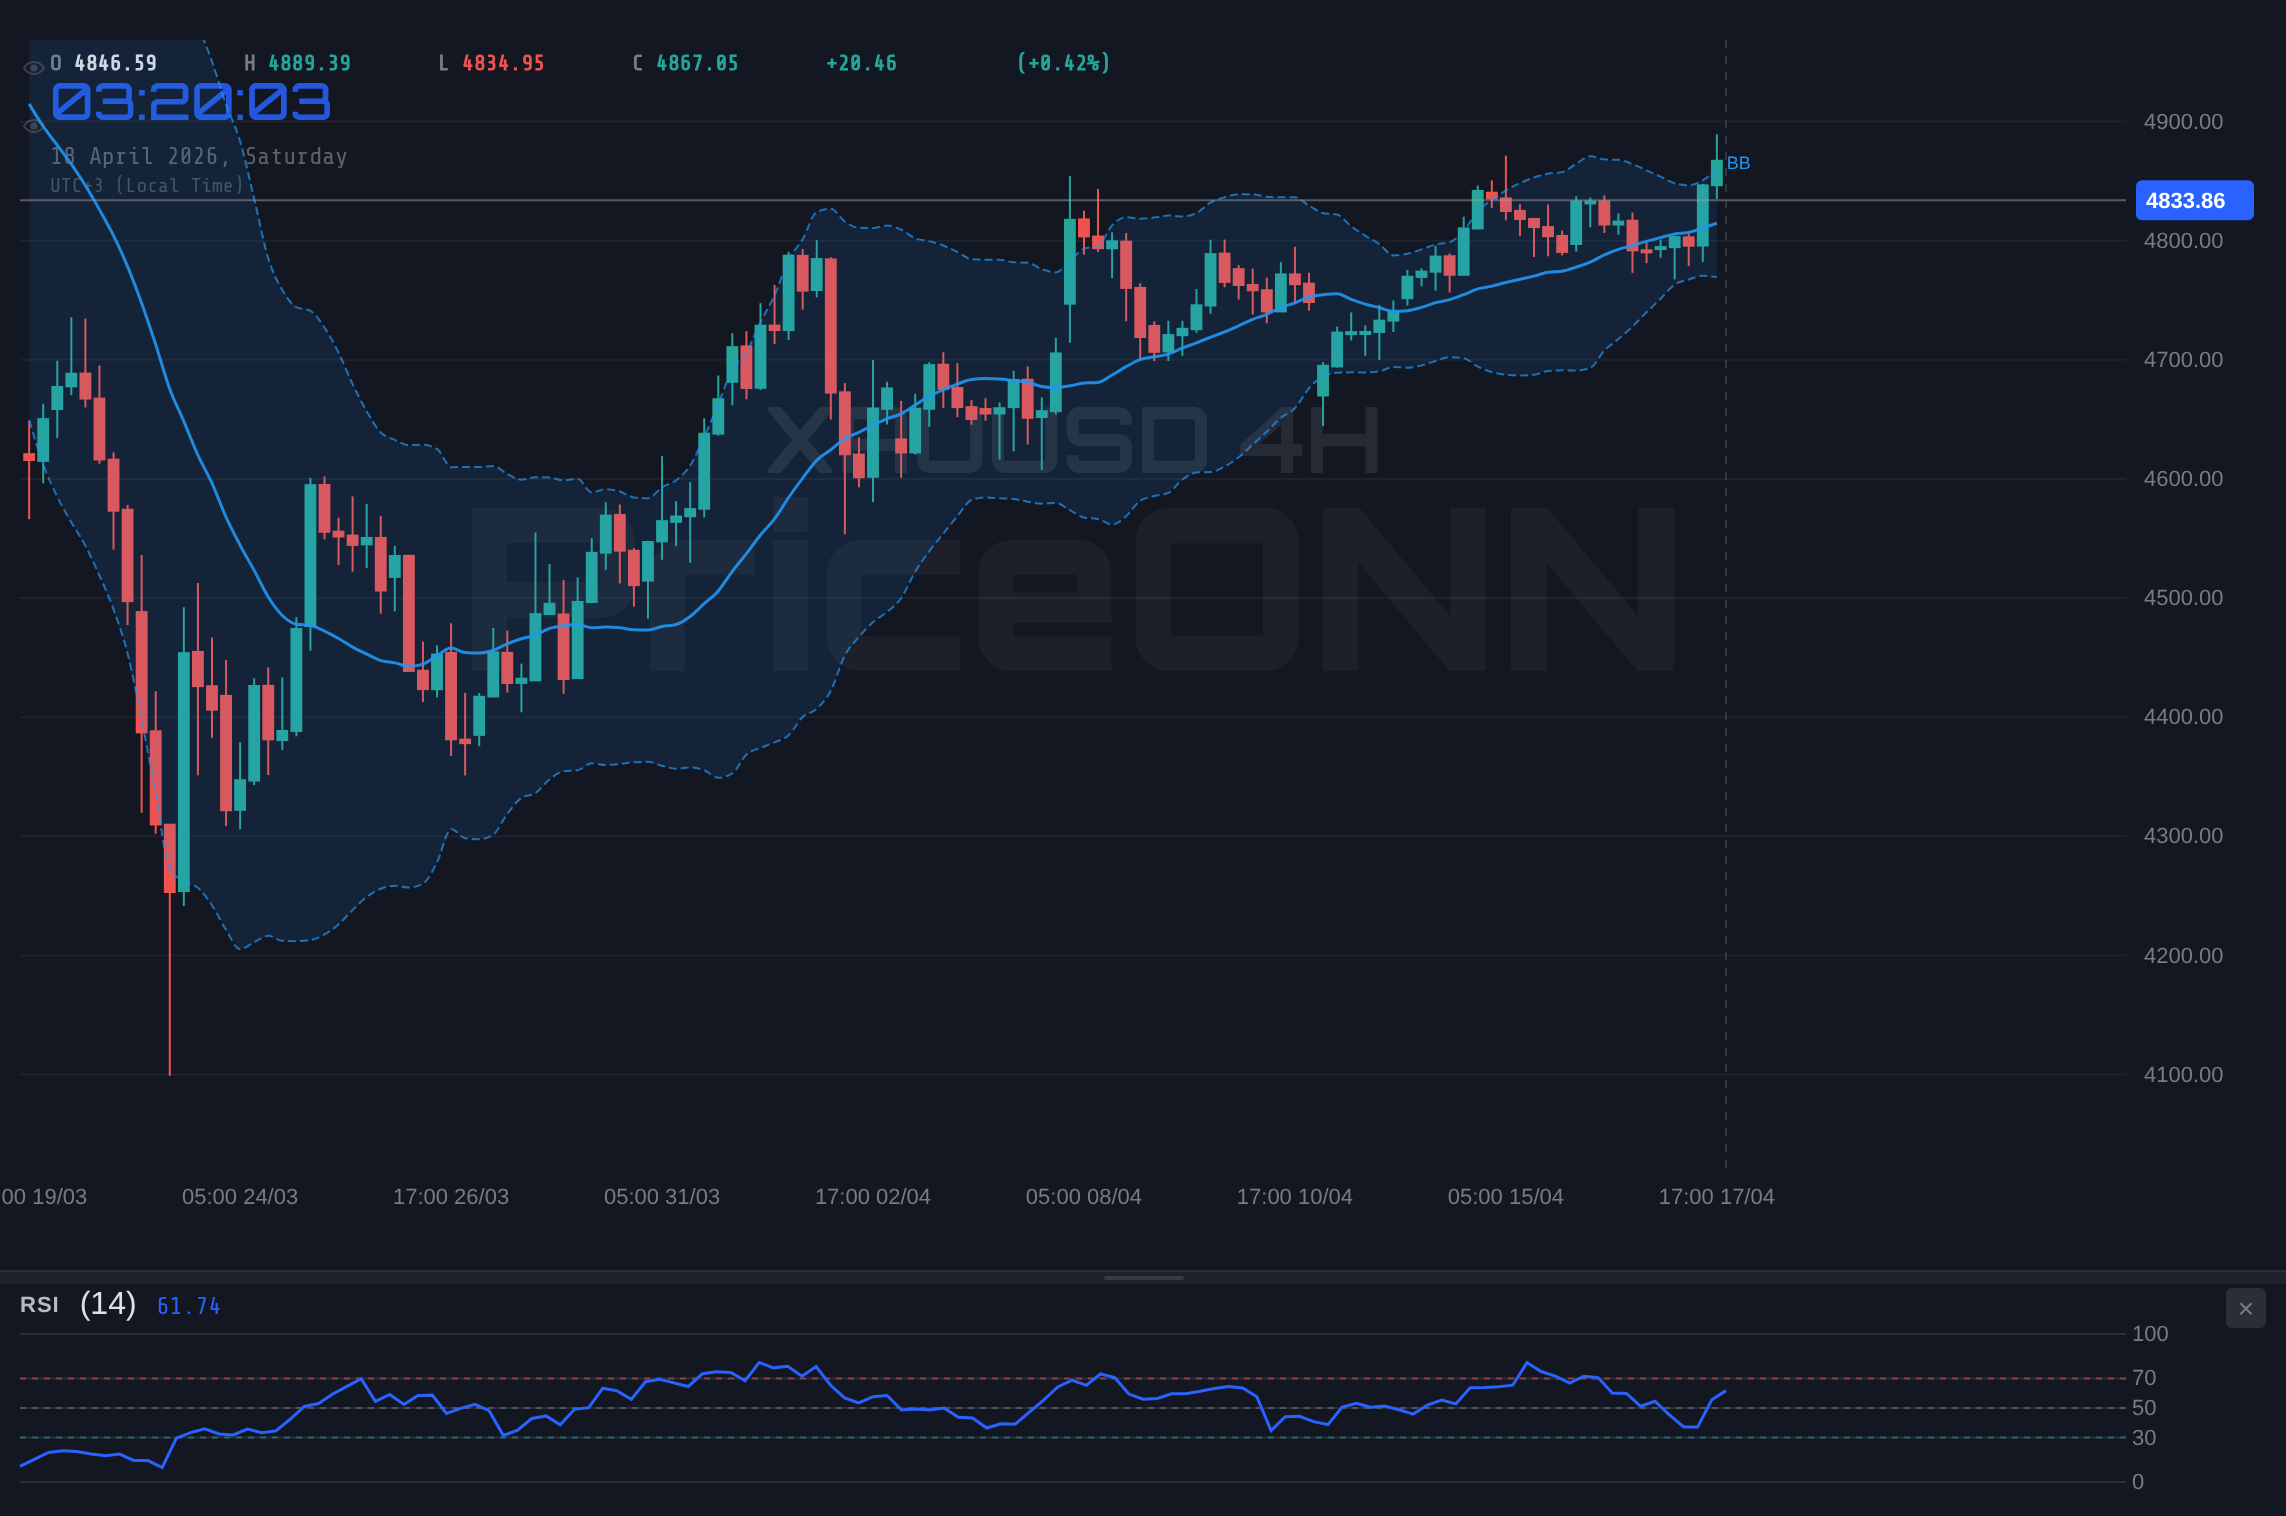
The daily chart, however, brings us back to a 'Neutral' trend with 50% strength, highlighting the indecision present at these elevated price levels. Support is found at $4,763, $4,735.45, and $4,697.96, while resistance is confirmed at $4,828.04, $4,865.53, and $4,893.08. The RSI(14) at 53.91 is firmly in neutral ground, with an upward inclination. MACD mirrors the 1-hour chart with positive momentum and the MACD line above the signal line. The Stochastic oscillator (K=75.02, D=77.9) is now showing a bearish signal (%K
Geopolitical Undercurrents and Macroeconomic Crosscurrents
The price action in gold cannot be viewed in isolation. Last week saw significant geopolitical developments, including reports of Iran potentially reopening the Strait of Hormuz. This news, according to some market commentary, initially provided a boost to gold prices by easing immediate oil supply fears, allowing a focus to shift back towards broader macroeconomic trends. However, the situation remains fluid, and any escalation or de-escalation in Middle Eastern tensions can quickly impact gold's safe-haven appeal. The ongoing narrative surrounding potential US-Iran peace talks, as reported by various financial news outlets, adds another layer of complexity, creating uncertainty that often benefits gold.
From a macroeconomic standpoint, the US Dollar Index (DXY) is currently trading around 97.9, showing a slight downward movement for the day. Historically, a weaker dollar tends to be supportive of gold prices, as it makes the commodity cheaper for holders of other currencies. However, the correlation is not always direct, and other factors, such as inflation expectations and interest rate differentials, play a crucial role. The market is keenly watching for signals from central banks, particularly the Federal Reserve, regarding future monetary policy. While recent economic data has been mixed, any indication of persistent inflation or a change in the Fed's stance on interest rates could significantly influence gold's trajectory. The current data shows the USD Index 1H is in a 'BUY' signal (6, 2, 0) while 4H and 1D are 'SELL' signals (3, 5, 0 and 1, 7, 0 respectively), indicating a tug-of-war in the dollar's strength.
Equity markets, represented by the S&P 500 and Nasdaq 100, have shown resilience, closing higher on Friday. The S&P 500 is trading at 6572.87, up 0.74%, while the Nasdaq 100 is at 26682.75, up 1.45%. This suggests a generally positive risk appetite, which can sometimes detract from safe-haven assets like gold. However, the tech-heavy Nasdaq's strong performance, driven by AI enthusiasm and easing oil fears, might be a temporary phenomenon. If risk sentiment were to sour, we could see a rotation back into gold. The ADX for S&P 500 (1D) is 47.51 indicating a strong downtrend, while Nasdaq 100 (1D) has an ADX of 29.85, suggesting a strong uptrend. This divergence in major indices adds another layer of complexity to predicting safe-haven flows.
The Bullish Case: Breaking Through $4,877.63
For gold to embark on a sustained upward journey, bulls need to decisively break through the immediate resistance zone. The 1-hour chart highlights $4,865.55 and $4,872.84 as key hurdles. A confirmed close above $4,877.63 on the 1-hour timeframe, supported by strong volume and positive momentum across multiple timeframes, would signal a potential breakout. The trigger for this scenario would be the successful breach and hold of the $4,877.63 resistance level. If this occurs, the next logical target would be the psychological $4,900 level, followed by the more significant resistance at $4,934.22 as indicated on the 4-hour chart. Invalidation of this bullish thesis would occur if the price fails to hold above $4,841.39, suggesting the selling pressure is too strong.
Confirmation would ideally come from a confluence of factors: continued strength in the dollar's inverse correlation (i.e., a weakening DXY), easing geopolitical tensions that paradoxically boost safe-haven demand through reduced 'fear premium', or surprisingly dovish signals from the Federal Reserve. The RSI on the daily chart needs to climb decisively above 60, and the Stochastic oscillator must move out of its overbought territory and show a bullish crossover. The ADX, currently at 22.43 on the daily, would need to show sustained strength above 25 to confirm a robust trend continuation. The probability of this scenario unfolding in the short term, say within the next 24-48 hours, hinges heavily on breaking that $4,877.63 ceiling. Given the mixed signals and proximity to resistance, we assign this scenario a moderate probability.
Bullish Scenario: The Golden Breakout
35% ProbabilityBearish Scenario: Resistance Holds Firm
55% ProbabilityNeutral Scenario: Consolidation Around $4,834.08
10% ProbabilityThe Bearish Case: Retreat from $4,877.63
The bearish argument gains traction when observing the conflicting signals and the historical significance of the resistance levels. The Stochastic oscillator on the 1-hour and daily charts is flashing bearish signals, indicating potential exhaustion. If XAUUSD fails to decisively break above $4,877.63, we could see a rotation lower. The primary trigger for this scenario would be a rejection from the current resistance zone, followed by a break below the $4,841.39 support on the 1-hour chart. This would likely open the door for a test of the more significant 4-hour support at $4,803.12, and potentially further down to $4,759.83. The daily Stochastic nearing overbought territory, combined with a strong dollar (if DXY moves higher), could accelerate this move.
Confirmation of the bearish outlook would involve a daily close below the $4,763 support level. This would suggest a more significant correction is underway, potentially driven by improving risk appetite in equities or a shift in central bank rhetoric towards tighter monetary policy. The RSI would need to dip below 50, and the MACD histogram would ideally turn negative, confirming the shift in momentum. Given the current strong trend signals on longer timeframes (4H ADX at 20.46), a sharp reversal might be less probable than a gradual grind lower, but the confluence of bearish signals at resistance makes this scenario the most probable in the near term. The probability assigned reflects the immediate technical resistance and the potential for profit-taking after the recent rally.
The Neutral Scenario: Caught in the Crossfire
A neutral scenario, where gold consolidates or trades within a defined range, is also plausible, albeit less probable given the current strong trend signals on certain timeframes. This would typically occur if geopolitical tensions remain at a simmer rather than boiling over, and macroeconomic data provides no clear direction for central bank policy. In such a case, XAUUSD might oscillate between the immediate support at $4,841.39 and resistance at $4,877.63. The ADX values across different timeframes (1H: 27.71, 4H: 20.46, 1D: 22.43) suggest a trend is present, making a prolonged period of pure neutrality less likely unless conflicting signals completely paralyze market participants. This scenario would likely persist until a significant catalyst emerges, either from geopolitical events or major economic data releases.
The probability for this neutral range-bound scenario is lower because the underlying technical indicators, despite some conflicting signals, lean towards directional movement. However, it cannot be entirely dismissed. Market participants might adopt a 'wait-and-see' approach, especially ahead of significant economic events or geopolitical developments. If this scenario plays out, traders would focus on scalping the range, buying near support and selling near resistance, while keeping a close eye on the breakout levels that would signal the end of the consolidation. The lack of strong conviction from all indicators simultaneously contributes to the possibility, however slim, of a trading range.
| Indicator | Value | Signal (1H/4H/1D) | Interpretation |
|---|---|---|---|
| RSI (14) | 53.37 / 59.02 / 53.91 | Neutral / Neutral / Neutral | Suggests room for further movement but shows divergence in momentum signals. |
| MACD | Positive / Negative / Positive | Bullish / Bearish / Bullish | Conflicting momentum signals across timeframes require careful monitoring. |
| Stochastic | K=64.62, D=79.54 / K=64.4, D=44.28 / K=75.02, D=77.9 | Bearish / Bullish / Bearish | Frequent crossovers and readings near/in overbought territory suggest caution. |
| ADX | 27.71 / 20.46 / 22.43 | Strong Trend / Moderate Trend / Moderate Trend | Indicates a trend is present, but strength varies, suggesting potential for volatility. |
| Overall Signal | Mixed (Al: 6, Sat: 2, Nötr: 0) | Leans bullish but with significant conflicting signals at key resistance. | |
What's Next? Key Triggers to Watch
As we look towards the coming week, several key factors will dictate the direction of XAUUSD. The immediate focus remains on the $4,877.63 resistance level. A decisive break above this point, especially on increasing volume, would likely trigger a move towards $4,900 and potentially higher. Conversely, a failure to break this resistance and a subsequent move below $4,841.39 could signal a short-term reversal, targeting the $4,803.12 support. Market participants will be closely monitoring geopolitical developments, particularly any news related to the Strait of Hormuz and US-Iran diplomatic efforts. Any escalation could provide a boost to gold's safe-haven status, while significant de-escalation might dampen its appeal.
Economic data will also play a pivotal role. While the provided economic calendar data for the last few days and the upcoming week is sparse on high-impact USD events, any releases related to inflation, employment, or central bank commentary will be crucial. For instance, if upcoming data suggests sticky inflation, it could increase demand for gold as an inflation hedge. Conversely, data pointing to a slowing economy might strengthen the dollar and weigh on gold, depending on the market's interpretation regarding Fed policy. The correlation with the DXY will be paramount; a sustained move higher in the dollar index would likely create headwinds for gold, while a weakening dollar could provide the necessary tailwind for a bullish breakout. Traders should remain vigilant for confirmation signals across multiple timeframes before committing to positions.
Frequently Asked Questions: XAUUSD Analysis
What happens if XAUUSD breaks decisively above the $4,877.63 resistance level?
A confirmed break above $4,877.63, supported by rising volume, would likely trigger a bullish move targeting the $4,900 psychological level and potentially the 4-hour resistance at $4,934.22. This scenario is favored if geopolitical tensions ease paradoxically, or if the DXY weakens significantly.
Should I consider selling XAUUSD at current levels near $4,834.08 given the bearish Stochastic signal?
The bearish Stochastic signal at resistance warrants caution, but a sell decision should ideally wait for confirmation. Look for a rejection of the $4,877.63 level and a break below the $4,841.39 support before considering a short position, targeting $4,803.12.
Is the RSI at 53.91 on the daily chart a concern for the bullish trend in XAUUSD?
An RSI of 53.91 on the daily chart is considered neutral territory, indicating no immediate overbought or oversold condition. While it doesn't signal a reversal, it suggests that the upward momentum may be moderating, especially as price approaches resistance.
How will potential US-Iran peace talks affect XAUUSD's price around $4,834.08 this week?
Positive developments in US-Iran peace talks could reduce safe-haven demand for gold, potentially pressuring prices lower from current levels near $4,834.08. Conversely, any perceived instability might still support gold, making the market's reaction contingent on the perceived outcome and its impact on broader risk sentiment.
Technical Outlook Summary
| Indicator | Value | Signal | Interpretation |
|---|---|---|---|
| RSI (14) | 53.91 | Neutral | Suggests room for movement, slight upward bias on daily. |
| MACD Histogram | Positive | Bullish | Positive momentum indicated on daily chart. |
| Stochastic | K=75.02, D=77.9 | Bearish | Nearing overbought, bearish crossover suggests caution. |
| ADX | 22.43 | Moderate Trend | Confirms a trend is present, but not excessively strong. |
| Bollinger | Middle Band | Watch | Price is above middle band, indicating bullish bias. |
Track markets in real-time
AI-powered analysis, technical indicators and real-time price data.
Join Our Telegram Channel
Breaking market news, AI analysis and trading signals instantly.
Join Channel