

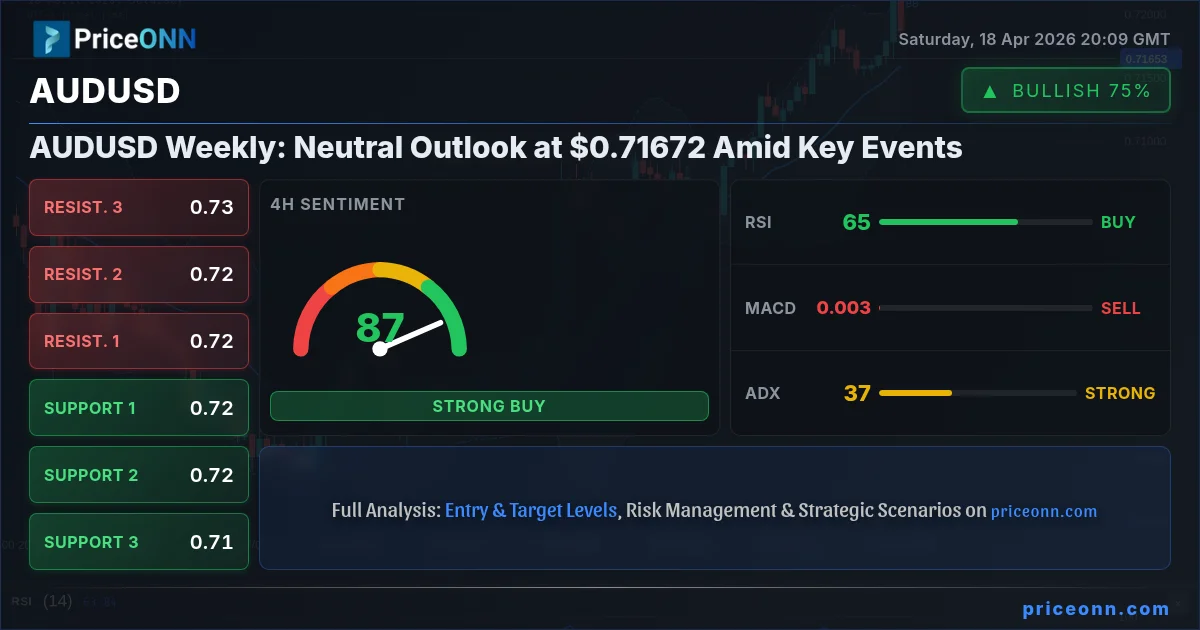
The Australian Dollar (AUDUSD) enters the new week trading near the $0.71672 mark, finding itself at a critical juncture where neutral sentiment prevails, yet significant volatility is on the horizon. Last week saw the pair experience a tug-of-war, reflecting a market caught between a potentially weakening US Dollar and the persistent influence of global risk sentiment. As traders brace for a pivotal week packed with crucial economic data releases from both the United States and Australia, the question isn't just where AUDUSD is heading, but what underlying forces will dictate its trajectory. This analysis delves into the competing narratives shaping the AUDUSD pair, examining the technical landscape, fundamental drivers, and the crucial economic events that traders will be scrutinizing to navigate this complex market.
- AUDUSD holds a neutral stance around $0.71672, with the 1-hour RSI at 46.22 suggesting bearish momentum despite a strong 4-hour trend.
- Key support levels are identified at $0.71656, $0.71590, and $0.71491, while resistance is eyed at $0.71821, $0.71920, and $0.71986.
- The ADX at 19.22 on the 1-hour chart indicates a weak trend, contrasting with stronger readings on longer timeframes, suggesting potential consolidation.
- Upcoming US Retail Sales and Australian inflation data releases are critical catalysts that could break the current AUDUSD stalemate.
The narrative for the Australian Dollar has been one of cautious optimism, often tethered to the broader risk appetite in global markets and the fluctuating strength of the US Dollar Index (DXY). Last week, AUDUSD oscillated, reflecting this delicate balance. While a strong jobs report from Australia initially fueled a rally, pushing the pair towards the 0.7200 level, subsequent concerns about consumer sentiment and the specter of rising inflation in the US introduced headwinds. The DXY itself showed signs of weakness early last week, dipping below 97.50, which typically provides a tailwind for riskier assets like the AUD. However, by the week's close, the DXY had stabilized around 97.90, demonstrating its resilience and ability to cap further upside for the Aussie. This push-and-pull between risk-on sentiment favoring the AUD and Dollar strength acting as a counterforce has left AUDUSD in a precarious neutral zone, with key technical levels acting as battlegrounds for bulls and bears.
Looking at the technical indicators, the picture is decidedly mixed across different timeframes, mirroring the broader market indecision. On the 1-hour chart, the Relative Strength Index (RSI) hovers at 46.22, indicating a slight bearish bias and suggesting that any upward momentum might be waning. This is further supported by the MACD, which shows negative momentum, and the Stochastic Oscillator, with the %K line below the %D line, signaling a potential pullback. The Average Directional Index (ADX) at 19.22 reinforces this, pointing to a weak prevailing trend on the short-term chart. However, a glance at the 4-hour timeframe paints a different story. Here, the RSI stands at a healthier 64.56, firmly in neutral-to-bullish territory, and the ADX at 36.71 signals a strong uptrend. The Stochastic Oscillator (%K > %D) also supports a bullish continuation. This divergence between the short-term and medium-term technicals highlights the current equilibrium – the longer-term trend might still hold promise, but immediate price action is showing signs of consolidation or a potential short-term reversal. This conflict in signals is precisely why traders are adopting a wait-and-see approach, awaiting clearer direction from upcoming fundamental catalysts.
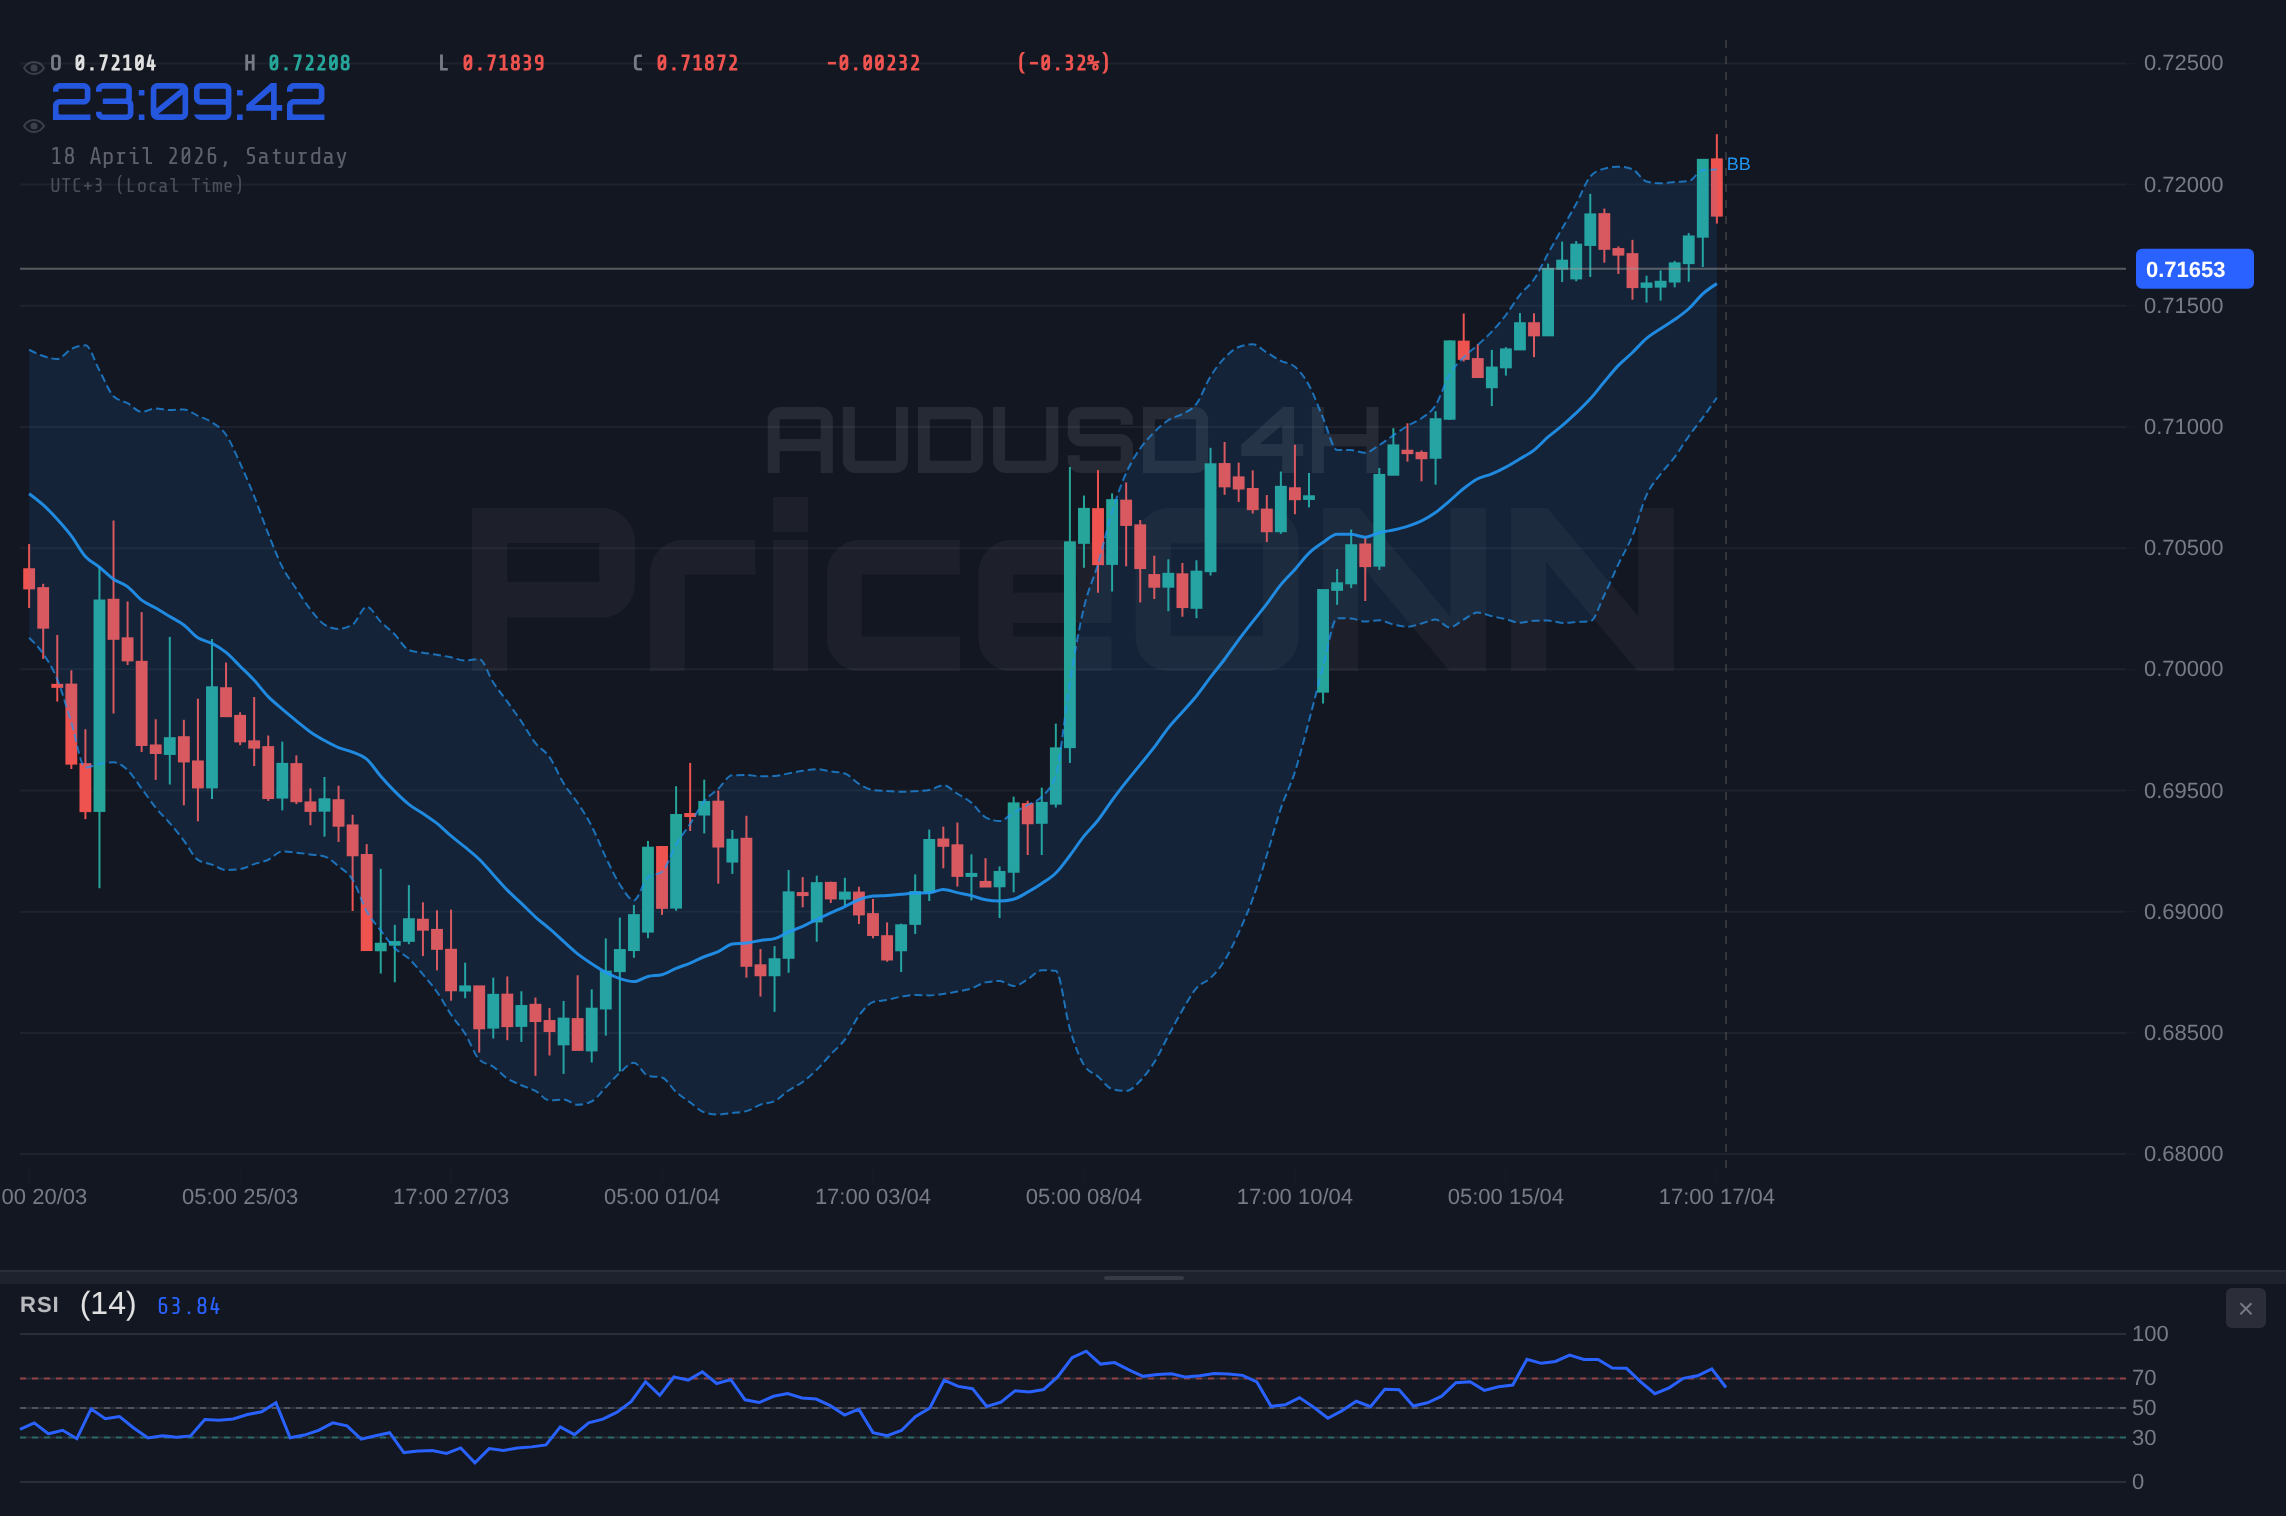
The fundamental backdrop for AUDUSD remains a complex interplay of domestic economic health and global macroeconomic trends. Australia's labor market has shown pockets of resilience, with recent job growth data exceeding expectations, providing a fundamental underpinning for the Australian Dollar. However, this domestic strength is increasingly being overshadowed by global concerns, particularly inflation and the path of monetary policy in major economies like the US. The Federal Reserve's stance on inflation and interest rates continues to be a dominant theme. While recent data might suggest inflation is cooling, the 'stickiness' of price pressures, especially in energy and services, keeps the possibility of further hawkish rhetoric or delayed rate cuts on the table. This uncertainty directly impacts the DXY; if the Fed signals a more prolonged period of higher rates, it could reignite Dollar strength, posing a significant challenge for AUDUSD. Conversely, any signs of a dovish pivot or a significant economic slowdown in the US would likely weaken the Dollar, creating an opportunity for the Australian Dollar to advance, especially if its domestic data remains supportive.
The correlation between AUDUSD and broader market sentiment, particularly equity markets like the S&P 500 and Nasdaq, cannot be overstated. Typically, a 'risk-on' environment, characterized by rising stock markets and increased investor confidence, benefits commodity-linked currencies like the Australian Dollar. Last week, the S&P 500 showed strength, closing near 6572.87, and the Nasdaq rallied to 26682.75. This generally positive risk appetite should, in theory, support AUDUSD. However, the relationship has shown signs of strain. The strong upward momentum in US equities, particularly the tech-heavy Nasdaq with its RSI nearing 86.86 on the 4-hour chart, also raises questions about sustainability and potential overheating. If US indices begin to falter, perhaps due to inflation fears or concerns about Fed policy, we could see a rapid shift to 'risk-off' sentiment. In such a scenario, AUDUSD would likely face significant downward pressure, not only from a potential flight to safety but also from a strengthening US Dollar acting as a safe-haven asset. The key for AUDUSD traders will be to monitor the correlation: does it move with risk assets, or does the DXY's influence dominate?
Let's delve deeper into the significance of the current support and resistance levels for AUDUSD, particularly from a multi-timeframe perspective. The immediate 1-hour chart presents support at $4853.47, $4848.68, and $4841.39, with resistance eyed at $4865.55, $4872.84, and $4877.63. These levels are crucial for short-term traders and indicate the immediate battleground. However, the more significant levels are found on the 4-hour chart: support at $4803.12, $4759.83, and $4737.57, and resistance at $4868.67, $4890.93, and $4934.22. The daily chart further solidifies these, with support at $4763, $4735.45, and $4697.96, and resistance at $4828.04, $4865.53, and $4893.08. The fact that the current price of $0.71672 is hovering just below the 1-hour resistance and above the daily support zone highlights the tight range and the importance of these lines. A decisive break above the 4-hour resistance at $4868.67, confirmed by strong volume and positive divergence in oscillators, could signal a move towards $4900. Conversely, a failure to hold the daily support around $4735-$4763 could precipitate a sharper decline, potentially testing levels closer to $4697.
The upcoming economic calendar presents a potent cocktail of events that could significantly disrupt the current neutral stance of AUDUSD. On the US side, the Retail Sales figures, due Tuesday, are particularly crucial. After a period of elevated inflation, analysts are closely watching whether consumer spending shows resilience. A stronger-than-expected report could bolster the case for a Fed that remains hawkish or delays rate cuts, strengthening the USD and pressuring AUDUSD. Conversely, a disappointing figure might signal a consumer struggling under inflationary pressures, potentially leading to a reassessment of Fed policy and a weaker Dollar. On the Australian front, inflation data, expected to show a rise, will be closely scrutinized. If inflation comes in hotter than forecasted, it could force the Reserve Bank of Australia (RBA) to adopt a more hawkish stance, potentially supporting the AUD. However, the RBA's reaction function is also influenced by the global outlook and domestic growth concerns, creating a complex decision-making environment. The interplay between these domestic and international data points will be key in determining the direction of AUDUSD in the coming days.
Let's examine the correlation with other major markets to gain a more comprehensive perspective. The US Dollar Index (DXY), currently trading around 97.90, often exhibits an inverse relationship with AUDUSD. Last week, the DXY's dip provided some relief for the Aussie, but its ability to hold near the 98.00 mark suggests underlying strength. If geopolitical tensions escalate or US economic data continues to surprise to the upside, the DXY could easily reclaim higher ground, acting as a significant headwind for AUDUSD. Oil prices, represented by Brent crude at $92.54 and WTI at $86.42, also play a role. While not a direct driver for AUDUSD, significant moves in oil prices can influence inflation expectations globally and, by extension, central bank policy. A sharp rise in oil prices could fuel inflation concerns, potentially leading to tighter monetary policy expectations, which would typically support the USD and pressure AUDUSD. Conversely, a sharp drop in oil, as seen last week, could signal weakening global demand, a risk-off catalyst that would also challenge the Australian Dollar.
For the scalper, the focus is on the immediate 1-hour chart levels: $4853.47, $4848.68, and $4841.39 for support, and $4865.55, $4872.84, and $4877.63 for resistance. The weak ADX of 19.22 suggests that range trading or quick entries on minor reversals might be profitable, provided tight stop-losses are employed. The conflicting Stochastic signals (%K below %D but showing potential reversal) mean quick entries and exits are paramount. They will be watching for clear breaks of these short-term levels with increased volume, perhaps targeting moves of 15-20 pips. For swing traders, the 4-hour chart is more relevant, with the key support at $4803.12 and resistance at $4868.67. The stronger ADX of 36.71 on this timeframe suggests that a breakout, once it occurs, could be sustained. They will be looking for confirmation signals, perhaps a bullish RSI divergence on the 1-hour chart as price tests 4-hour support, or a bearish divergence as price approaches 4-hour resistance. The upcoming economic data will be crucial for triggering these moves. Long-term investors, however, will be more focused on the daily chart's confluence of support and resistance. Holding the daily support zone around $4735-$4763 is critical for maintaining the longer-term bullish narrative, while a decisive break above the daily resistance at $4828.04 could signal a more sustained upward move, potentially targeting the $4900 region. They will be less concerned with intraday fluctuations and more focused on the macroeconomic shifts and RBA/Fed policy divergences.
Historically, periods of neutral consolidation in AUDUSD, especially when punctuated by major data releases and central bank policy shifts, have often preceded significant directional moves. For instance, looking back at periods where the DXY was consolidating around similar levels (e.g., late 2023), AUDUSD often experienced choppy price action. However, the eventual breakout from these consolidation phases was typically triggered by a clear shift in interest rate expectations or a significant divergence in economic performance between the US and Australia. The current setup, with mixed technical signals and a heavily anticipated economic calendar, echoes these historical precedents. The key difference now might be the elevated inflation readings globally and the corresponding central bank responses. The market is highly sensitive to any deviation from expected inflation or monetary policy paths. Therefore, the current neutral phase could be a prelude to a more substantial move, driven by how the upcoming data forces a re-pricing of these expectations. Traders who understand these historical patterns are better positioned to anticipate the potential magnitude and direction of the eventual breakout.
The bullish case for AUDUSD hinges on a confluence of factors: continued resilience in the Australian labor market, a potential slowdown in US inflation prompting a less hawkish Fed stance, and a sustained 'risk-on' sentiment in global markets. If US Retail Sales disappoint significantly, and Australian inflation proves to be stickier than expected, the RBA might be forced into a hawkish posture, while the Fed could be pushed towards earlier rate cuts. This scenario would likely see the DXY weaken, potentially falling below 97.50 and targeting 97.00. In such an environment, AUDUSD could break decisively above the 4-hour resistance at $4868.67, with eyes then set on the $4900-$4934 resistance zone. The daily RSI, currently at 53.91, would need to climb above 60 to confirm strengthening bullish momentum, and the MACD would need to show sustained positive divergence. For this scenario to play out, we would also need to see US equity markets continue their upward trajectory, perhaps with the Nasdaq pushing towards new all-time highs, reinforcing the risk-on appetite.
Conversely, the bearish case for AUDUSD is built upon the foundation of persistent US inflation, a resilient US Dollar, and a potential deterioration in global risk sentiment. If US inflation data comes in hotter than expected, or if the Fed signals a higher-for-longer interest rate narrative, the DXY could surge, potentially targeting levels above 98.00 and even challenging the 98.50-99.00 range. This would put significant downward pressure on AUDUSD. Furthermore, any signs of weakness in Australian domestic data, such as a drop in consumer confidence or a significant slowdown in job creation, could exacerbate the decline. Technically, a break below the 1-hour support at $4841.39, followed by a decisive close below the 4-hour support at $4803.12, would invalidate the short-term bullish structure and open the door for a move towards the $4759-$4737 support zone. The daily chart's ADX, currently at 22.43, indicates a downtrend could gain traction if these levels are breached. A sell-off in global equities would further amplify this bearish sentiment, leading to a flight to safety, likely benefiting the USD.
Given the conflicting signals across timeframes and the pivotal nature of the upcoming economic data, a neutral scenario is also highly plausible in the short term. This could manifest as AUDUSD consolidating within its established range, perhaps between the 1-hour resistance at $4865.55 and the 4-hour support at $4803.12. In this scenario, volatility might spike around data releases, leading to sharp but ultimately temporary price swings, often referred to as 'stop hunts' or 'liquidity grabs' as algorithms trigger orders on either side of key levels. The ADX readings across timeframes (19.22 on 1H, 36.71 on 4H, 22.43 on 1D) illustrate this tension: a weak trend on the short-term, a strong trend on the medium-term, and a moderate trend on the daily. This suggests that while longer-term momentum might exist, the immediate path is likely to be range-bound until a clear catalyst emerges. Traders might employ range-trading strategies, buying near support and selling near resistance, but with extremely tight stops to mitigate the risk of a sudden breakout driven by unexpected news.
The market structure for AUDUSD presents a fascinating case study in indecision. The fact that the pair has been unable to decisively break either key support or resistance levels suggests a lack of strong conviction from major market participants. This could be due to a variety of factors: institutions might be waiting for clearer signals from central banks, hedging their positions ahead of data releases, or simply waiting for price to reach more attractive levels for entry. Options market data, if available, could offer clues. For instance, a high concentration of open interest at specific strike prices around the current levels could indicate areas of significant 'gamma pinning,' where market makers are forced to buy or sell to remain delta-neutral, potentially capping price movement. Similarly, futures positioning data (like COT reports) could reveal whether large speculators are building net long or short positions, indicating their underlying bias. Without this granular data, we rely on price action and technical indicators, which, as we've seen, are currently sending mixed messages, reflecting this underlying market indecision.
The upcoming week is critical for AUDUSD, and the direction will likely be dictated by the US Retail Sales data and Australian inflation figures. If US data disappoints and inflation remains elevated, the Fed's hawkish stance could be reinforced, leading to a stronger dollar and potentially pushing AUDUSD lower towards the $0.7100-$0.7050 range. Conversely, if US inflation shows signs of cooling and Australian data supports a more hawkish RBA, AUDUSD could break higher, targeting the $0.7200-$0.7250 area. The current neutral setup, with support at $0.71656 and resistance at $0.71821 on the 1-hour chart, suggests that these levels will be the immediate focus. A break above $0.71821, confirmed by strong volume and positive momentum indicators, could initiate the bullish scenario. Failure to hold $0.71656 could trigger the bearish scenario. Traders should closely monitor the DXY's reaction to US data and the broader risk sentiment as primary guides.
Bearish Scenario: Dollar Strength and Sticky Inflation
65% ProbabilityNeutral Scenario: Range-Bound Consolidation
25% ProbabilityBullish Scenario: Softening US Data and Risk-On
10% ProbabilityFrequently Asked Questions: AUDUSD Analysis
What happens if AUDUSD breaks below the $0.71656 support level this week?
A break below $0.71656 on the 1-hour chart, especially if accompanied by negative US data or a hawkish Fed tone, would likely trigger further downside. This could lead to a test of the $0.71491 daily support, with a more significant move towards $0.70967 if momentum accelerates.
Is the RSI at 46.22 a sell signal for AUDUSD right now, given the 4-hour trend is bullish?
The 1-hour RSI at 46.22 does indicate bearish momentum on the short-term chart, suggesting caution for immediate long entries. However, it's not a definitive sell signal, especially with the 4-hour RSI at 64.56 showing a stronger uptrend. This divergence highlights the current neutral market; confirmation of a trend reversal would require sustained breaks of key intraday levels.
How will the upcoming US Retail Sales and Australian inflation data affect AUDUSD this week?
Stronger-than-expected US Retail Sales could pressure AUDUSD by reinforcing a hawkish Fed outlook, while hotter Australian inflation might support the Aussie if it prompts a hawkish RBA response. Conversely, weak US sales or cooling Australian inflation could trigger opposite moves, making these releases critical catalysts for breaking the current stalemate.
Should I consider buying AUDUSD at current levels of $0.71672 given the mixed technical signals?
Buying at current levels carries risk due to the mixed technical picture and upcoming data. A more prudent approach might be to wait for confirmation: either a clear break above the 1-hour resistance at $0.71821 with bullish momentum, or a bounce from the 4-hour support near $0.71364. Risk management, including tight stop-losses, is essential.
The path forward for AUDUSD is intricately linked to the data flow and the market's interpretation of central bank responses. While the technicals present a mixed picture, suggesting consolidation, the fundamental catalysts on the horizon have the potential to inject significant volatility and direction. Traders should remain vigilant, paying close attention to the correlation between AUDUSD, the DXY, equity markets, and oil prices. Patience is key; waiting for a clear breakout above resistance or a confirmed breakdown below support, validated by strong momentum and fundamental catalysts, will likely offer the highest probability setups. Remember, in trading, managing risk and waiting for the right opportunity are paramount.
Track markets in real-time
AI-powered analysis, technical indicators and real-time price data.
Join Our Telegram Channel
Breaking market news, AI analysis and trading signals instantly.
Join Channel