

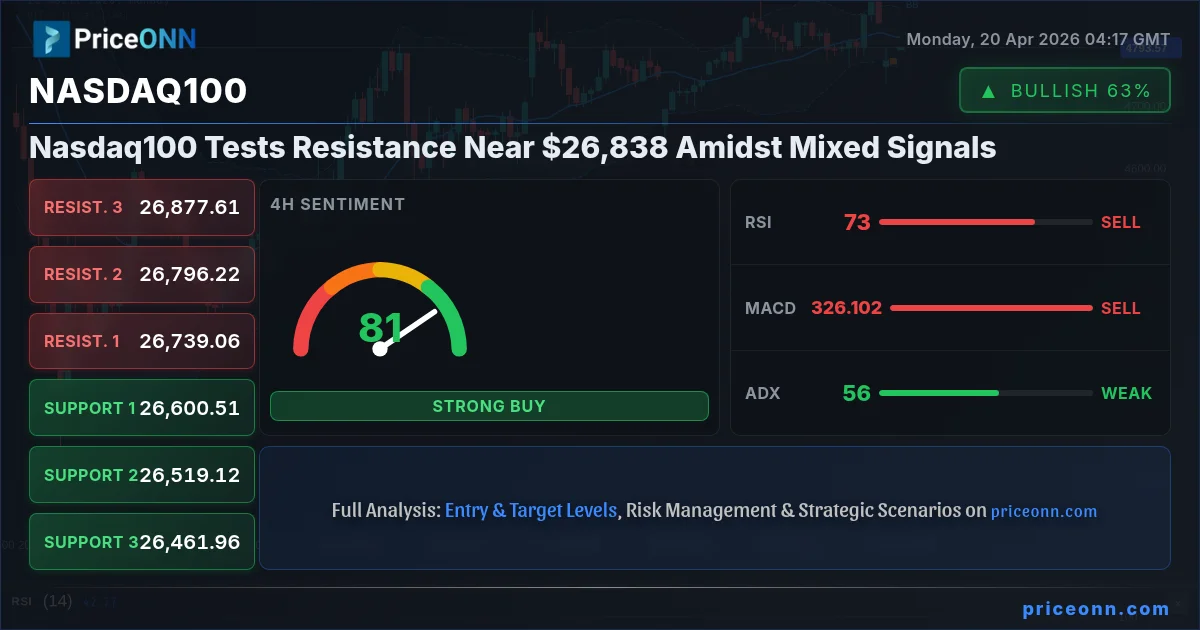
The Nasdaq100, currently trading at $26,519.62, finds itself at a critical juncture. After a recent push higher, the index is approaching a significant resistance zone around $26,838. This technical standoff creates a compelling scenario for traders, as conflicting signals from various indicators paint a nuanced picture of the market's immediate future. Understanding the interplay between the current price action, the underlying technical indicators, and broader market correlations is paramount for navigating this period of potential consolidation or a renewed directional move.
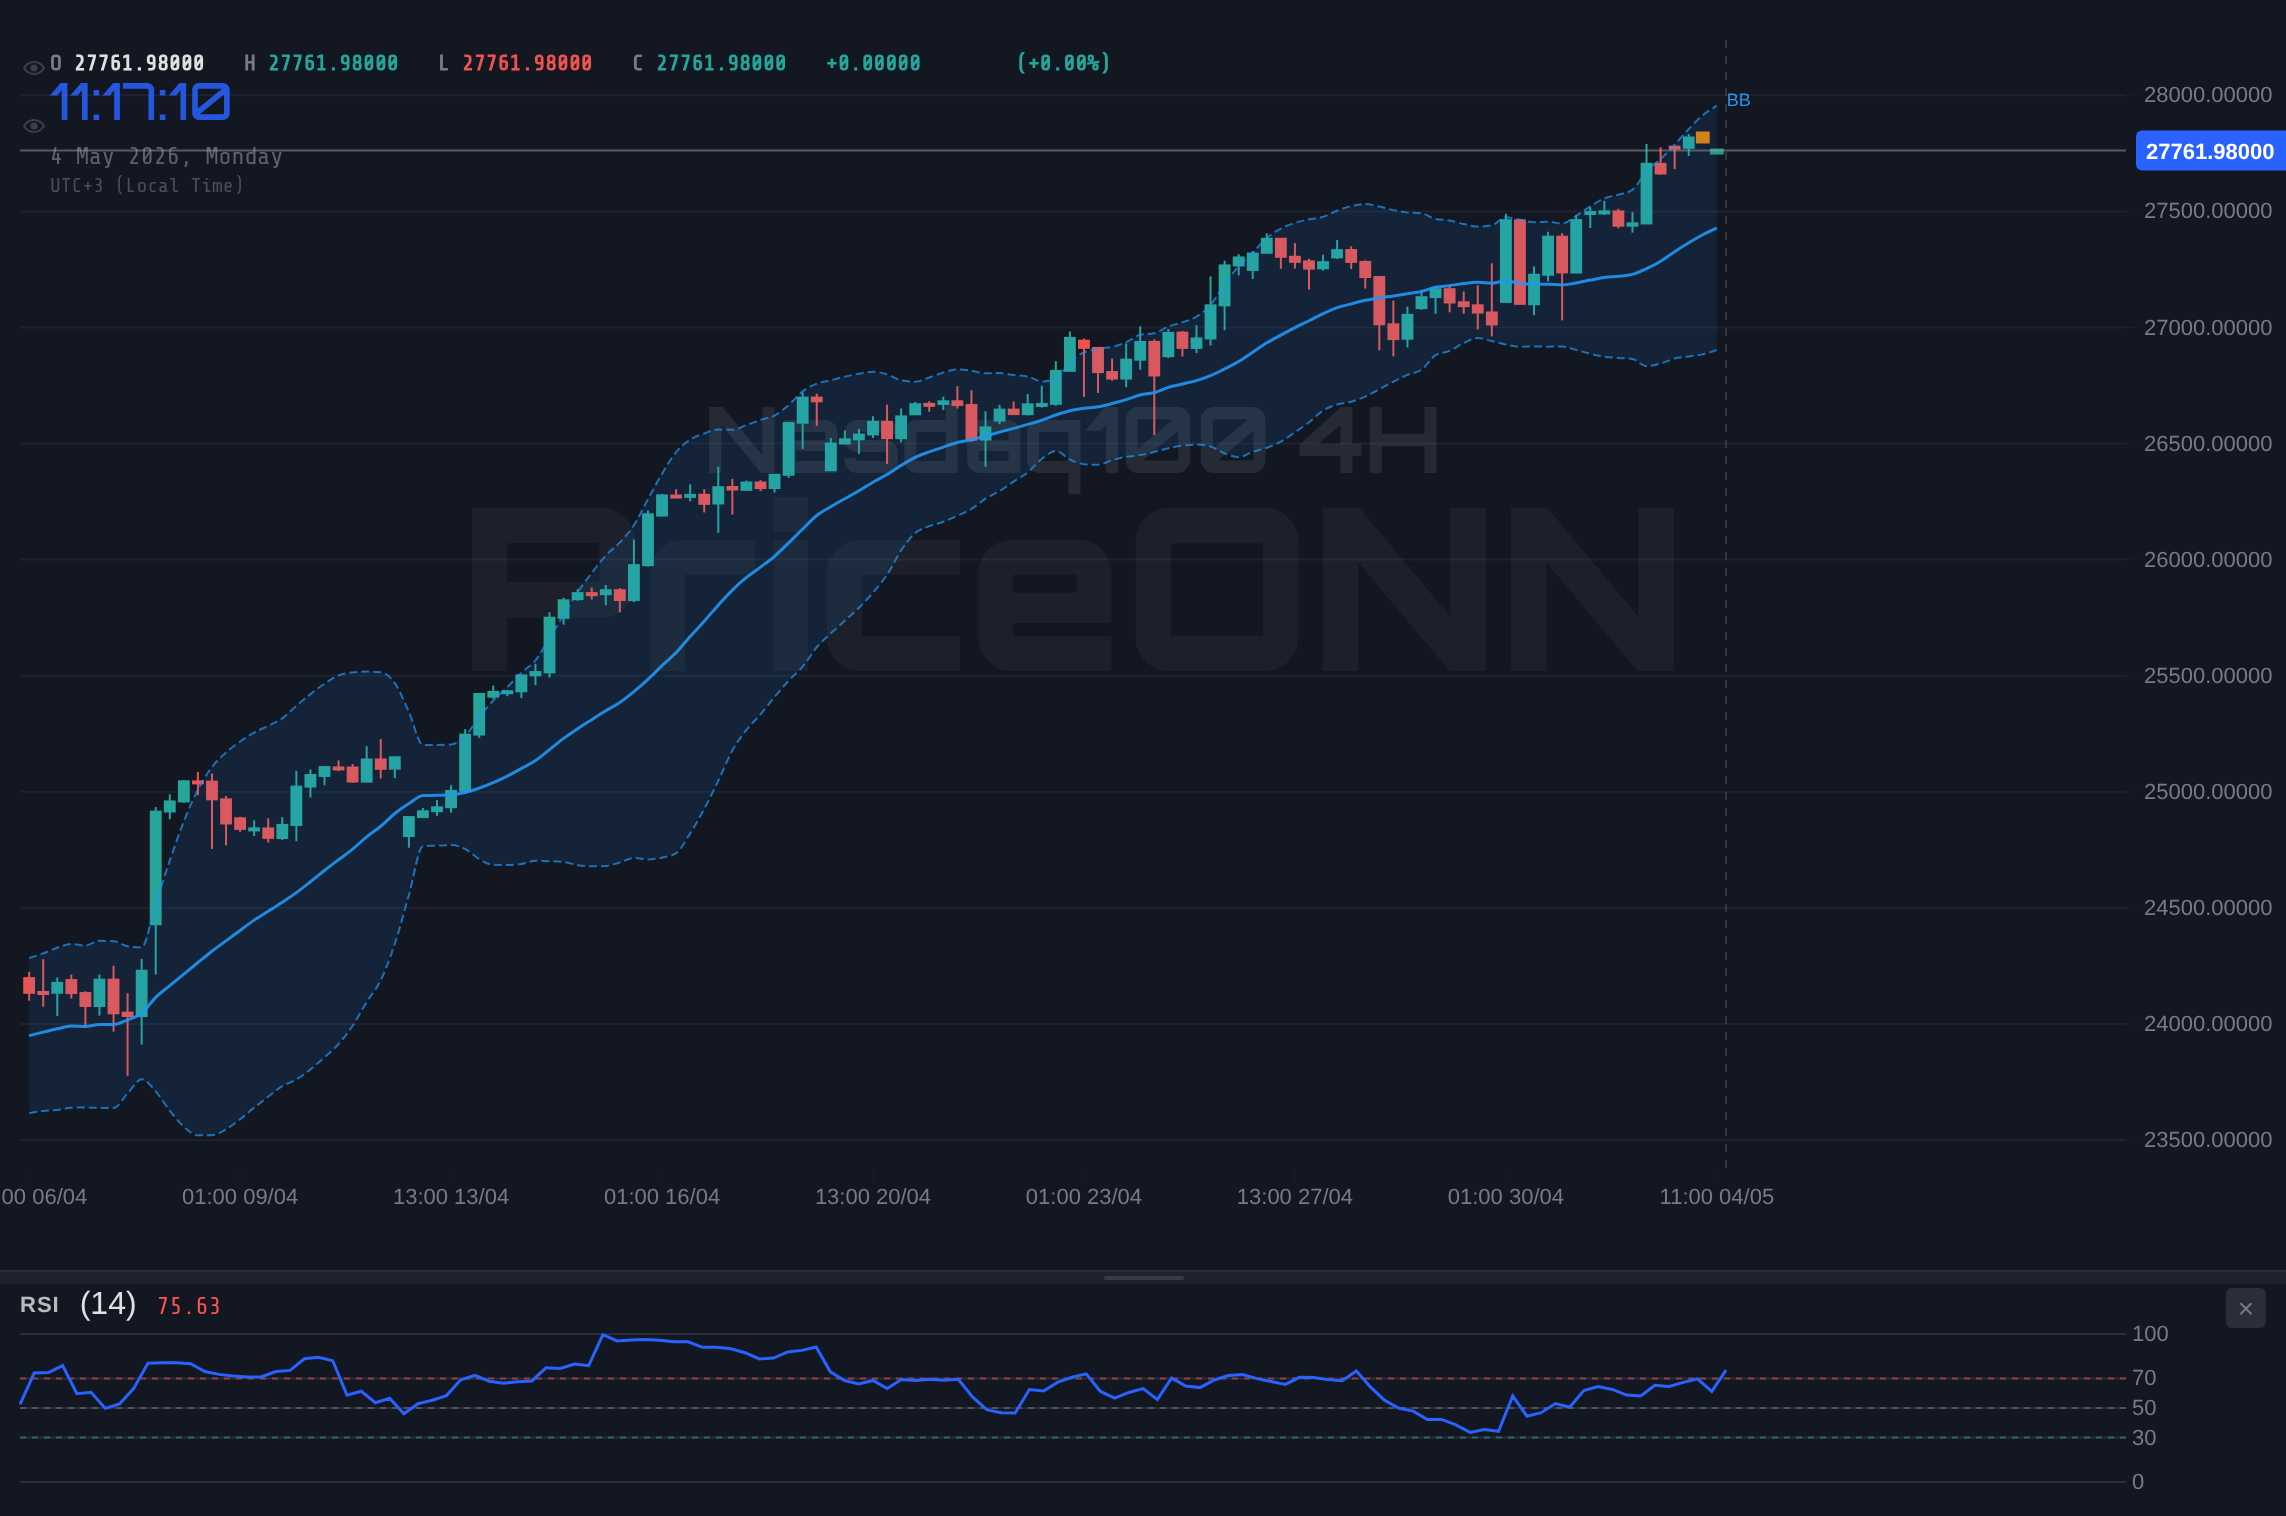
- The Nasdaq100 is trading at $26,519.62, approaching the $26,838 resistance level.
- RSI at 62.83 on the 4H chart suggests bullish momentum, but the 1H RSI at 53.39 indicates a potential slowdown.
- The ADX reading of 55.61 on the 4H chart points to a very strong uptrend, but the 1H ADX at 26.66 suggests a weakening trend in the shorter term.
- DXY at 98 shows a strengthening dollar, which historically can weigh on tech-heavy indices like the Nasdaq100.
Navigating the $26,838 Resistance Barrier
The Immediate Technical Landscape
The Nasdaq100's ascent has brought it to the doorstep of a key resistance level near $26,838. On the 1-hour chart, the trend is technically bullish with a power score of 83%, but the RSI(14) at 53.39 indicates a neutral leaning, suggesting that the momentum driving the price higher is not as robust as it once was. This is further echoed by the MACD, which shows negative momentum with the MACD line below its signal line, hinting at potential selling pressure building. The ADX at 26.66 also points towards a strong downtrend on the 1H, which is somewhat contradictory to the overall bullish trend on higher timeframes. This divergence on the shorter timeframe suggests that while the longer-term trend might still be intact, the immediate path higher could face significant headwinds. The Stochastic oscillator, with K at 47.19 and D at 48.4, is also hovering near the neutral zone, further emphasizing the indecision in the short term. Traders are watching closely to see if this level will act as a ceiling, leading to a pullback, or if a decisive break will signal further upside potential.Four-Hour Chart: A Stronger Bullish Picture?
Shifting to the 4-hour timeframe, the technical picture for the Nasdaq100 becomes more constructive, albeit with its own set of cautionary signals. The trend is firmly bullish, boasting a power score of 100%. The RSI(14) is reading 62.83, which, while not yet in overbought territory, indicates a healthy upward momentum. However, the Stochastic oscillator is flashing an overbought signal, with K at 85.67 and D at 88.97. This suggests that the market might be getting ahead of itself on this timeframe, and a period of consolidation or a minor pullback could be on the cards. The MACD remains in positive momentum territory, with the MACD line above its signal line, supporting the bullish narrative. What truly stands out on the 4H chart is the ADX value of 55.61. This signifies an extremely strong trend, indicating that the current upward move has considerable conviction behind it. Such strong trend readings often suggest that pullbacks are likely to be shallow and that the underlying trend is robust enough to absorb some profit-taking. The Bollinger Bands are positioned above the middle band, reinforcing the bullish sentiment on this timeframe.Daily Chart Perspective: Long-Term Trend Under Scrutiny
On the daily chart, the Nasdaq100 exhibits a neutral trend with a power score of 50%, presenting a more complex outlook. The RSI(14) is sitting at 45.35, suggesting room for upside before reaching overbought conditions, and showing a slight upward eğilimi. The MACD, however, is below its signal line with negative momentum, a bearish signal that contradicts the bullish sentiment seen on the 4H chart. The Bollinger Bands are below the middle band, indicating a bearish bias on the daily timeframe. The Stochastic oscillator, with K at 42.97 and D at 29.88, shows a bullish signal as K is above D and rising from oversold territory, hinting at a potential reversal. Yet, the ADX at 47.51 signals a strong downtrend, reinforcing the caution advised by the MACD and Bollinger Bands. This confluence of conflicting signals on the daily chart suggests that while shorter-term moves might favor bulls, the longer-term trend is not yet decisively established, and significant resistance lies ahead. The index needs to convincingly break above key daily resistance levels to shift the long-term bias back to bullish.Macroeconomic Crosscurrents and Correlation Dynamics
The Dollar's Influence: DXY at 98
The DXY (Dollar Index) is currently trading at 98, showing a slight daily increase of 0.11%. This level is significant as a strengthening dollar often correlates inversely with risk assets, including major indices like the Nasdaq100. A higher DXY can make US equities more expensive for foreign investors, potentially dampening demand. The RSI(14) for the DXY on the 1H chart is 59.91, indicating a bullish trend that is gaining momentum. On the 4H, the RSI is 51.58, still in bullish territory, while the daily RSI at 42.22 suggests room for further dollar appreciation before hitting overbought conditions. The MACD for the DXY is positive on the 1H and 4H charts, supporting the bullish dollar outlook. This persistent strength in the dollar poses a potential headwind for the Nasdaq100's advance, especially as it approaches key resistance levels. Traders must monitor the DXY's trajectory; a continued rise could easily cap any further upside in the Nasdaq100.Equity Market Interplay: SP500 and Nasdaq100
The relationship between the Nasdaq100 and other major US equity indices, such as the SP500 and Dow Jones, provides crucial context. The SP500 is currently trading at $6,572.87, up 0.74% on the day, indicating a generally positive risk appetite in the broader market. However, the RSI(14) on the SP500's 1H chart is 70.95, nearing overbought territory and suggesting potential for a short-term pullback. The 4H RSI at 62.83 is still in bullish territory. The ADX for the SP500 on the 1H is a strong 49.72, confirming a powerful uptrend, while the 4H ADX at 24.23 shows moderate trend strength. The Nasdaq100's price action at $26,519.62 is somewhat divergent from the SP500's daily move, as the Nasdaq100 experienced a slight decline of 0.61% on the day to $26,519.62. This divergence warrants attention; the tech-heavy Nasdaq100 might be showing signs of weakness relative to the broader market, especially as it approaches its own resistance. The Dow Jones Industrial Average, at $49,072, is down 0.8%, further complicating the picture of overall market sentiment. This mixed performance across major indices suggests that while risk appetite hasn't completely evaporated, specific sectors or indices like the Nasdaq100 might be facing sector-specific headwinds or technical exhaustion.Oil Prices and Inflationary Pressures
Crude oil prices, represented by Brent at $96.53 and WTI at $90.12, have seen a significant surge of over 4% in the last 24 hours. This sharp rise in oil prices has immediate implications for inflation expectations and, consequently, for central bank policy. Higher energy costs can fuel broader inflation, potentially forcing central banks to maintain a more hawkish stance on interest rates. The RSI(14) for Brent on the 1H chart is 54.62, indicating upward momentum, while the 4H RSI at 48.04 and daily RSI at 48.35 suggest that the rally might be facing resistance or that the trend is not yet firmly established on longer timeframes. For the Nasdaq100, a sustained rise in oil prices could translate into increased inflation concerns, which might indirectly pressure growth stocks by reinforcing expectations of higher-for-longer interest rates. This dynamic adds another layer of complexity to the Nasdaq100's current technical picture, as the market must weigh the bullish implications of a strong equity trend against the bearish implications of rising commodity prices and potential policy tightening.Trading Scenarios for the Nasdaq100
The current technical setup for the Nasdaq100, characterized by its approach to significant resistance around $26,838 and conflicting signals across different timeframes, presents a classic scenario for a potential divergence or a battle between buyers and sellers. The strong uptrend indicated by the 4-hour ADX of 55.61 suggests that any dips might be short-lived, but the short-term bearish pressures on the 1-hour chart and the daily neutral trend cannot be ignored. The DXY at 98 adds a layer of complexity, potentially capping gains. Given these factors, three primary scenarios emerge:Bearish Scenario: Resistance Holds Firm
60% ProbabilityConsolidation Scenario: Range-Bound Play
25% ProbabilityBullish Scenario: Breakout Continuation
15% ProbabilityThe Importance of Risk Management
In any trading environment, especially one characterized by conflicting signals and key technical levels, robust risk management is not just advisable; it's essential. The ADX reading of 55.61 on the 4H chart suggests a strong trend, which can be profitable if traded correctly, but it also implies that reversals, when they occur, can be sharp. Therefore, employing stop-losses is critical. For a bearish scenario, a stop-loss above the $26,838 resistance would be prudent. Conversely, if a bullish breakout occurs, a stop-loss below the $26,569.34 level or even the $26,516.53 support could be considered. The neutral scenario implies a range-bound strategy, where traders might look to fade extremes, selling near the upper boundary and buying near the lower one, always with tight stops to protect against a breakout. The probability assigned to each scenario reflects the current technical confluence; however, market conditions can shift rapidly, making adaptability and strict adherence to risk parameters crucial for survival and success.The current technical setup presents a high degree of uncertainty. While the 4H trend strength is notable, the conflicting signals on shorter timeframes and approaching resistance levels warrant extreme caution. Any positions should be managed with tight stop-losses, and traders should be prepared for potential whipsaws as the market decides its next direction. The strength in oil prices and the DXY at 98 also add external pressures that could exacerbate volatility.
The Path Forward: Key Levels to Watch
As the Nasdaq100 navigates the $26,519.62 price point and eyes the $26,838 resistance, several key levels will dictate the short-to-medium term trajectory. On the upside, a decisive breach and hold above $26,838 would be a significant bullish signal, potentially opening the door to further targets at $26,994.52 and ultimately $27,269.36. These levels represent significant psychological and technical barriers that have historically acted as turning points. Conversely, failure to overcome $26,838 could lead to a retracement. Initial support can be found at $26,526.53 on the 1H chart, followed by stronger support levels at $26,516.53 and $26,461.96 on the 4H chart. A break below these levels would invalidate the bullish outlook and likely trigger further downside towards daily support zones, such as $26,407.08. The RSI on the 1H chart at 53.39 suggests there is still some room for upward movement before hitting overbought conditions, but the MACD's negative momentum is a warning sign. The ADX values across timeframes present a particularly interesting conflict: a very strong trend on the 4H (55.61) versus a weaker trend on the 1H (26.66). This suggests that the market is in a strong trend on a macro level, but short-term fluctuations are creating noise and indecision.The Role of Economic Data Releases
While the technical picture is complex, upcoming economic data releases will play a crucial role in shaping market sentiment and potentially breaking the current stalemate. Key US data points, such as Retail Sales and other high-impact releases, are on the horizon. For instance, if Retail Sales come in significantly above the forecast of 212 (previous 207), it could signal robust consumer spending, which might be interpreted positively for growth stocks, albeit with the caveat of potentially fueling inflation concerns. Conversely, weaker-than-expected data could dampen risk appetite, leading to a sell-off in growth assets like the Nasdaq100 and potentially boosting demand for safe havens. The DXY at 98, as previously noted, adds another layer of complexity: a strong dollar can be a headwind for US indices. Traders will be scrutinizing these economic releases for clues about the strength of the US economy and the potential trajectory of monetary policy. Any deviation from expectations could trigger a sharp move, potentially resolving the current indecision around the $26,838 resistance level. The RSI on the daily chart at 45.35 indicates room for upside, but a negative MACD and strong daily ADX of 47.51 suggest that any bullish move might face significant selling pressure.Correlation Analysis: DXY, Oil, and Equities
Understanding how different asset classes are moving in relation to each other is vital. The current DXY at 98, showing strength, typically exerts downward pressure on the Nasdaq100, especially when the index is testing resistance. The significant surge in oil prices (Brent at $96.53, WTI at $90.12) adds an inflationary element to the market. This could lead to concerns about sustained higher interest rates, which generally act as a drag on growth stocks. The mixed signals within the equity indices themselves – Nasdaq100 showing some weakness relative to the SP500's daily gains – further complicate the correlation analysis. The RSI on the Nasdaq100's 1H chart at 53.39 and its MACD showing negative momentum are key indicators to watch. If the DXY continues to strengthen and oil prices remain elevated, these factors combined could create a strong headwind against any Nasdaq100 breakout attempt above $26,838. Conversely, if economic data surprises to the upside and suggests a resilient economy without triggering aggressive inflation fears, the positive risk sentiment could override these concerns, allowing the Nasdaq100 to push higher.Given the conflicting signals and the critical resistance level at $26,838, patience is key. Avoid chasing the market. Look for clear confirmations: either a decisive break above resistance with sustained volume and positive MACD/bullish RSI on higher timeframes, or a clear breakdown below key support levels ($26,516.53) with bearish confirmation from indicators like a negative MACD crossover and falling ADX. The Stochastic on the 4H showing overbought conditions (K=85.67, D=88.97) suggests that a pullback is more probable than a breakout in the immediate short term.
Frequently Asked Questions: Nasdaq100 Analysis
What happens if Nasdaq100 fails to break above the $26,838 resistance level?
If the Nasdaq100 fails to decisively break above $26,838, a pullback is likely. The RSI on the 1H chart at 53.39 and negative MACD momentum suggest selling pressure could build. Immediate support would be tested at $26,526.53, with a close below $26,516.53 potentially signaling a move towards $26,461.96.
Should I trade Nasdaq100 at current levels of $26,519.62 given the mixed signals?
Trading at current levels of $26,519.62 requires caution due to mixed signals. The 4H ADX at 55.61 suggests a strong trend, but the 1H RSI at 53.39 and MACD momentum are less convincing. A high-probability setup would involve waiting for a clear break above $26,838 or a confirmed breakdown below $26,516.53, with appropriate risk management.
Is the RSI at 62.83 on the 4H chart a buy signal for Nasdaq100?
An RSI of 62.83 on the 4H chart indicates bullish momentum but is not an outright buy signal on its own. It suggests there is room for upside before hitting overbought territory. However, when considered alongside the Stochastic's overbought readings (K=85.67, D=88.97) and the MACD's positive momentum, it points towards a strong uptrend that might be nearing a short-term peak, warranting caution rather than an immediate buy.
How will the upcoming US Retail Sales data affect Nasdaq100 around the $26,838 resistance?
Stronger-than-expected US Retail Sales data (forecast 212) could boost risk appetite, potentially helping the Nasdaq100 break $26,838. However, it might also increase inflation concerns, strengthening the DXY at 98 and acting as a headwind. Conversely, weak data could dampen sentiment, pushing the index lower towards support levels like $26,516.53.
Track markets in real-time
AI-powered analysis, technical indicators and real-time price data.
Join Our Telegram Channel
Breaking market news, AI analysis and trading signals instantly.
Join Channel