

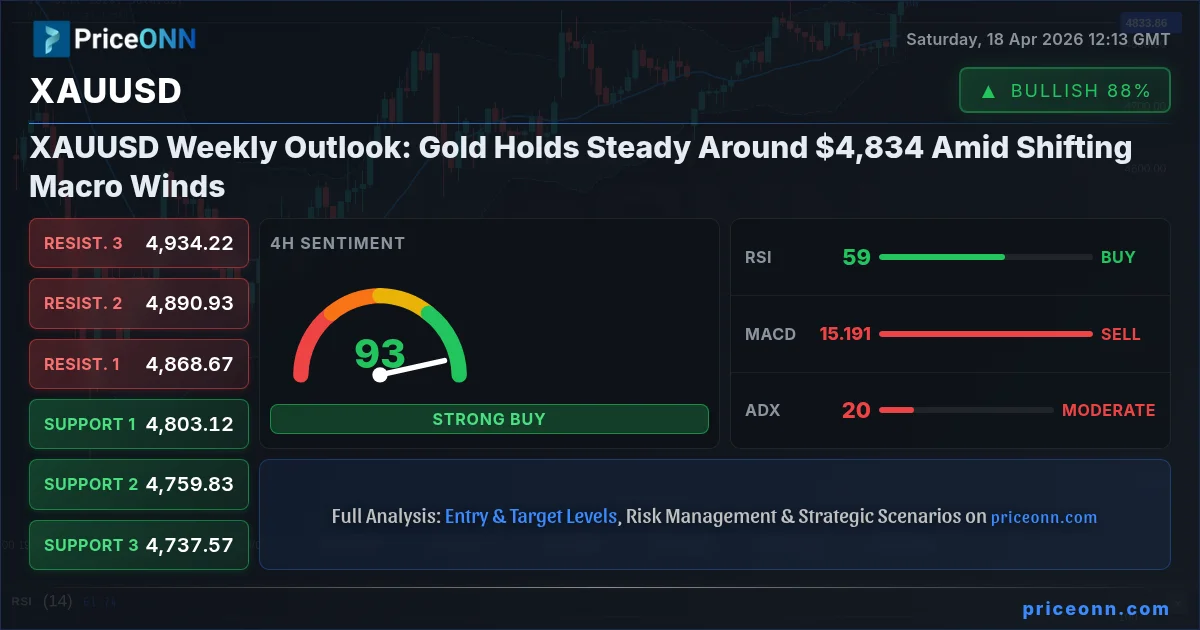
As we step into the weekend, the gold market (XAUUSD) finds itself consolidating in a narrow range, last seen trading around the $4,834.08 mark. This period of relative calm follows a week marked by significant geopolitical undercurrents and shifting macroeconomic expectations. The current price action suggests a market holding its breath, awaiting clearer direction from looming economic indicators and the evolving global risk landscape. While last week saw gold prices test both upward and downward extremes, the prevailing sentiment now is one of cautious observation, with traders and investors alike scrutinizing key levels and anticipating potential catalysts for the next significant move.
- RSI at 53.37 on the 1H chart signals a neutral momentum, but with an upward inclination, suggesting bulls are not entirely out of the picture.
- Critical support for XAUUSD sits at $4,763, a level that has not been breached on the daily chart, while resistance is forming around $4,893.08.
- MACD histogram indicates positive momentum on the 1H and 1D charts, but a diverging picture on the 4H chart warrants attention.
- The correlation with the DXY, currently trading around 97.9, remains a key factor, with dollar weakness typically supporting gold prices.
Navigating Geopolitical Crosscurrents and Macroeconomic Crosswinds
The Shifting Sands of Global Risk Sentiment
The past week has been a complex tapestry woven with threads of geopolitical tension and evolving central bank policy expectations. While the immediate crisis in the Middle East has seen some de-escalation, the underlying fragility remains a potent undercurrent in global markets. The reopening of the Strait of Hormuz, as reported by news outlets, provided a temporary reprieve, easing immediate fears of supply disruptions that had previously bolstered oil prices and, by extension, inflation expectations. This development, however, did little to fundamentally alter the broader risk appetite, which continues to be swayed by a multitude of factors, from ongoing regional conflicts to domestic economic data.
This delicate balance of geopolitical risk is a crucial backdrop for gold. As a traditional safe-haven asset, gold’s appeal often intensifies when global uncertainties rise. The price action around $4,834.08 suggests that while outright panic has subsided, the underlying demand for safety persists. Investors are closely watching for any signs of renewed escalation or significant shifts in diplomatic efforts, as these can quickly reignite demand for precious metals. The current price level reflects a market that is pricing in a degree of ongoing geopolitical risk, but is also sensitive to any indications of detente, which could lead to a pullback.
The Dollar's Dance and Its Impact on Gold
The U.S. Dollar Index (DXY), currently trading around 97.9, continues to play a pivotal role in the gold narrative. Historically, a weaker dollar tends to be a tailwind for gold prices, making the commodity cheaper for holders of other currencies and thus potentially increasing demand. Conversely, a strengthening dollar often exerts downward pressure on gold. This week, the DXY experienced some fluctuations, ending the week with a slight decline, which has provided a degree of support to gold around the $4,834 level. However, the DXY’s own trajectory is being influenced by a complex interplay of Fed policy expectations, U.S. economic data, and global risk sentiment.
Traders are paying close attention to the Federal Reserve's forward guidance. Any hints of a more hawkish stance - suggesting higher-for-longer interest rates - could bolster the dollar and put a lid on gold's upside. Conversely, signals of a pivot towards rate cuts, especially if driven by concerns about economic slowdown or persistent geopolitical risks, could weaken the dollar and provide a significant boost to gold. The interplay between these forces creates a dynamic environment where the dollar’s movement is not always a straightforward inverse correlation with gold, but its influence remains paramount.
Technical View: Decoding Gold's Current Stance
Short-Term Dynamics: A Neutral Treadmill
On the 1-hour timeframe, gold’s trend is currently described as neutral, with a power rating of 50%. This suggests a market in consolidation, lacking a strong directional conviction in the immediate term. The RSI(14) stands at 53.37, residing in neutral territory but exhibiting an upward inclination. This indicates that while buyers aren't overwhelming sellers, there's a slight bias towards upward momentum building. The MACD is showing positive momentum, with the MACD line above its signal line, further supporting this tentative bullish bias on the shortest timeframe. Bollinger Bands are also trading above the middle band, reinforcing the idea of upward pressure, though not a decisive trend.
However, a closer look at the Stochastic oscillator on the 1H chart reveals a potential divergence, with the %K line at 64.62 and the %D line at 79.54. This crossover, where %K falls below %D, signals a potential weakening of upward momentum and could foreshadow a short-term pullback or consolidation. The ADX at 27.71, while indicating a strong trend, doesn't specify direction in isolation and needs to be interpreted alongside other indicators. The confluence of these signals paints a picture of a market that is not trending strongly in either direction on the hourly chart, with immediate resistance found at $4,865.55 and support at $4,853.47. This suggests that short-term traders might be looking for range-bound opportunities or waiting for a clearer signal before committing.
The 4-Hour Chart: A Stronger Upward Lean
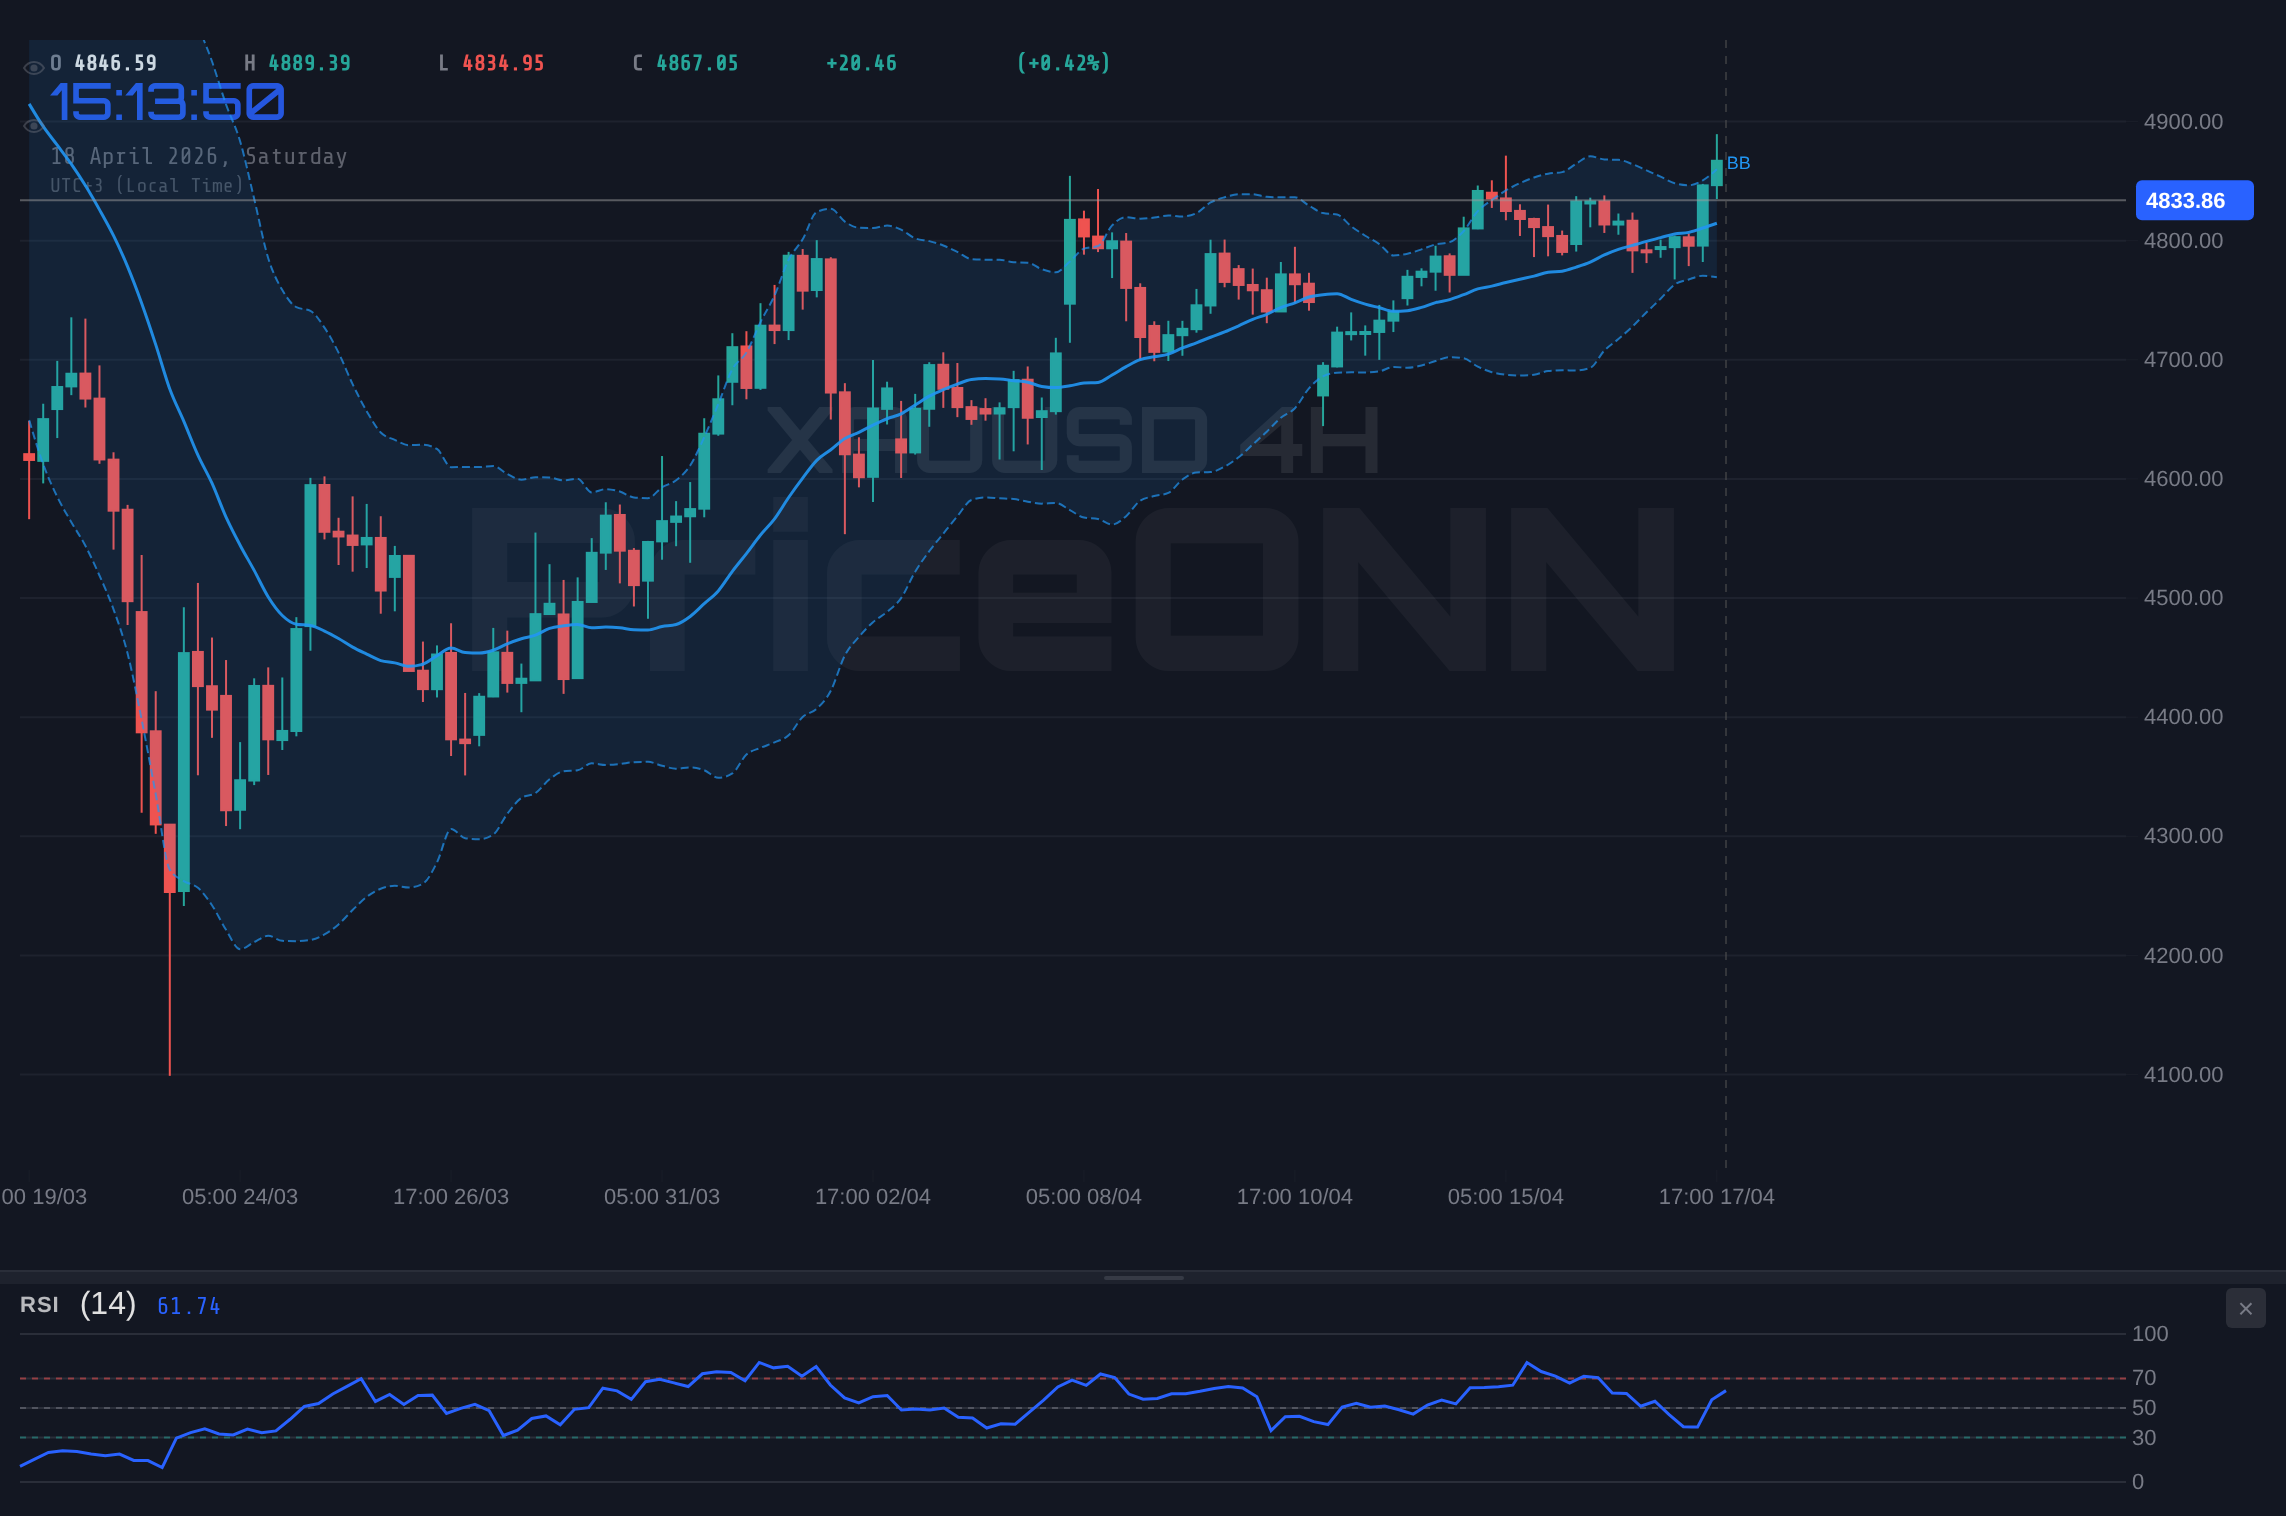
Shifting to the 4-hour timeframe, the picture becomes more decidedly bullish, with a trend strength of 95%. This longer timeframe suggests that the underlying momentum may be more robust. The RSI(14) here is at 59.02, still within neutral territory but showing a clearer upward trend. The MACD, however, presents a conflicting signal on this timeframe, showing negative momentum with the MACD line below its signal line. This divergence between the RSI and MACD warrants careful consideration, suggesting that the upward move might be losing steam or facing headwinds.
Bollinger Bands are again positioned above the middle band, indicating an upward bias. The Stochastic oscillator, with %K at 64.4 and %D at 44.28, shows a clear bullish signal (%K > %D), reinforcing the upward lean. The ADX at 20.46 suggests a moderately strong trend, which, when combined with the other indicators, leans towards a bullish outlook. The key support levels on this timeframe are $4,803.12, $4,759.83, and $4,737.57, while resistance is seen at $4,868.67, $4,890.93, and $4,934.22. The general signal here is AL (Buy), reflecting the stronger bullish undertone compared to the 1-hour chart, but the MACD's negative momentum is a caution flag for aggressive long positions.
Daily Timeframe: A Neutral Battleground with Underlying Strength
On the daily chart, gold reverts to a neutral trend with a power rating of 50%, mirroring the indecision seen on the hourly. The RSI(14) is at 53.91, again in neutral territory with a slight upward tendency. The MACD shows positive momentum, with the MACD line above its signal line, suggesting that the longer-term trend might still be oriented upwards, or at least not decisively bearish. Bollinger Bands are trading above the middle band, indicating a bias towards the upside on a daily closing basis.
The Stochastic oscillator, however, is flashing a potential warning sign here, with %K at 75.02 and %D at 77.9. This configuration, where %K is below %D in the upper range, suggests that the market may be approaching overbought conditions or is due for a pullback. The ADX at 22.43 indicates a moderately strong trend, but its directionality is less clear without other context. The daily support levels are identified at $4,763, $4,735.45, and $4,697.96, while resistance is observed at $4,828.04, $4,865.53, and $4,893.08. Despite the neutral trend classification, the 'AL' (Buy) signal generated by the aggregated indicators on this timeframe suggests that dips might be seen as buying opportunities by longer-term investors, provided key support levels hold.
Intermarket Correlations: A Symphony of Moving Parts
The Dollar Index (DXY) and Its Inverse Relationship with Gold
The DXY's current position around 97.9 is a critical reference point. As previously mentioned, the inverse correlation between the dollar and gold is a well-established market dynamic. When the dollar strengthens, it increases the cost of gold for holders of other currencies, typically leading to reduced demand and lower prices. Conversely, a weakening dollar makes gold more affordable and attractive, often driving prices higher. This relationship, however, is not always linear and can be influenced by other factors, such as real interest rates, inflation expectations, and geopolitical risk aversion.
The DXY's daily chart shows a neutral trend (50% strength), with RSI at 40.62 suggesting a bearish inclination. The MACD is in negative momentum, and Bollinger Bands are below the middle band, all pointing towards potential downside for the dollar. The ADX at 26.2 indicates a strong downtrend. If the dollar continues to weaken, as suggested by these daily indicators, it would likely provide a significant tailwind for XAUUSD, potentially pushing prices towards the upper resistance levels. The ability of the DXY to break below its daily support levels around 97.66 would be a strong signal for gold bulls.
Equities: Risk Appetite and Safe-Haven Flows
The performance of major equity indices like the S&P 500 and Nasdaq 100 provides crucial insight into market risk appetite. Currently, the S&P 500 is trading around 6,572.87, showing a strong daily gain of 0.74%, and the Nasdaq 100 is also firm, up 1.45% at 26,682.75. The 1-hour and 4-hour charts for both indices show bullish trends, indicating a prevailing risk-on sentiment in the short to medium term. This generally implies that investors are more willing to take on risk, which can sometimes reduce the demand for safe-haven assets like gold.
However, the daily charts present a more nuanced picture. The S&P 500 shows a bearish trend (100% strength) on the daily timeframe, despite its intraday gains. Its RSI is 45.35, and the MACD is in negative momentum. Similarly, the Nasdaq 100's daily trend is neutral, but its RSI is high at 75.28, signaling overbought conditions and potential for a pullback. This divergence between short-term strength and longer-term caution in equities suggests that the market is navigating conflicting signals. A sudden shift towards risk-off sentiment, perhaps triggered by geopolitical events or disappointing economic data, could see a rotation into gold as investors seek safety, overriding the current positive equity performance.
Oil Prices: Inflationary Pressures and Geopolitical Triggers
Oil prices, represented by Brent Crude at $92.54 and WTI at $86.42, have experienced a significant downturn this week, with both benchmarks seeing substantial percentage drops. This decline comes after a period of elevated prices, driven by geopolitical tensions in the Middle East. The recent drop suggests that either the immediate threat of supply disruptions has receded, or market participants are factoring in a potential easing of tensions, such as the reported reopening of the Strait of Hormuz. This cooling of oil prices has implications for inflation expectations.
Higher oil prices directly contribute to inflationary pressures through increased transportation and energy costs. A sustained drop in oil prices could alleviate some of these concerns, potentially influencing central bank policy decisions and reducing the urgency for aggressive monetary tightening. For gold, which is often seen as an inflation hedge, a decrease in inflationary expectations due to falling oil prices could act as a headwind. However, gold's safe-haven appeal can sometimes decouple it from traditional inflation-hedging roles, especially when geopolitical risks remain elevated. The current price action in oil suggests that the immediate inflationary impulse from energy markets may be subsiding, but the underlying geopolitical instability means this could reverse quickly.
Central Bank Watch: Policy Signals and Their Weight
The Federal Reserve's Tightrope Walk
The Federal Reserve remains at the center of global monetary policy discussions. Market participants are keenly observing any signals regarding the future path of interest rates. Recent economic data has presented a mixed picture, making the Fed's task of balancing inflation control with economic growth particularly challenging. While inflation has shown signs of moderating, it remains above the Fed's target, and the labor market, though showing some signs of cooling, remains relatively robust.
The current market pricing, as reflected in Fed Funds Futures, suggests a divided outlook among traders regarding the timing and extent of potential rate cuts. Any indication from Fed officials that rates will remain higher for longer, perhaps due to persistent inflation or strong economic data, could strengthen the dollar and weigh on gold. Conversely, a more dovish tone, emphasizing economic risks or a faster-than-expected decline in inflation, could weaken the dollar and boost gold prices. The upcoming economic calendar, particularly U.S. retail sales and any Fed speeches, will be crucial in shaping these expectations and, consequently, gold's trajectory.
Global Central Bank Activity: A Record Year for Gold Accumulation
It's important to remember the significant role that central bank buying has played in the gold market over the past couple of years. Many central banks, particularly those in emerging markets like Russia and China, have been actively increasing their gold reserves. This consistent demand provides a structural underpinning for gold prices, acting as a buffer against sharp downturns driven by speculative selling or short-term macro shifts. This institutional demand is a long-term factor that often gets overlooked in the day-to-day price fluctuations.
While specific data for the current quarter is still emerging, the trend of central bank accumulation has been a powerful supportive factor for gold. This diversification away from fiat currencies and U.S. dollar reserves is driven by a desire for stability and a hedge against geopolitical and economic uncertainties. This sustained buying interest from official sector entities suggests a fundamental floor for gold prices, providing a level of confidence for investors looking at the metal from a long-term store-of-value perspective. This demand is less sensitive to short-term interest rate differentials and more focused on strategic reserve management.
Key Levels and Potential Scenarios for the Week Ahead
Navigating the $4,834.08 Pivot
The current price of $4,834.08 for XAUUSD represents a critical juncture. On the daily chart, this level is very close to the middle Bollinger Band and hovers above the key support at $4,763. The immediate resistance on the 1H chart is seen at $4,865.55, with a more significant daily resistance level at $4,893.08. A sustained move above $4,893.08 could signal a continuation of the bullish trend, potentially targeting higher levels. Conversely, a decisive break below the daily support at $4,763 would indicate a shift towards bearish sentiment, opening the door for further downside.
The ADX on the daily chart, at 22.43, suggests a moderately strong trend, but the conflicting signals from RSI and Stochastic necessitate a cautious approach. This means that while there might be opportunities, the market is not yet in a clear, high-conviction trend. Traders will be looking for confirmation through increased volume and decisive breaks of key levels before committing to significant positions. The interplay between geopolitical news, central bank rhetoric, and U.S. economic data will be the primary drivers shaping which direction gold ultimately takes.
Scenario Planning: A Probabilistic Approach
Given the mixed signals and the pivotal current price action, a scenario-based approach is prudent. The market appears to be at a crossroads, with several potential paths forward.
Bearish Scenario: Consolidation and Downside Risk
35% ProbabilityNeutral Scenario: Range-Bound Trading
40% ProbabilityBullish Scenario: Breakout Above Resistance
25% ProbabilityEconomic Calendar Watchlist
The upcoming week's economic calendar is critical for setting the direction. Key events include U.S. Retail Sales data, which will offer insight into consumer resilience amidst rising energy costs - currently projected to show a significant upswing driven by a surge in gasoline prices. This data point, along with any further commentary from Federal Reserve officials, will heavily influence market expectations regarding interest rates and, consequently, the U.S. dollar and gold prices. The GBP saw a notable surprise with its latest inflation data coming in at 0.5% actual versus a forecast of 0.1%, suggesting underlying price pressures in the UK economy that could affect the Bank of England's policy stance. Additionally, the EUR saw higher-than-expected economic growth figures, potentially offering some support to the single currency against a fluctuating dollar.
The recent surge in oil prices, though now seeing some pullback, has kept inflation concerns alive. While Brent crude is trading around $92.54 and WTI at $86.42, the rapid ascent and subsequent fall highlight the market's sensitivity to geopolitical events. Any renewed spikes in energy prices could reignite inflation fears, potentially boosting gold's safe-haven appeal. Conversely, a sustained cooling in oil markets might reduce the immediate inflationary pressure, allowing central banks more flexibility and potentially tempering gold's gains. Investors will be closely monitoring these developments for clues on the future path of monetary policy and the overall risk sentiment in the markets.
Market Outlook and Investor Strategy
Balancing Short-Term Volatility with Long-Term Value
Gold's performance this week, characterized by consolidation around $4,834.08, reflects a market grappling with conflicting forces. Geopolitical stability remains fragile, providing a baseline level of safe-haven demand, while macroeconomic data and central bank policy expectations are creating uncertainty. The divergence in technical signals across different timeframes further complicates the immediate outlook. Short-term traders may find opportunities in the range-bound action, while longer-term investors are likely weighing the potential for broader economic shifts against the backdrop of persistent geopolitical risks.
From a strategic perspective, patience appears to be the most prudent approach. The current environment does not offer a clear, high-conviction trend. Instead, it presents a market that is highly sensitive to news flow. For those looking to establish new positions, waiting for a decisive break of either the key support at $4,763 or the resistance around $4,893.08 would provide greater confidence. Risk management remains paramount; utilizing tight stop-losses and position sizing appropriate to the current volatility is essential. The long-term fundamental drivers for gold, including central bank accumulation and its role as a store of value, remain intact, suggesting that underlying demand is supportive even amidst short-term price choppiness.
The Role of Gold in a Diversified Portfolio
In times of heightened uncertainty, whether geopolitical or economic, gold often reaffirms its position as a critical component of a diversified investment portfolio. Its historical performance during periods of market stress, inflation, and currency devaluation underscores its value as a hedge. While short-term price movements can be volatile, the strategic importance of gold lies in its ability to preserve capital and potentially appreciate when other asset classes falter.
The ongoing accumulation of gold by central banks globally is a testament to its enduring appeal as a reserve asset. This structural demand, coupled with investment flows driven by macroeconomic concerns such as inflation and real interest rates, provides a solid foundation for the metal. As we look ahead, the interplay between monetary policy expectations, the trajectory of the U.S. dollar, and the ever-present geopolitical landscape will continue to shape gold's price action. For investors, understanding these dynamics and maintaining a disciplined approach to risk management will be key to navigating the opportunities and challenges that lie ahead in the gold market.
Frequently Asked Questions: XAUUSD Analysis
What happens if XAUUSD breaks above the $4,893.08 resistance level?
A sustained break above $4,893.08 resistance could signal a continuation of the bullish trend, potentially targeting $4,934.22 (4H R3) and then the psychological level of $5,000.
Should I buy XAUUSD at current levels of $4,834.08 given the mixed signals?
Given the neutral short-term trend and conflicting indicators, caution is advised. Waiting for a clear breakout above $4,893.08 or breakdown below $4,763 offers a higher probability setup, rather than entering at current levels.
Is RSI at 53.37 a buy signal for XAUUSD on the 1-hour chart?
The RSI at 53.37 on the 1-hour chart shows a neutral momentum with an upward inclination, not a direct buy signal. However, the Stochastic oscillator's crossover suggests potential weakening, making a buy signal questionable without further confirmation.
How will upcoming U.S. Retail Sales data affect XAUUSD this week?
Stronger-than-expected Retail Sales data could boost the dollar and weigh on gold, while weaker data might signal economic slowdown, potentially weakening the dollar and supporting gold prices as a safe-haven asset.
Track markets in real-time
AI-powered analysis, technical indicators and real-time price data.
Join Our Telegram Channel
Breaking market news, AI analysis and trading signals instantly.
Join Channel