

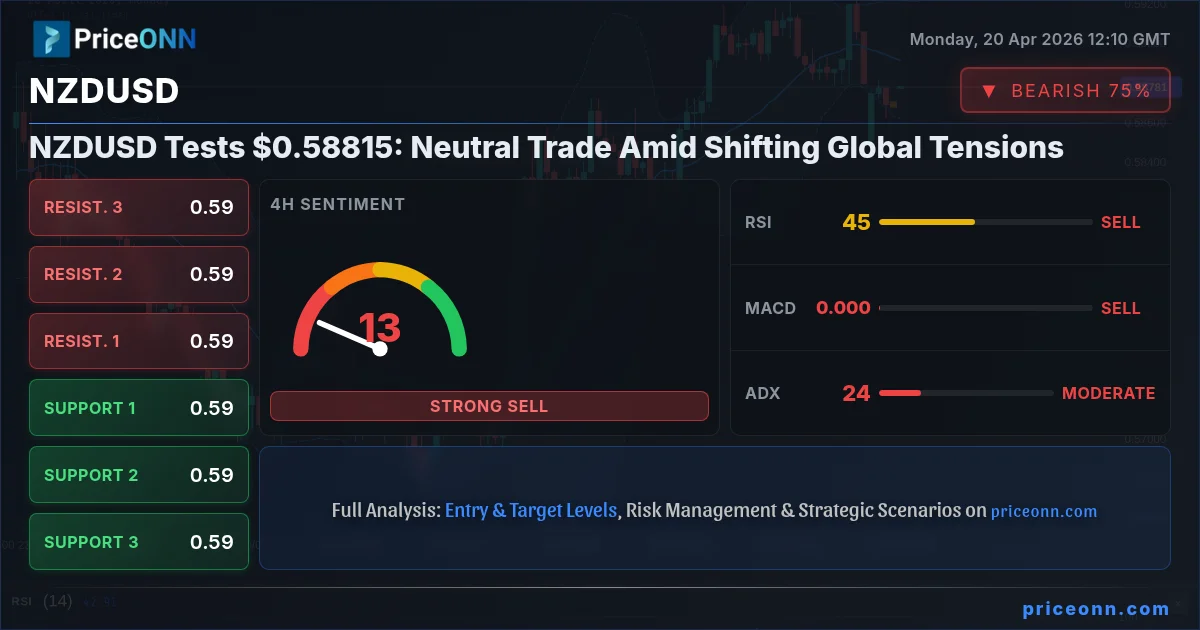
The New Zealand Dollar is currently navigating a critical juncture against the US Dollar, trading at approximately $0.58815. This level represents a neutral ground after a period of fluctuating sentiment, heavily influenced by a surprisingly positive trade balance report and the ever-present global geopolitical undercurrents. While recent data suggests a potential boost from Asian trade, the broader market continues to grapple with shifting risk appetites and the persistent strength of the US Dollar Index (DXY). Understanding the interplay between these factors is crucial for deciphering the next move in NZDUSD.
- NZDUSD is trading around $0.58815, showing a neutral stance across multiple timeframes.
- A surprise widening of New Zealand's March trade surplus to NZD 698 million provides some underlying support.
- The US Dollar Index (DXY) at 97.95 presents a significant headwind, influencing currency pairs like NZDUSD.
- Technical indicators show mixed signals; RSI at 51.57 on 4H suggests caution, while ADX at 30.05 indicates a strong trend is forming.
The narrative for NZDUSD is currently a complex tapestry woven from domestic economic surprises and the persistent dominance of the US Dollar. On the domestic front, New Zealand's trade data for March delivered a welcome jolt, with the trade surplus widening unexpectedly to NZD 698 million. This figure significantly surpassed market expectations, driven largely by robust exports to Asia. Such positive trade dynamics typically lend strength to a nation's currency, suggesting that the Kiwi may have found some footing. However, the broader forex market remains under the sway of the US Dollar, which is currently showing resilience around 97.95 on the DXY index. This persistent dollar strength acts as a significant gravitational pull, making it challenging for pairs like NZDUSD to establish a clear upward trajectory. The interplay between these forces creates a delicate balance, where any decisive move will likely require a clear catalyst to break the current stalemate.
The technical landscape for NZDUSD offers a nuanced view, reflecting the broader market's indecision. On the 1-hour chart, the trend is neutral with moderate strength, showing a confluence of signals that don't point to a strong directional bias. The RSI at 51.1 hovers in neutral territory with a slight upward inclination, suggesting a cautious optimism, while the MACD indicates positive momentum. However, the Bollinger Bands are trading below the middle band, hinting at a potential downward pressure. Stochastic signals a buy, but the ADX at 20.59 points to a moderately strong downtrend, creating a somewhat contradictory picture. This suggests that short-term traders might be looking for immediate confirmation before committing to a position, with the immediate resistance at $0.59637 and support at $0.71481.
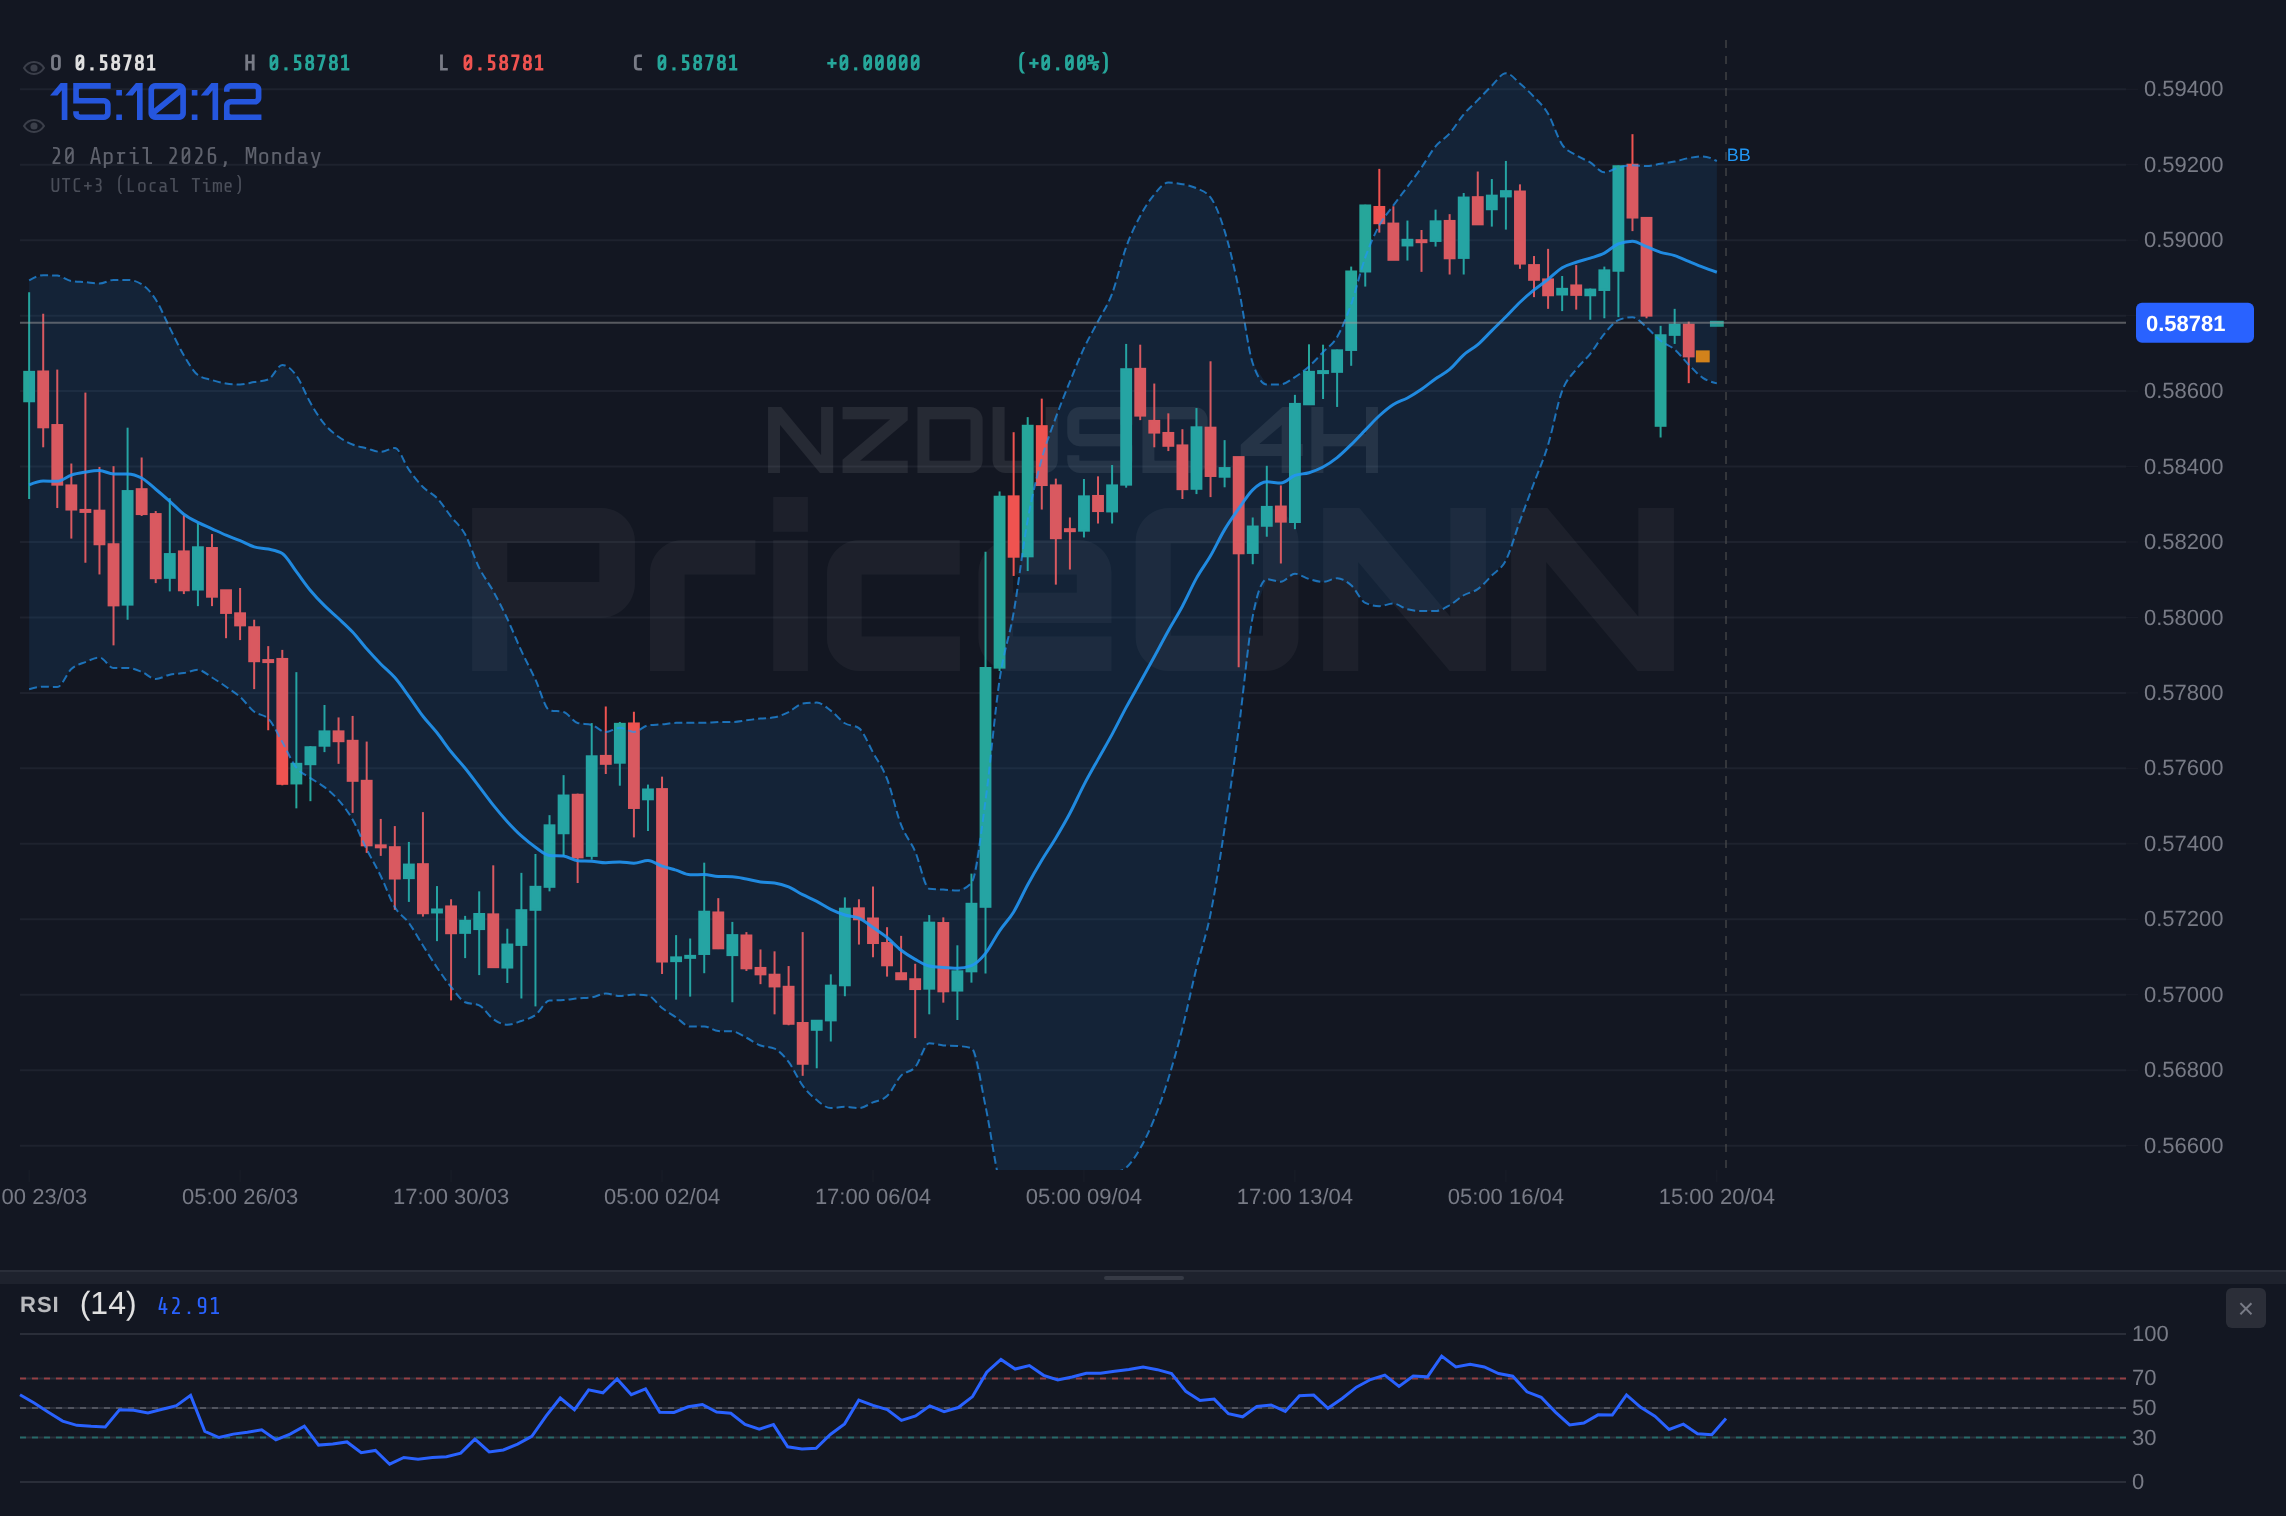
Shifting to the 4-hour timeframe, the picture becomes slightly more defined, yet still presents a challenge for clear directional trading. The trend is technically classified as 'Bullish' with high strength (95%), yet the RSI at 51.57 remains in neutral territory, showing an upward bias. The MACD, however, displays negative momentum with the MACD line below the signal line, contradicting the bullish trend classification. Bollinger Bands are also below the middle band, reinforcing a bearish inclination in this timeframe, while Stochastic provides a sell signal. The ADX at 30.05 indicates a strong uptrend, which seems at odds with the bearish signals from MACD and Stochastic. This divergence across indicators on the 4-hour chart highlights the uncertainty. While the overall trend leans bullish, the immediate momentum and oscillator readings suggest a cautious approach is warranted, with traders likely watching the $0.71599 resistance and $0.71476 support levels closely.
On the daily timeframe, the NZDUSD presents a predominantly bullish outlook, with a neutral trend strength of 50%. The RSI stands at 62.96, firmly in neutral territory with a clear upward bias, indicating room for further gains before reaching overbought conditions. The MACD is positive, trading above its signal line, and the Bollinger Bands are above the middle band, supporting a bullish sentiment. However, the Stochastic oscillator is in overbought territory, with %K at 81.56 and %D at 90.91, flashing a potential sell signal and suggesting that the pair might be due for a pullback or consolidation. The ADX at 20.18 suggests a moderately strong uptrend. This daily view paints a picture of underlying strength but with a caution flag raised by the overbought Stochastic, implying that while the upside may be favored, the immediate path forward could involve some choppiness or consolidation before any significant move.
The US Dollar Index (DXY), a critical barometer for global currency markets, currently sits at 97.95. Its recent movements, influenced by a mix of economic data and geopolitical developments, cast a long shadow over pairs like NZDUSD. While the 1-hour trend for DXY shows a bearish inclination (strength 89%), with RSI at 53.87 and MACD positive, the daily chart presents a neutral trend (50% strength) with a bearish bias. The daily RSI at 41.53 indicates a bearish trend, and the MACD is negative. However, Stochastic on the daily chart gives a buy signal, creating another layer of complexity. This mixed picture for the DXY means its influence on NZDUSD is not a simple one-way street. A stronger dollar typically exerts downward pressure on NZDUSD, while a weakening dollar could provide a tailwind. The current readings suggest that while the dollar has some underlying strength, it might be facing headwinds, potentially creating breathing room for currencies like the NZD.
Looking at other major currency pairs provides further context for NZDUSD's potential path. EUR/USD, for instance, is trading at 1.1764, showing a neutral trend on the 1-hour chart but a strong bullish trend on the 4-hour (96% strength) and daily (50% strength) timeframes. The daily RSI at 60.08 supports this bullish view, although Stochastic is signaling a potential pullback. A stronger EUR/USD generally correlates with a weaker USD, which could indirectly benefit NZDUSD by reducing the downward pressure from the dollar. Conversely, USD/JPY is trading at 158.859, with a neutral trend across all timeframes and a general bearish signal on the 4-hour and daily charts. A weaker JPY, often seen as a safe-haven currency, can sometimes correlate with risk-on sentiment, which might indirectly support riskier currencies like the NZD, though the current data doesn't paint a strong picture here.
The recent news flow also adds layers to the NZDUSD analysis. Reports indicated that the US Dollar weakened last week amid easing Middle East tensions and falling crude oil prices. This sentiment, however, appears to be shifting as geopolitical tensions re-emerge. The news of US forces intercepting an Iranian cargo ship and the potential closure of the Strait of Hormuz has sent Brent crude prices surging past $95 a barrel and WTI crude prices higher. Such an escalation in the Middle East typically boosts safe-haven demand, which could strengthen the US Dollar and put pressure on NZDUSD. The conflicting narratives – easing tensions leading to dollar weakness versus renewed tensions potentially strengthening the dollar – create significant volatility and uncertainty. Traders are closely monitoring these geopolitical developments as they can quickly override purely technical considerations.
The economic calendar is also a key factor to consider. While specific high-impact events for NZDUSD's direct currency (NZD) are not highlighted in the immediate upcoming days, broader USD-centric data releases will be critical. Upcoming US data, such as retail sales figures and inflation indicators, will heavily influence the DXY and, by extension, NZDUSD. For example, if upcoming US inflation data comes in hotter than expected, it could reinforce the Federal Reserve's hawkish stance, potentially strengthening the dollar and creating headwinds for NZDUSD. Conversely, weaker-than-expected data might signal a pivot from the Fed, leading to dollar weakness and offering a reprieve for the Kiwi. Traders will be scrutinizing these releases for any hints of a shift in monetary policy expectations.
Given the mixed technical signals and the conflicting macro-economic drivers, a neutral trading approach for NZDUSD seems most prudent at this juncture. The pair is caught between the supportive domestic trade data and the looming influence of the US Dollar, exacerbated by geopolitical uncertainties. The 1-hour chart shows neutral to slightly bullish momentum, while the 4-hour chart presents a bullish trend but with bearish oscillator readings. The daily chart offers an underlying bullish bias but warns of overbought conditions. This indecision suggests that the market is waiting for a clearer signal, likely from upcoming economic data or a definitive shift in geopolitical sentiment. Consequently, price action around the current $0.58815 level will be critical in determining the next directional move.
From a risk management perspective, the current environment demands caution. The support level at $0.71481 on the 1-hour chart and $0.71476 on the 4-hour chart represents immediate areas where buying interest could emerge. A break below these levels, especially on increased volume, would invalidate the current bullish leanings and could signal a move towards the next support at $0.71440 (1H) or $0.71402 (4H). On the resistance side, the $0.59637 level on the 1-hour chart and $0.71599 on the 4-hour chart are key hurdles. A decisive move above these resistance points, particularly if accompanied by strong volume and positive macroeconomic news, could open the door for further upside towards $0.59878 (1H) or $0.71722 (4H). However, until such a breakout occurs, the market is likely to remain range-bound, with significant risk of sharp reversals on geopolitical news or economic data surprises.
The interplay between the NZD's performance and the broader commodity complex also warrants attention. While not directly correlated in all market conditions, a significant surge in oil prices, as seen with Brent crude nearing $100, can sometimes be associated with increased inflation expectations. This, in turn, can influence central bank policies, particularly the Federal Reserve's stance on interest rates, which directly impacts the DXY and, consequently, NZDUSD. If oil prices continue to climb due to geopolitical escalations, it could create a scenario where the US Dollar strengthens as a safe-haven asset, despite the potential inflationary impact. This complex relationship means that energy market movements should be monitored closely as potential leading indicators for shifts in currency dynamics.
The 4-hour ADX at 30.05 is a significant technical signal, indicating a strong trend is in play. However, the conflicting signals from other indicators like the MACD and Stochastic suggest that this trend might be approaching a critical inflection point. If the bullish momentum can be sustained and confirmed by oscillators moving out of extreme zones, then the trend could continue. Conversely, a failure to hold current levels, particularly the support at $0.71476, could lead to a sharp reversal, especially if geopolitical tensions escalate further, driving demand for safe-haven assets like the US Dollar. The market is currently in a delicate balance, and the next 24-48 hours of trading will be crucial in determining whether the current bullish leanings on the daily chart can overcome the short-term headwinds.
The recent performance of equity markets also provides a backdrop for NZDUSD's movements. The Nasdaq 100, for instance, is showing a strong bullish trend on the 4-hour chart (100% strength) and a neutral trend on the daily chart, despite recent dips. The S&P 500, however, shows a strong bearish trend on the daily timeframe (100% strength), indicating a potential risk-off sentiment in broader markets. This divergence between the tech-heavy Nasdaq and the broader S&P 500 adds another layer of complexity. Generally, a risk-off environment would weigh on risk-sensitive currencies like the NZD. However, the strength in the Nasdaq suggests that certain segments of the market remain resilient. The conflicting signals between indices and across timeframes mirror the indecision seen in NZDUSD, highlighting the need for traders to remain vigilant and adaptable.
Considering the overall technical and fundamental picture, NZDUSD finds itself at a pivotal point. The domestic trade surplus offers a glimmer of optimism, but it is overshadowed by the potential for dollar strength driven by geopolitical risks and the mixed technical signals across different timeframes. The 1-hour chart leans neutral-to-bullish, the 4-hour shows a strong bullish trend with bearish oscillators, and the daily chart indicates underlying bullishness with overbought warnings. This confluence of factors suggests that while a short-term bounce is possible, significant upside may be capped until a clearer macro or geopolitical catalyst emerges. Patience and disciplined risk management will be key for navigating this uncertain terrain.
The path forward for NZDUSD hinges on several key factors. Geopolitical stability in the Middle East will be paramount; any further escalation could trigger a flight to safety, strengthening the USD and pressuring NZDUSD. Conversely, a de-escalation could see the dollar weaken, providing an opportunity for NZDUSD to test higher resistance levels. Economic data releases from the US will also play a crucial role, particularly those related to inflation and employment, which will shape expectations for Federal Reserve policy. On the technical front, the $0.71476 support level on the 4-hour chart is critical. A hold here could pave the way for a move towards $0.71599, while a decisive break below could signal a deeper correction.
The current price action around $0.58815 is a battleground. The bulls are trying to leverage the positive trade balance and a potentially softening US Dollar, while the bears are capitalizing on geopolitical fears and the dollar's historical role as a safe haven. With the ADX indicating a strong trend is trying to form, the market is likely seeking confirmation. If NZDUSD can break decisively above the $0.71599 resistance on the 4-hour chart, backed by favorable news and robust volume, it could signal the start of a more sustained uptrend. However, failure to do so, especially with rising geopolitical tensions, could see the pair retrace towards the $0.71476 support, and potentially lower, as the greenback reasserts its dominance.
The NZDUSD pair is currently exhibiting a neutral trading bias, caught between supportive domestic data and significant global headwinds. The technical indicators offer a mixed bag of signals, demanding a cautious approach. While the daily chart suggests an underlying bullish sentiment, the short-to-medium term outlook is clouded by geopolitical uncertainties and the dollar's performance. Traders should remain vigilant, monitor key levels such as $0.71476 for support and $0.71599 for resistance, and pay close attention to developments in the Middle East and upcoming US economic data. The market is poised for a potential shift, but the direction remains uncertain.
Frequently Asked Questions: NZDUSD Analysis
What happens if NZDUSD breaks below the $0.71476 support level?
A break below the $0.71476 support level on the 4-hour chart would invalidate the current bullish leanings. This could trigger a move towards the next support at $0.71402, especially if geopolitical tensions escalate and the US Dollar strengthens. Such a move would signal increased risk aversion in the market.
Should I buy NZDUSD at current levels of $0.58815 given the mixed signals?
Buying NZDUSD at $0.58815 requires careful risk management due to conflicting technical signals. A high-probability setup would involve waiting for a confirmed breakout above $0.71599 resistance or a clear bounce from $0.71476 support, ideally with favorable geopolitical news. Without such confirmation, the risk of a reversal is significant.
Is the RSI at 62.96 on the daily chart a sell signal for NZDUSD?
An RSI of 62.96 on the daily chart is in neutral territory with an upward bias, not yet considered a strong sell signal. While it indicates room for further gains, the overbought Stochastic oscillator at 81.56 suggests caution and a potential for consolidation or a pullback. A confirmed sell signal would typically require RSI to move above 70 and then show divergence or reversal patterns.
How will upcoming US economic data affect NZDUSD this week?
Upcoming US economic data, particularly inflation and employment figures, will significantly impact the US Dollar Index (DXY). Stronger-than-expected data could strengthen the dollar, pressuring NZDUSD lower, while weaker data might lead to dollar weakness, potentially supporting NZDUSD. Traders should monitor these releases closely for shifts in Fed policy expectations.
Bearish Scenario: Dollar Strength Resurfaces
60% ProbabilityNeutral Scenario: Range-Bound Consolidation
30% ProbabilityBullish Scenario: Kiwi Strength Prevails
10% ProbabilityTrack markets in real-time
AI-powered analysis, technical indicators and real-time price data.
Join Our Telegram Channel
Breaking market news, AI analysis and trading signals instantly.
Join Channel