AUDUSD Tests Resistance Near $0.69539; Powell's Shadow Looms
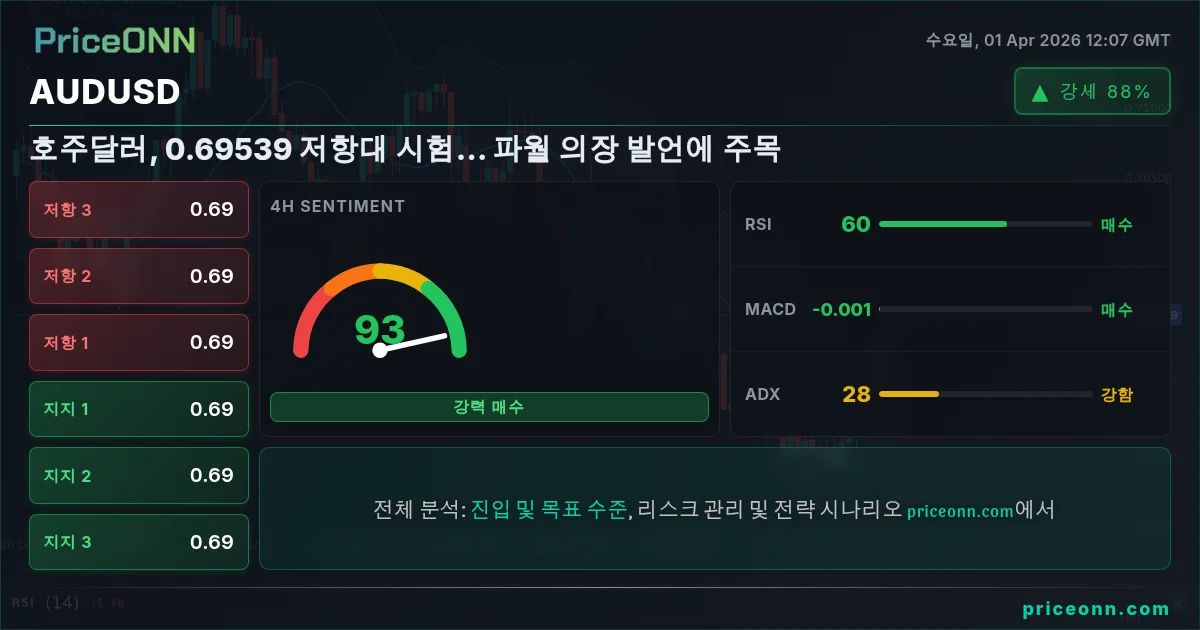
AUDUSD hovers around $0.69539 as traders eye key resistance and upcoming Powell speech. Geopolitical risks ease, but inflation concerns persist.
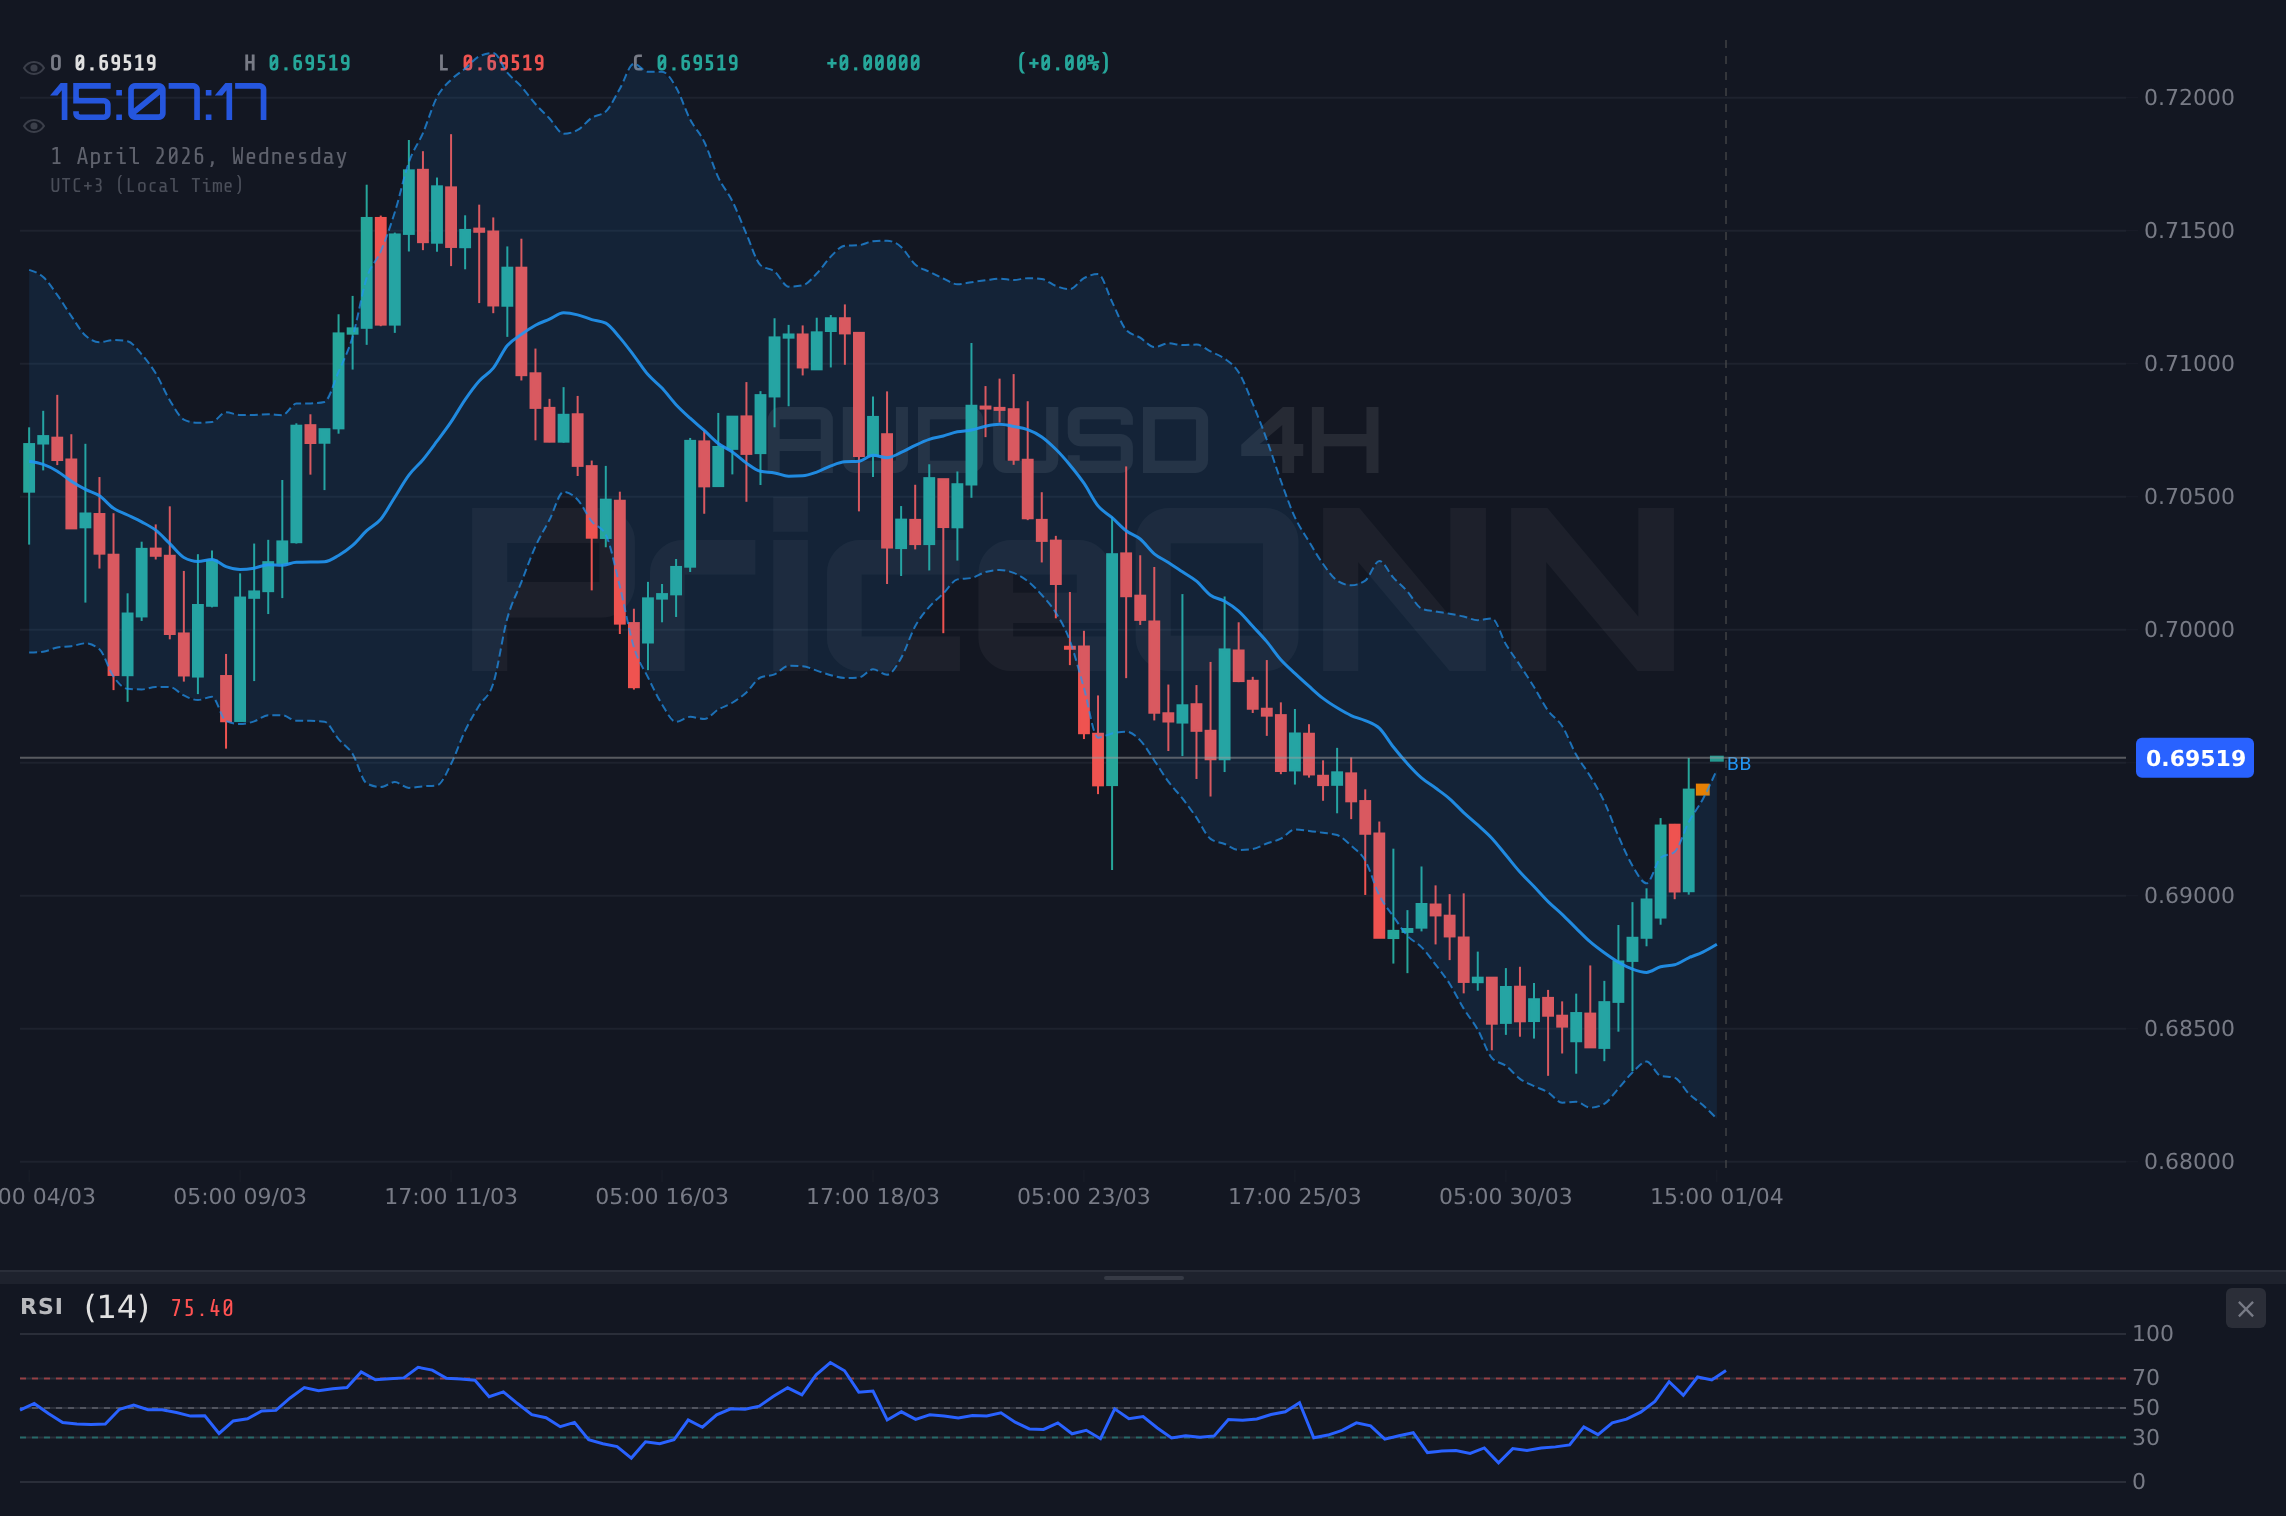
AUDUSD is currently dancing around the $0.69539 mark, a critical juncture where resistance looms large and the market holds its breath for signals from Federal Reserve Chair Powell. The Aussie has shown resilience lately, buoyed by easing geopolitical tensions in the Middle East and a broader shift away from extreme risk-off sentiment. However, persistent inflationary pressures and the ever-present influence of the US Dollar Index (DXY) keep the outlook for this pair decidedly complex. This AUDUSD today analysis delves into the intricate interplay of technicals, fundamentals, and market sentiment to map out potential paths forward.
- RSI at 68.66 signals a neutral-to-bullish leaning, but caution is advised as it approaches overbought territory on the 1H chart.
- Critical resistance sits at $0.69566, a level AUDUSD is currently testing, with further resistance at $0.69517.
- The ADX at 28.47 on the 1H chart indicates a strong uptrend, but the 1D ADX at 26.36 suggests a more consolidated trend.
- DXY is trading at 99.17, showing a bearish trend on the 1H and 4H charts, which typically supports AUDUSD.
Navigating the Cross-Currents: AUDUSD and its Global Context
The AUDUSD pair is currently caught in a fascinating tug-of-war, reflecting broader market dynamics. On one hand, the easing of geopolitical tensions, particularly in the Middle East, has somewhat defused the immediate inflationary fears that were previously pushing commodities, including gold, past $4,700. This de-escalation typically dampens demand for safe-haven assets like the US Dollar, offering a tailwind to risk-sensitive currencies such as the Australian Dollar. The DXY, trading at 99.17 and showing a bearish trend on its shorter timeframes, illustrates this dollar weakness. On the 1H chart, the DXY's ADX at 49.78 confirms a strong downtrend, which is a classic supportive factor for AUDUSD.
However, the narrative is far from one-sided. While the immediate geopolitical storm may be subsiding, the underlying inflationary pressures remain a significant concern for central banks, particularly the US Federal Reserve. The anticipation of Fed Chair Powell's speech injects a dose of caution into the market. Any hint of a more hawkish stance on inflation could quickly shift the sentiment back towards the greenback, potentially stalling or reversing the recent gains in AUDUSD. The market's reaction to the latest US economic data, though not explicitly detailed in the provided context for today's releases, will be scrutinized for any signs of persistent price pressures. The AUDUSD fundamentals, therefore, are a complex mix of easing external risks and ongoing domestic concerns about inflation control.

Technical Picture: A Battle at the Resistance
From a technical standpoint, AUDUSD is at a crucial inflection point. On the 1-hour chart, the trend is strongly bullish, with an ADX of 28.47 indicating a robust upward momentum. The RSI at 68.66 suggests the pair is in strong territory but not yet in the overbought zone, leaving room for further upside. The MACD showing positive momentum and Stochastic K% above D% reinforce this bullish short-term outlook. However, the immediate challenge lies at the resistance levels. The 1H resistance is clearly defined at $0.69566, with tighter bands at $0.69517 and $0.69475. A decisive break and hold above $0.69566 would be a significant bullish signal, potentially opening the door for further gains.
The 4-hour chart presents a slightly more consolidated, yet still bullish, picture. The ADX at 27.58 indicates a strong uptrend, and the RSI at 59.74 is comfortably in the neutral zone, suggesting room for upward movement without immediate overbought concerns. The Stochastic K=86.12 and D=79.35, however, are firmly in overbought territory, signaling that a short-term pullback or consolidation could be imminent. This divergence between the bullish trend strength and the overbought Stochastic on the 4H chart highlights the delicate balance. The longer-term daily chart shows a different story, with an ADX of 26.36 suggesting a strong downtrend, and an RSI of 46.93 indicating bearish momentum. This conflict across timeframes underscores the importance of the immediate price action around the $0.69539 level.
The Bull's Roadmap: Breaking Higher
For the bulls to maintain control and push AUDUSD higher, a clear break and sustained hold above the immediate resistance is paramount. The most significant hurdle is the $0.69566 level on the 1-hour chart. A successful breach here, ideally accompanied by increasing volume and confirmation from shorter-term indicators, would signal a continuation of the intraday uptrend. The next logical target would be the 4-hour resistance at $0.69374, and then further up towards the 4-hour resistance of $0.69478. If the momentum carries through, the daily resistance levels at $0.69929 and then $0.70232 come into play. This bullish scenario hinges on continued dollar weakness, a dovish-leaning tone from Fed Chair Powell, and sustained risk appetite in global markets. The RSI on the 1H chart at 68.66 suggests there's still some room to run before hitting extreme overbought conditions, making this path plausible if key triggers are met.
The trigger for this bullish scenario would be a decisive close above $0.69566 on the 1-hour chart, ideally sustained for at least a couple of candles. Invalidation would occur if the price fails to break this resistance and instead pulls back sharply, closing below the $0.69384 support on the 1H chart. The probability of this scenario playing out is moderate, perhaps around 35%, given the conflicting signals from the daily chart and the looming uncertainty around Powell's speech. The key is confirmation; a break without conviction could easily lead to a bull trap.
Where Bears Take Control: The Downside Risk
Conversely, the bearish case for AUDUSD gains traction if the pair fails to overcome the current resistance at $0.69539 and begins to roll over. The daily chart's bearish trend, confirmed by an ADX of 26.36 and RSI below 50, provides a fundamental basis for a downside move. A failure to break resistance could lead to profit-taking, especially with the Stochastic on the 4-hour chart flashing overbought signals (K=86.12, D=79.35). The immediate support level to watch on the 1-hour chart is $0.69475, followed by $0.69384. A break below these levels would confirm a short-term bearish reversal, targeting the 4-hour support at $0.69195 and subsequently $0.68912.
The ultimate trigger for this bearish scenario would be a clear break and close below the 1-hour support at $0.69384. This would signal that the intraday bullish momentum has reversed, aligning with the longer-term daily trend. The invalidation of this bearish thesis would be a decisive move back above the $0.69566 resistance. The probability of this bearish scenario is significant, perhaps around 50%, due to the conflicting daily timeframe signals and the potential for hawkish commentary from Powell to bolster the dollar. The market sentiment could quickly shift if inflation data surprises to the upside, or if geopolitical risks re-emerge, both of which would favor a stronger USD and a weaker AUDUSD.
The Waiting Game: Consolidation and Uncertainty
It's entirely plausible that AUDUSD could enter a period of consolidation, trapped between conflicting signals and awaiting clearer direction. This neutral scenario typically occurs when the bullish short-term momentum is met by strong bearish longer-term pressures, and external catalysts like Powell's speech create uncertainty. In this environment, price action might become choppy, oscillating within a defined range. The key levels to watch for this range-bound play would be the immediate resistance around $0.69566 and the support zone near $0.69293 on the 1-hour chart. The daily chart's ADX of 26.36, while indicating a strong trend, can also apply to a consolidated range if it lacks decisive direction. The RSI at 68.66 on the 1H and 59.74 on the 4H suggests upward bias within the range, while the daily RSI at 46.93 hints at underlying weakness.
The trigger for this neutral scenario would be a failure of price to decisively break either the key resistance or support levels for an extended period, perhaps 24-48 hours, with trading volume remaining subdued. Invalidation would occur if either the key support or resistance levels are breached with conviction. The probability of this scenario is estimated at 15%, reflecting the current market's tendency towards decisive moves when major events like Powell's speech are on the horizon. However, if no major catalyst emerges and geopolitical risks remain muted, a period of ranging could ensue as traders await clearer fundamental direction. This scenario is less about defined targets and more about managing trades within the established boundaries.
The Bear's Grip: Downside Risks Emerge
50% ProbabilityThe Waiting Game: Range-Bound Uncertainty
15% ProbabilityThe Bull's Path: Breaking Resistance
35% ProbabilityWhat I'm Watching This Week
The immediate focus will undoubtedly be on Fed Chair Powell's upcoming remarks. Any indication of the Fed's stance on inflation and future rate policy will be critical. A hawkish tone could send the DXY higher and pressure AUDUSD, while a dovish outlook would likely support further gains for the pair. Secondly, I'll be monitoring the AUDUSD's ability to decisively break or hold the key resistance level around $0.69566. A failure to do so, especially with increasing volume, could signal a reversal. Finally, broader market sentiment, particularly the performance of US equities (S&P 500 and Nasdaq) and oil prices, will provide crucial context. A sustained risk-on environment would favor AUDUSD, while a return to risk aversion would likely see it falter.
The divergence between the short-term bullish technicals and the longer-term bearish daily trend on AUDUSD creates a volatile environment. Patience and strict risk management are key. Look for confirmation signals before committing to positions, especially around the critical $0.69539 price point.
Frequently Asked Questions: AUDUSD Analysis
What happens if AUDUSD breaks decisively above the $0.69566 resistance level?
A confirmed break above $0.69566 on the 1H chart, sustained for several candles, would likely trigger further upside, targeting daily resistance levels at $0.69929 and potentially $0.70232. This scenario is supported by current bullish momentum on shorter timeframes and potential dollar weakness.
Should I consider a bearish position if AUDUSD fails to hold above $0.69539, given the daily chart's trend?
Yes, a failure to break resistance around $0.69539, followed by a close below 1H support at $0.69384, would validate a bearish scenario targeting $0.69195 and $0.68912. This aligns with the longer-term bearish trend indicated on the daily chart.
Is the RSI at 68.66 a sell signal for AUDUSD right now?
An RSI of 68.66 on the 1H chart indicates strong bullish momentum but is not yet in overbought territory (typically considered above 70). While it suggests caution and potential for a short-term pullback, it's not a direct sell signal on its own. Confirmation from other indicators and price action is needed.
How will Fed Chair Powell's upcoming speech impact AUDUSD this week?
Powell's speech is a key catalyst. A hawkish tone on inflation could strengthen the USD, pushing AUDUSD lower towards $0.69195. Conversely, a dovish tone might weaken the USD, supporting AUDUSD's move towards $0.69929. Traders should watch for commentary on interest rates and inflation outlook.
| Indicator | Value | Signal | Interpretation |
|---|---|---|---|
| RSI (14) | 68.66 | Neutral-Bullish | Approaching overbought on 1H, neutral on 4H. |
| MACD Histogram | Positive | Bullish Momentum | Positive momentum across timeframes. |
| Stochastic | K=86.12, D=79.35 | Overbought (4H) | Overbought on 4H, suggesting caution. |
| ADX | 27.58 | Strong Trend | Strong uptrend on 1H/4H, strong downtrend on 1D. |
| Bollinger | Upper Band | Watch | Price testing upper bands, indicating potential breakout or reversal. |
Track markets in real-time
AI-powered analysis, technical indicators and real-time price data.
Join Our Telegram Channel
Breaking market news, AI analysis and trading signals instantly.
Join Channel