Brent Crude Eyes $94 as Iran Tension Fuels Rally Near $93.83
Brent crude oil is nearing $94 amid escalating tensions with Iran, currently trading around $93.83. Supply concerns and geopolitical risks are driving the rally.
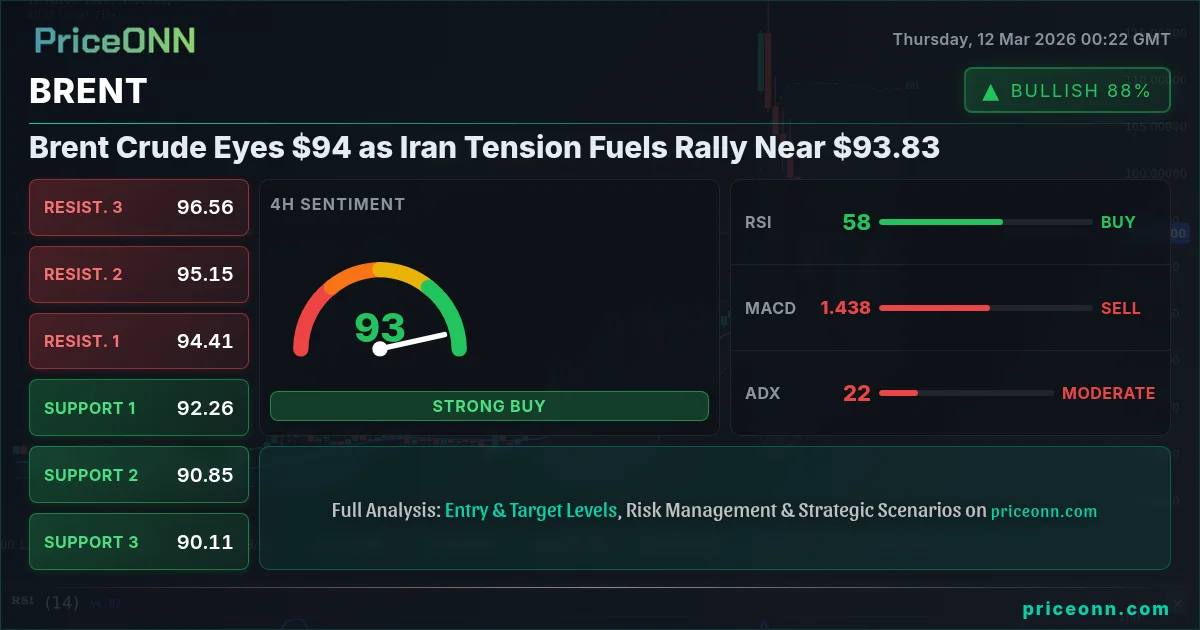
Brent crude oil is currently trading at $93.83, fueled by escalating geopolitical tensions involving Iran. The market is closely watching whether it can sustain this momentum and break through the $94 resistance level.
- RSI at 82.38 on the daily timeframe signals overbought conditions, suggesting a potential pullback.
- Key resistance lies at $97.48, a level not tested since early 2024.
- The ADX at 51.68 indicates a very strong uptrend, but overbought RSI could lead to consolidation.
- Geopolitical tensions with Iran are the primary driver for the current BRENT rally.
The recent surge in BRENT prices is primarily attributed to growing concerns over potential disruptions in oil supply stemming from heightened tensions with Iran. According to Reuters, several oil tankers have been rerouted due to increased naval activity in the Strait of Hormuz, a critical chokepoint for global oil shipments. This has added a risk premium to crude prices, pushing them closer to the $94 mark.
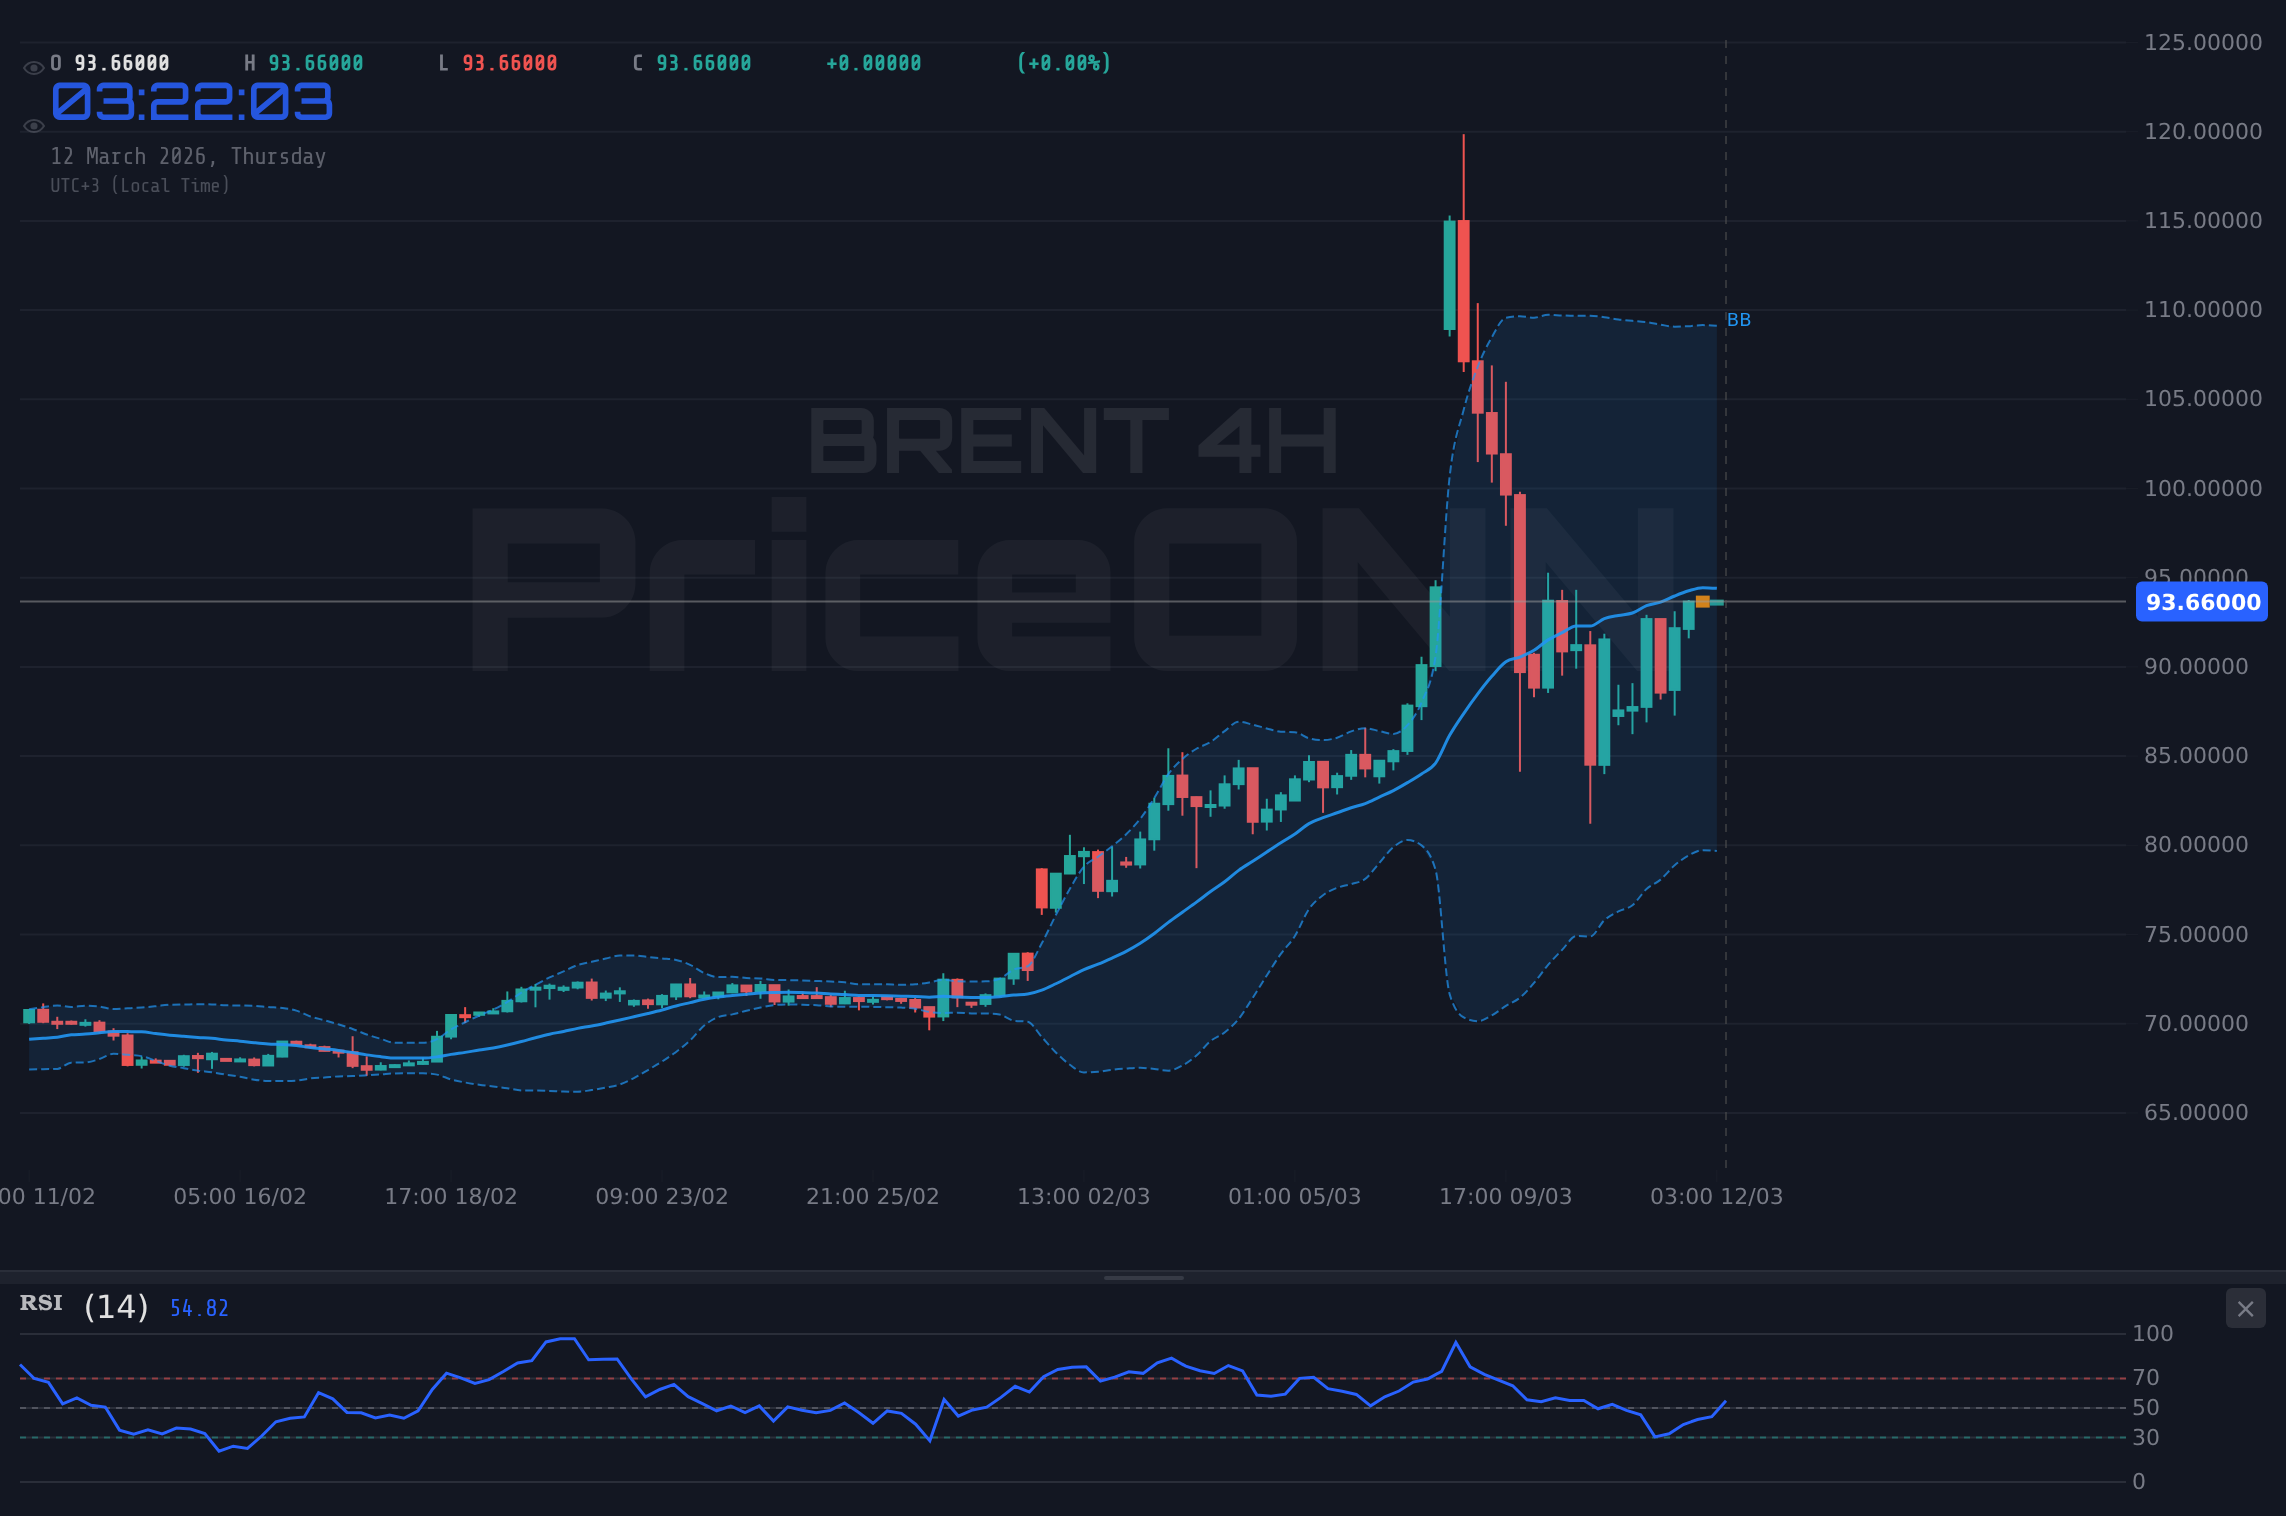
From a technical perspective, the daily chart for BRENT shows a strong uptrend, with the price consistently making higher highs and higher lows. However, the Relative Strength Index (RSI) is currently at 82.38, indicating overbought conditions. This suggests that the rally may be overextended, and a pullback or period of consolidation could be imminent. The ADX indicator, currently at 51.68, signals a very strong uptrend, but the overbought RSI warrants caution.
The Bull's Roadmap: $97 Target
In the bullish scenario, BRENT would need to consolidate above the $94 resistance level, establishing it as new support. A sustained break above $94 could open the door for a test of the next resistance level at $97.48. This scenario is predicated on continued geopolitical tensions and potential supply disruptions. The 1-hour chart shows the Stochastic indicator at 89.86 with %K > %D, indicating a short-term consolidation before another leg up. A daily close above $94 would confirm this bullish outlook and give confidence for swing traders. This scenario has a time horizon of the next two weeks.
Traders should watch the DXY (Dollar Index) closely. Currently, the DXY is at 99.27 and exhibiting a strong uptrend on the daily timeframe. If the DXY continues to strengthen, it could put downward pressure on BRENT prices, potentially offsetting the bullish impact of geopolitical tensions. The key here is to watch for a decoupling - if BRENT continues to rise despite a stronger dollar, it would signal exceptional strength.
Where Bears Take Control: $90 Breakdown
The bearish scenario would unfold if BRENT fails to sustain its momentum above $94 and breaks down below the $90 support level. This could trigger a deeper correction towards the $83.41 support level. This scenario is more likely if geopolitical tensions ease or if there is a significant increase in oil supply. The 4-hour chart shows the MACD histogram turning negative, indicating a potential shift in momentum. The bearish scenario would invalidate the current uptrend. The 1-hour RSI at 57.54 is showing a weakening trend. This scenario has a time horizon of the next week.
The upcoming US economic data releases could play a crucial role in determining the direction of BRENT prices. Specifically, investors are watching the upcoming releases on March 13 (Friday). Stronger-than-expected data could lead to a stronger dollar, putting downward pressure on BRENT, while weaker data could have the opposite effect. According to Bloomberg, analysts are expecting a moderate increase in consumer spending, which could support oil demand.
The Waiting Game: Consolidation Between $90 and $94
A neutral scenario could develop if BRENT remains range-bound between $90 and $94. This could occur if the market is waiting for more clarity on the geopolitical situation or if there are offsetting factors influencing supply and demand. In this scenario, traders should focus on trading the range, buying near support and selling near resistance. The 1-hour chart shows the ADX at 23.12, indicating that the recent uptrend is losing steam, increasing the likelihood of a range-bound scenario. This scenario has a time horizon of the next few days.
Having tracked BRENT through the 2024 rate cycle, I've observed that periods of high volatility are often followed by periods of consolidation. The high ADX readings across multiple timeframes suggest that the current uptrend is strong, but the overbought RSI indicates that a period of consolidation is likely before the next major move. Historically, when the RSI reaches this zone on BRENT, the outcome has been a period of sideways trading lasting several days to weeks.
The recent breakout of WTI (West Texas Intermediate) to $93.73 is also noteworthy. WTI is generally correlated with BRENT, but the spread between the two has widened recently due to localized supply dynamics in the US. This divergence could provide additional insights into the overall strength of the oil market. It is important to note that WTI’s RSI (79.92) also points to overbought conditions suggesting that the entire oil market may be due for a pullback.
Key Triggers to Watch This Week
The most likely scenario is a period of consolidation between $90 and $94, followed by a breakout to the upside towards $97.48. I estimate this scenario has a 50% probability, given the strong uptrend and the potential for continued geopolitical tensions. A breakdown below $90 is less likely (30% probability), but could occur if tensions ease or supply increases unexpectedly. A continued range-bound scenario has a 20% probability.
I am watching two key triggers this week:
- A daily close above $94 would confirm the bullish breakout and signal further upside potential.
- A breakdown below $90 would invalidate the uptrend and suggest a deeper correction.
Until these triggers are activated, caution is warranted. Traders should focus on managing their risk and waiting for a clear signal before committing to a long or short position.
Technical Outlook Summary
| Indicator | Value | Signal |
|---|---|---|
| RSI (14) | 82.38 | Overbought |
| MACD Histogram | Positive | Bullish |
| Stochastic | 43.48 | Bearish |
| ADX | 51.68 | Strong Trend |
| Bollinger | Upper Band | Watch |
Key Levels
Support Levels
Resistance Levels
Frequently Asked Questions: BRENT Analysis
What happens if BRENT breaks above $94 resistance?
If BRENT breaks above the $94 resistance level, it could signal the start of a stronger uptrend. The next target would be the $97.48 resistance level, a level not tested since early 2024. A daily close above $94 would confirm this bullish breakout.
Should I buy BRENT at current $93.83 levels given RSI at 82.38?
Given that the RSI is at 82.38, indicating overbought conditions, it may not be prudent to initiate a new long position at current levels. A better strategy would be to wait for a pullback towards the $90 support level or for the RSI to cool off before entering a long position.
Is RSI at 82.38 a sell signal for BRENT right now?
While an RSI of 82.38 suggests overbought conditions, it is not necessarily a sell signal on its own. Traders should look for additional confirmation, such as a break below a key support level or a bearish divergence on the MACD, before initiating a short position.
How will the upcoming US economic data affect BRENT this week?
The upcoming US economic data releases on March 13 (Friday) could have a significant impact on BRENT prices. Stronger-than-expected data could lead to a stronger dollar, putting downward pressure on BRENT, while weaker data could have the opposite effect. Investors should closely monitor these releases for potential trading opportunities.
Track markets in real-time
AI-powered analysis, technical indicators and real-time price data.
Join Our Telegram Channel
Breaking market news, AI analysis and trading signals instantly.
Join Channel