

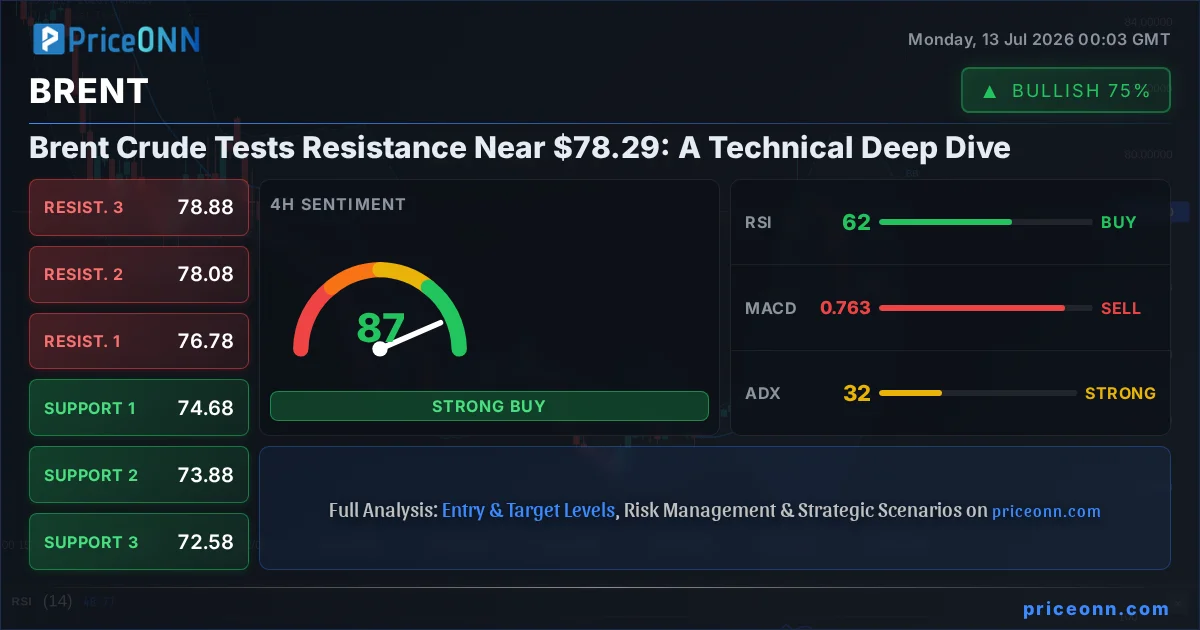
The question on every oil trader's mind right now is whether Brent Crude can sustain its upward momentum past the critical psychological and technical barrier at $78.29. After a significant surge, the market appears to be pausing, a common occurrence when prices approach well-defined resistance levels. The past few days have seen a notable uptick in Brent's price, driven by a confluence of factors including geopolitical tensions and shifting market sentiment. However, as we stand just shy of $78.29, the technical indicators are starting to flash cautionary signals. This isn't just about a single price point; it's about the underlying strength and conviction behind the current move. Understanding the interplay between the immediate price action and the broader technical landscape is crucial for navigating this pivotal moment. The data from the live API shows Brent at $78.29, with an asking price of $78.36, suggesting that sellers are indeed beginning to assert themselves in this zone.
- Brent Crude is currently trading at $78.29, facing immediate resistance.
- The 1-hour RSI at 65.79 indicates bullish momentum is present but approaching overbought territory, signaling a potential pause or pullback.
- The ADX on the 4-hour chart at 31.48 suggests a strong trend is in play, but the daily ADX at 36.03 indicates a dominant downtrend might still be in control despite the recent rally.
- Key resistance is forming around $78.08 (4H) and $78.03 (1H), while immediate support is seen at $75.81 (1H) and $74.68 (4H).
- The Dollar Index (DXY) at 101.09 is showing strength, which typically puts downward pressure on oil prices.
Navigating the $78.29 Juncture: A Trader's Perspective
From a trader's standpoint, the current price action around $78.29 presents a classic risk-reward scenario. The 1-hour chart shows Brent Crude hovering just below the $78.36 asking price, a level that has historically acted as a pivot. The daily chart reveals a strong downtrend with an ADX of 36.03, indicating that while there's been a recent bounce, the underlying trend might still be bearish. This divergence between the short-term bounce and the longer-term trend is where opportunities and risks lie. The fact that the 1-hour RSI is at 65.79 suggests that buyers have been active, but it's not yet in extreme overbought territory, leaving room for further upside if conviction builds. However, the Stochastic on the 1-hour chart, with %K at 58.57 and %D at 32.09, clearly favors a bullish move, crossing upwards. This creates a tension: short-term momentum is bullish, but the longer-term trend indicator (ADX) and the proximity to resistance suggest caution.
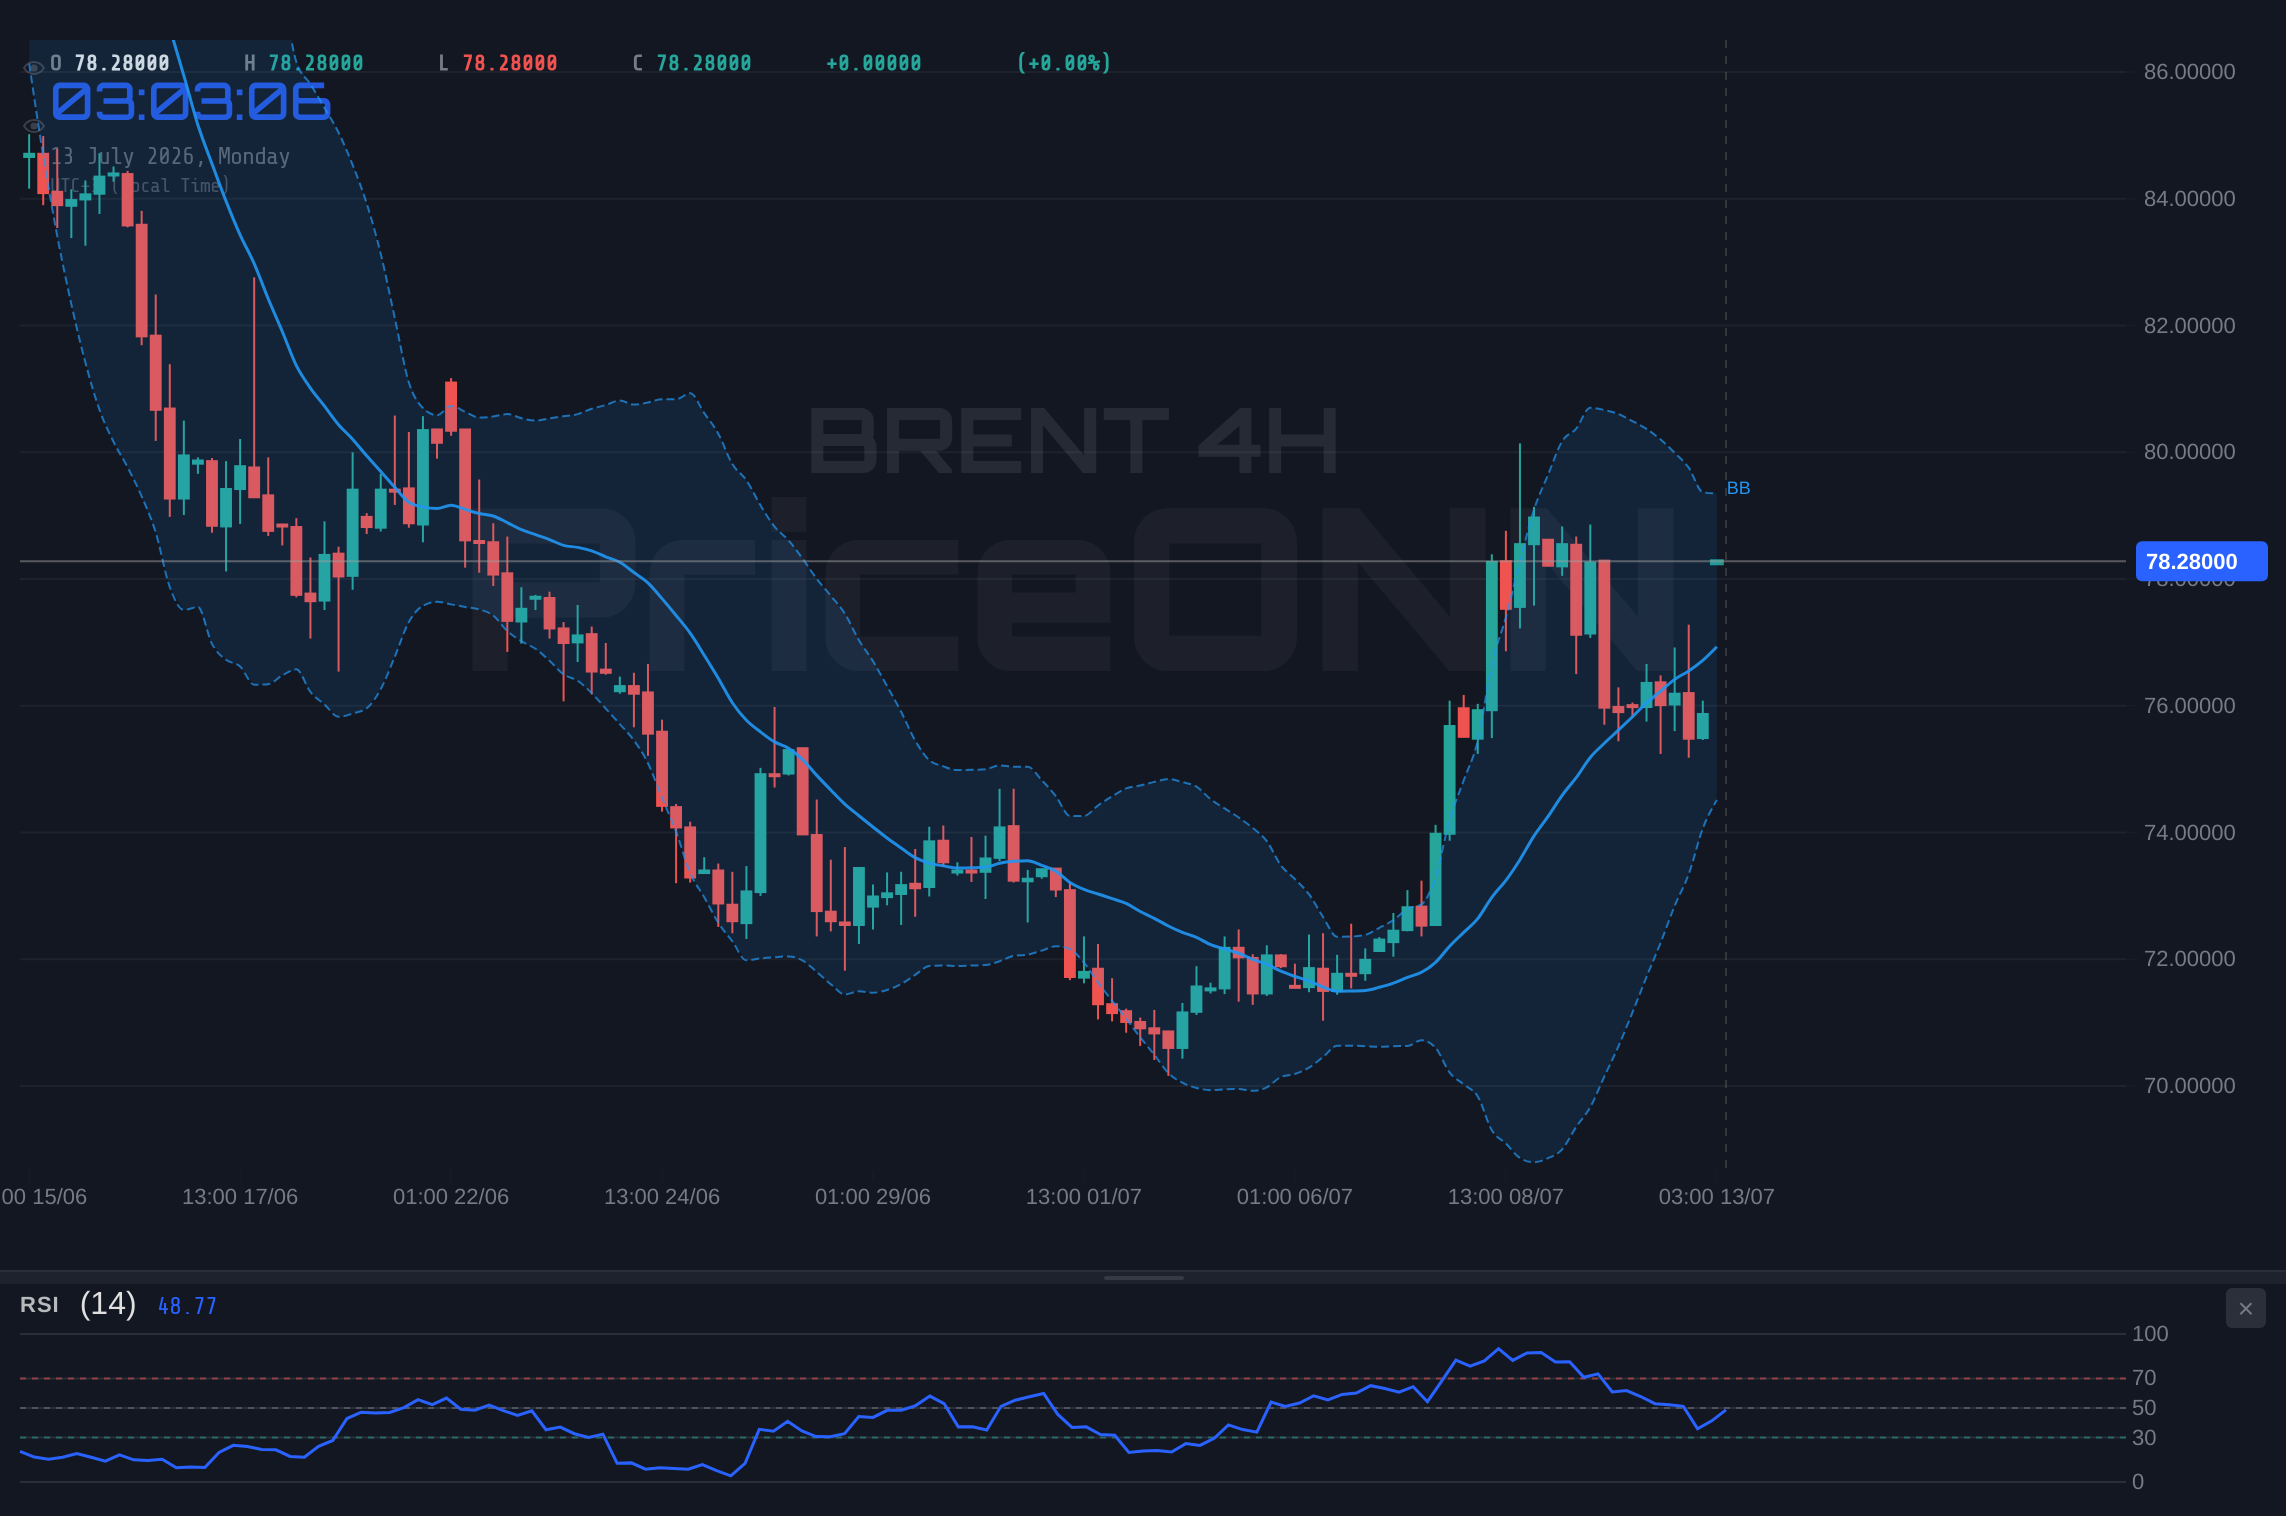
The 4-hour timeframe offers a slightly different perspective. Here, the ADX is at 31.48, confirming a strong trend. The RSI is at 62.23, still comfortably in neutral territory with room to run higher. The Stochastic (%K=39.64, %D=21.28) also shows a bullish signal, crossing upwards. This is where the multi-timeframe analysis becomes critical. The daily chart's strong downtrend (ADX 36.03) clashes with the bullish signals on the 1-hour and 4-hour charts. This suggests that the current move might be a retracement within a larger downtrend, or it could be the precursor to a trend reversal if key resistance levels are decisively broken. The price itself, $78.29, is significant because it sits just below the 4-hour resistance of $78.08 and the 1-hour resistance of $78.03. The ask price of $78.36 shows the market is bumping against this ceiling.
The Influence of Macroeconomic Currents on Brent
It's impossible to analyze Brent Crude in isolation. The broader macroeconomic environment plays a crucial role, and current data points to a strengthening US Dollar Index (DXY). With the DXY currently at 101.09, exhibiting positive momentum across all timeframes, it typically exerts downward pressure on dollar-denominated commodities like oil. A stronger dollar makes oil more expensive for holders of other currencies, potentially dampening demand. This correlation is a significant headwind for any bullish narrative on Brent. Furthermore, recent news indicates that headline inflation is expected to cool, partly due to declining energy prices, as reported by Forex news on July 11th. This suggests that while energy prices have risen recently, the broader inflationary trend might be softening, which could influence central bank policy and, by extension, demand for oil.
The geopolitical landscape also remains a key driver. News from July 11th mentioned escalating energy wars and tensions in the Middle East. Kazakhstan extending its petroleum export ban is another piece of the puzzle, tightening global supply dynamics. These factors contribute to the upward pressure on oil prices, creating a tug-of-war with the macroeconomic headwinds. The market sentiment appears to be caught between supply-side concerns and demand-side worries exacerbated by a strong dollar and potential easing inflation. This complex interplay means that price action around $78.29 needs careful monitoring, as either a geopolitical escalation or a significant shift in DXY could trigger a sharp move.
Technical Indicators: A Deeper Look at Brent's Momentum
Let's dissect the technical indicators across different timeframes to get a clearer picture of Brent's immediate prospects. On the 1-hour chart, the RSI at 65.79, while not extremely overbought, is approaching that zone, suggesting buyers might be losing some steam. The MACD is showing negative momentum, with the MACD line below the signal line, indicating a potential short-term pullback. The Bollinger Bands are positioned above the middle band, showing an upward bias, but the price hugging the upper band can sometimes precede a reversal. The Stochastic (%K=58.57, %D=32.09) provides a clear bullish crossover signal, suggesting upward momentum. However, the ADX at 20.12 points to a moderately strong downtrend on this timeframe, which contradicts the bullish signals from Stochastic and Bollinger.
Shifting to the 4-hour chart, the RSI is at 62.23, still in bullish territory. The MACD is showing negative momentum, but the histogram is above the signal line, suggesting a potential shift. The Bollinger Bands are above the middle band, indicating an upward trend. The Stochastic (%K=39.64, %D=21.28) provides a strong bullish crossover signal. The ADX at 25.27 confirms a strong trend, but the context here is crucial: is it a strong uptrend or a strong downtrend? The daily chart's ADX of 36.03 and RSI of 45.09 suggest the latter. This conflict in signals across timeframes is precisely why patience is key. A decisive break above $78.36 (the current ask price) on increased volume could signal a bullish continuation, while a failure to do so and a subsequent drop below $75.81 (1H support) would reinforce the bearish case.
The daily chart presents the most significant challenge to the bulls. An RSI of 45.09 indicates a bearish lean, and the MACD is showing positive momentum but is still below the signal line in some readings, hinting at potential weakness. The Bollinger Bands are above the middle band, suggesting an upward bias on this timeframe as well, but the ADX at 36.03 clearly points to a strong downtrend. The Stochastic (%K=75.75, %D=51.13) is in overbought territory and showing a bullish crossover, which, in a strong downtrend, can often lead to a sharp reversal or a deeper pullback before continuing lower. This daily perspective is vital; it suggests that the rallies might be opportunities for sellers to re-enter the market, especially if the price fails to decisively break key resistance levels like $78.03.
The Importance of Support and Resistance in Brent Trading
Understanding support and resistance levels is paramount when trading Brent Crude, especially around a price point like $78.29. On the 1-hour chart, immediate support is found at $75.81, followed by $75.69 and $75.55. Resistance levels to watch are $78.03, $78.08, and $78.21. The current price action is essentially battling the $78.03-$78.36 range. A confirmed break above the 1-hour resistance at $78.03, and more importantly above the 4-hour resistance at $78.08, would be a strong bullish signal. Conversely, a failure to breach these levels and a subsequent drop below the 1-hour support at $75.81 would likely trigger further selling pressure.
On the 4-hour timeframe, support lies at $74.68, $73.88, and $72.58. Resistance is marked at $76.78, $78.08, and $78.88. The current price of $78.29 is nestled between these 4-hour levels, highlighting the sensitivity of the current market. A move towards the $78.88 resistance could occur if bullish momentum strengthens, but a break below $74.68 would invalidate the short-term bullish setup and likely send prices lower towards $73.88.
The daily chart provides the longer-term context. Support is seen at $74.61, $73.31, and $71.19. Resistance is identified at $78.03, $80.15, and $81.45. The current price of $78.29 is hovering just below the first daily resistance level. This reinforces the idea that breaking above $78.03 and then $80.15 is a significant hurdle for the bulls. The fact that the current price ($78.29) is so close to the 1-hour ($78.03) and 4-hour ($78.08) resistance zones suggests that a battle is imminent. The outcome of this battle will likely dictate the short-to-medium term direction for Brent Crude.
Bearish Scenario: Resistance Holds Firm
65% ProbabilityConsolidation Scenario: Range-Bound Action
25% ProbabilityBullish Scenario: Breakout Confirmation
10% ProbabilityThe Road Ahead: What to Watch for in Brent Crude
The current technical setup for Brent Crude, trading at $78.29, is complex, with conflicting signals across different timeframes. The short-term charts suggest bullish momentum, driven by recent price action and a strong trend on the 4-hour chart (ADX 31.48). However, the daily chart paints a more cautious picture, with a dominant downtrend indicated by the ADX of 36.03 and a less optimistic RSI of 45.09. The overarching influence of a strengthening dollar (DXY at 101.09) adds another layer of complexity, typically acting as a headwind for oil prices. Geopolitical risks and supply-side issues remain supportive factors, creating a volatile environment where sharp moves are possible in either direction.
For traders, the immediate focus should be on the price action around the $78.03-$78.36 resistance zone. A failure to break decisively above this area, coupled with a drop below the 1-hour support at $75.81, would likely confirm the bearish scenario, targeting lower levels. Conversely, a strong, high-volume breakout above $78.88 could signal a more significant trend change, although this appears to be the lower probability outcome given the daily chart's structure. The market is at a critical juncture, and disciplined risk management will be paramount. Watching for confirmation signals, particularly increased volume on breakouts and sustained closes above key levels, will be essential for making informed trading decisions.
Frequently Asked Questions: BRENT Analysis
What happens if BRENT breaks decisively above the $78.88 resistance level?
A sustained close above $78.88 on the 4-hour chart, confirmed by significant trading volume, would invalidate the current bearish lean and open the door for a bullish scenario. This could see prices target the daily resistance levels at $80.15 and potentially $81.45. However, this is considered a lower probability outcome given the daily chart's downtrend.
Should I consider selling BRENT at the current $78.29 levels given the RSI at 65.79?
Selling BRENT at $78.29 requires careful risk management. While the 1-hour RSI at 65.79 suggests some upward momentum is present, it's not yet in extreme overbought territory. A more prudent approach might be to wait for a clear bearish confirmation, such as a break below the 1-hour support at $75.81, before initiating a short position. Selling here without confirmation carries a higher risk.
Is the ADX reading of 36.03 on the daily chart a strong sell signal for BRENT Crude?
An ADX value of 36.03 on the daily chart strongly indicates a powerful trend is in play. In this context, it signifies a strong downtrend. While not a direct sell signal on its own, it suggests that any rallies, such as the current move towards $78.29, might be temporary pullbacks within the larger bearish trend, offering potential selling opportunities on confirmation.
How will the strong DXY at 101.09 likely affect BRENT Crude prices this week?
A strong DXY, currently at 101.09, typically exerts downward pressure on dollar-denominated commodities like Brent Crude. This is because a stronger dollar makes oil more expensive for buyers using other currencies, potentially reducing demand. Expect this macroeconomic factor to act as a headwind against any significant bullish moves in Brent unless offset by strong bullish supply-side news or geopolitical events.
The market at $78.29 for Brent Crude is a critical test of resilience. While short-term indicators flash bullish signals, the longer-term technicals and macroeconomic backdrop suggest caution. Patience and disciplined execution will be the hallmarks of successful trading in this environment. The battle between supply-driven support and demand-driven resistance, amplified by dollar strength, will likely define the next price move. Keep a close eye on volume and price action around the key levels identified.
| Indicator | Value | Signal | Interpretation |
|---|---|---|---|
| RSI (14) | 65.79 | Neutral | Approaching overbought, suggests potential pause or pullback. |
| MACD | Negative Momentum | Bearish | Momentum is currently favoring sellers on 1H chart. |
| Stochastic | K:58.57, D:32.09 | Bullish | Bullish crossover indicates potential upward momentum. |
| ADX | 20.15 | Neutral | Moderate trend strength on 1H, indicating a developing trend. |
| Bollinger Bands | Upper Band | Watch | Price near upper band suggests potential for reversal or continuation. |
Track markets in real-time
AI-powered analysis, technical indicators and real-time price data.
Join Our Telegram Channel
Breaking market news, AI analysis and trading signals instantly.
Join Channel