
BRENT Surges to $98.73: Iran Tensions Fuel Breakout?
BRENT crude oil jumps to $98.73 amid escalating geopolitical tensions involving Iran, sparking concerns about Eurozone stability. Is $100 the next target?
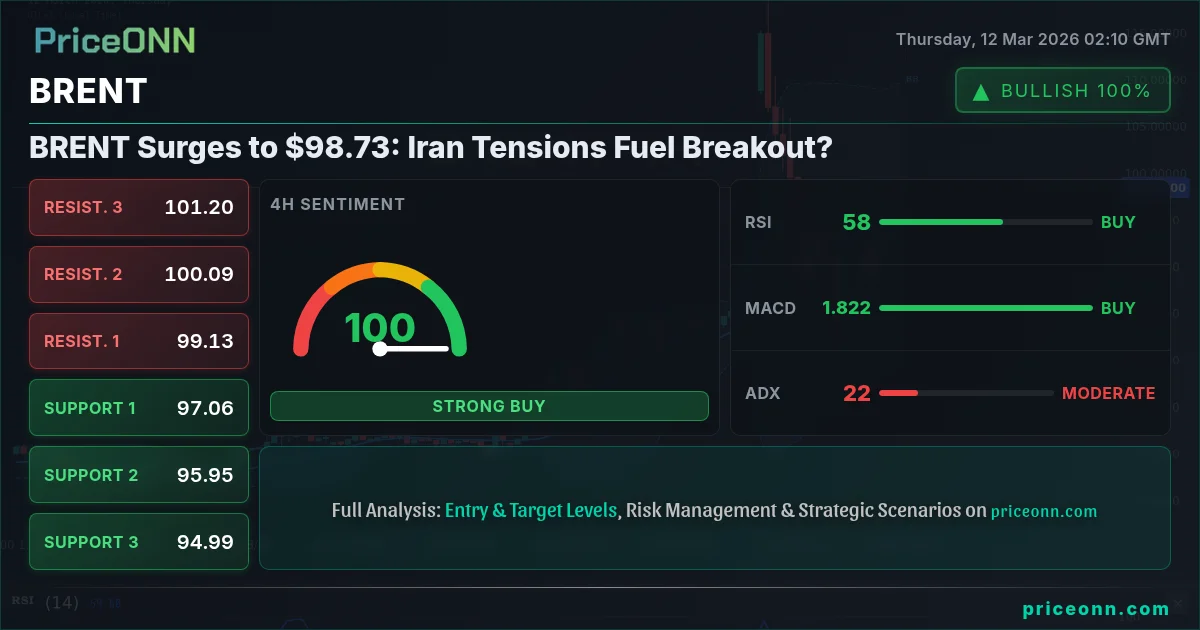
BRENT crude oil is trading at $98.73, a level that has traders on high alert. The surge is primarily fueled by escalating geopolitical tensions in the Middle East, specifically involving Iran, which have raised concerns about potential supply disruptions. The question now is: can BRENT break above $100, or will resistance hold firm?
- BRENT is currently trading at $98.73, driven by geopolitical risks and supply concerns.
- Key support is seen at $93.08 on the 1-hour timeframe, while resistance looms at $103.41 on the daily.
- The daily RSI at 85.07 signals overbought conditions, suggesting a potential pullback.
- Geopolitical tensions and upcoming US inflation data will significantly influence BRENT's direction.
The Bull Case: Geopolitical Risks and Supply Concerns
The primary driver behind BRENT's recent surge is the heightened geopolitical risk stemming from tensions involving Iran. The news that Crude Oil is eyeing $90 as Iran Tensions Threaten Eurozone Stability, as reported on March 11, underscores this factor. Any escalation could lead to supply disruptions, pushing prices higher. From a technical perspective, the daily chart shows a strong uptrend, with the ADX at 51.79 indicating a powerful trend. The daily stochastic oscillator, although signaling a potential pullback with K=46.82 and D=71.35, has not yet confirmed a reversal. A daily close above $97.48 could open the door for a test of the $100 level.
Furthermore, the recent rise in oil prices is correlated with a weakening dollar. With the DXY index at 99.11, the dollar's strength has been capped, providing some upward pressure on commodity prices. Additionally, the rise in BRENT prices comes despite the IEA's record reserve release, as reported on March 11th, indicating that supply concerns are outweighing the impact of increased reserves. This suggests that the market believes the supply crunch is persistent and not easily resolved by reserve releases. The weekly chart also paints a bullish picture, with the price consistently making higher highs and higher lows.
The Bear Case: Overbought Conditions and Economic Slowdown
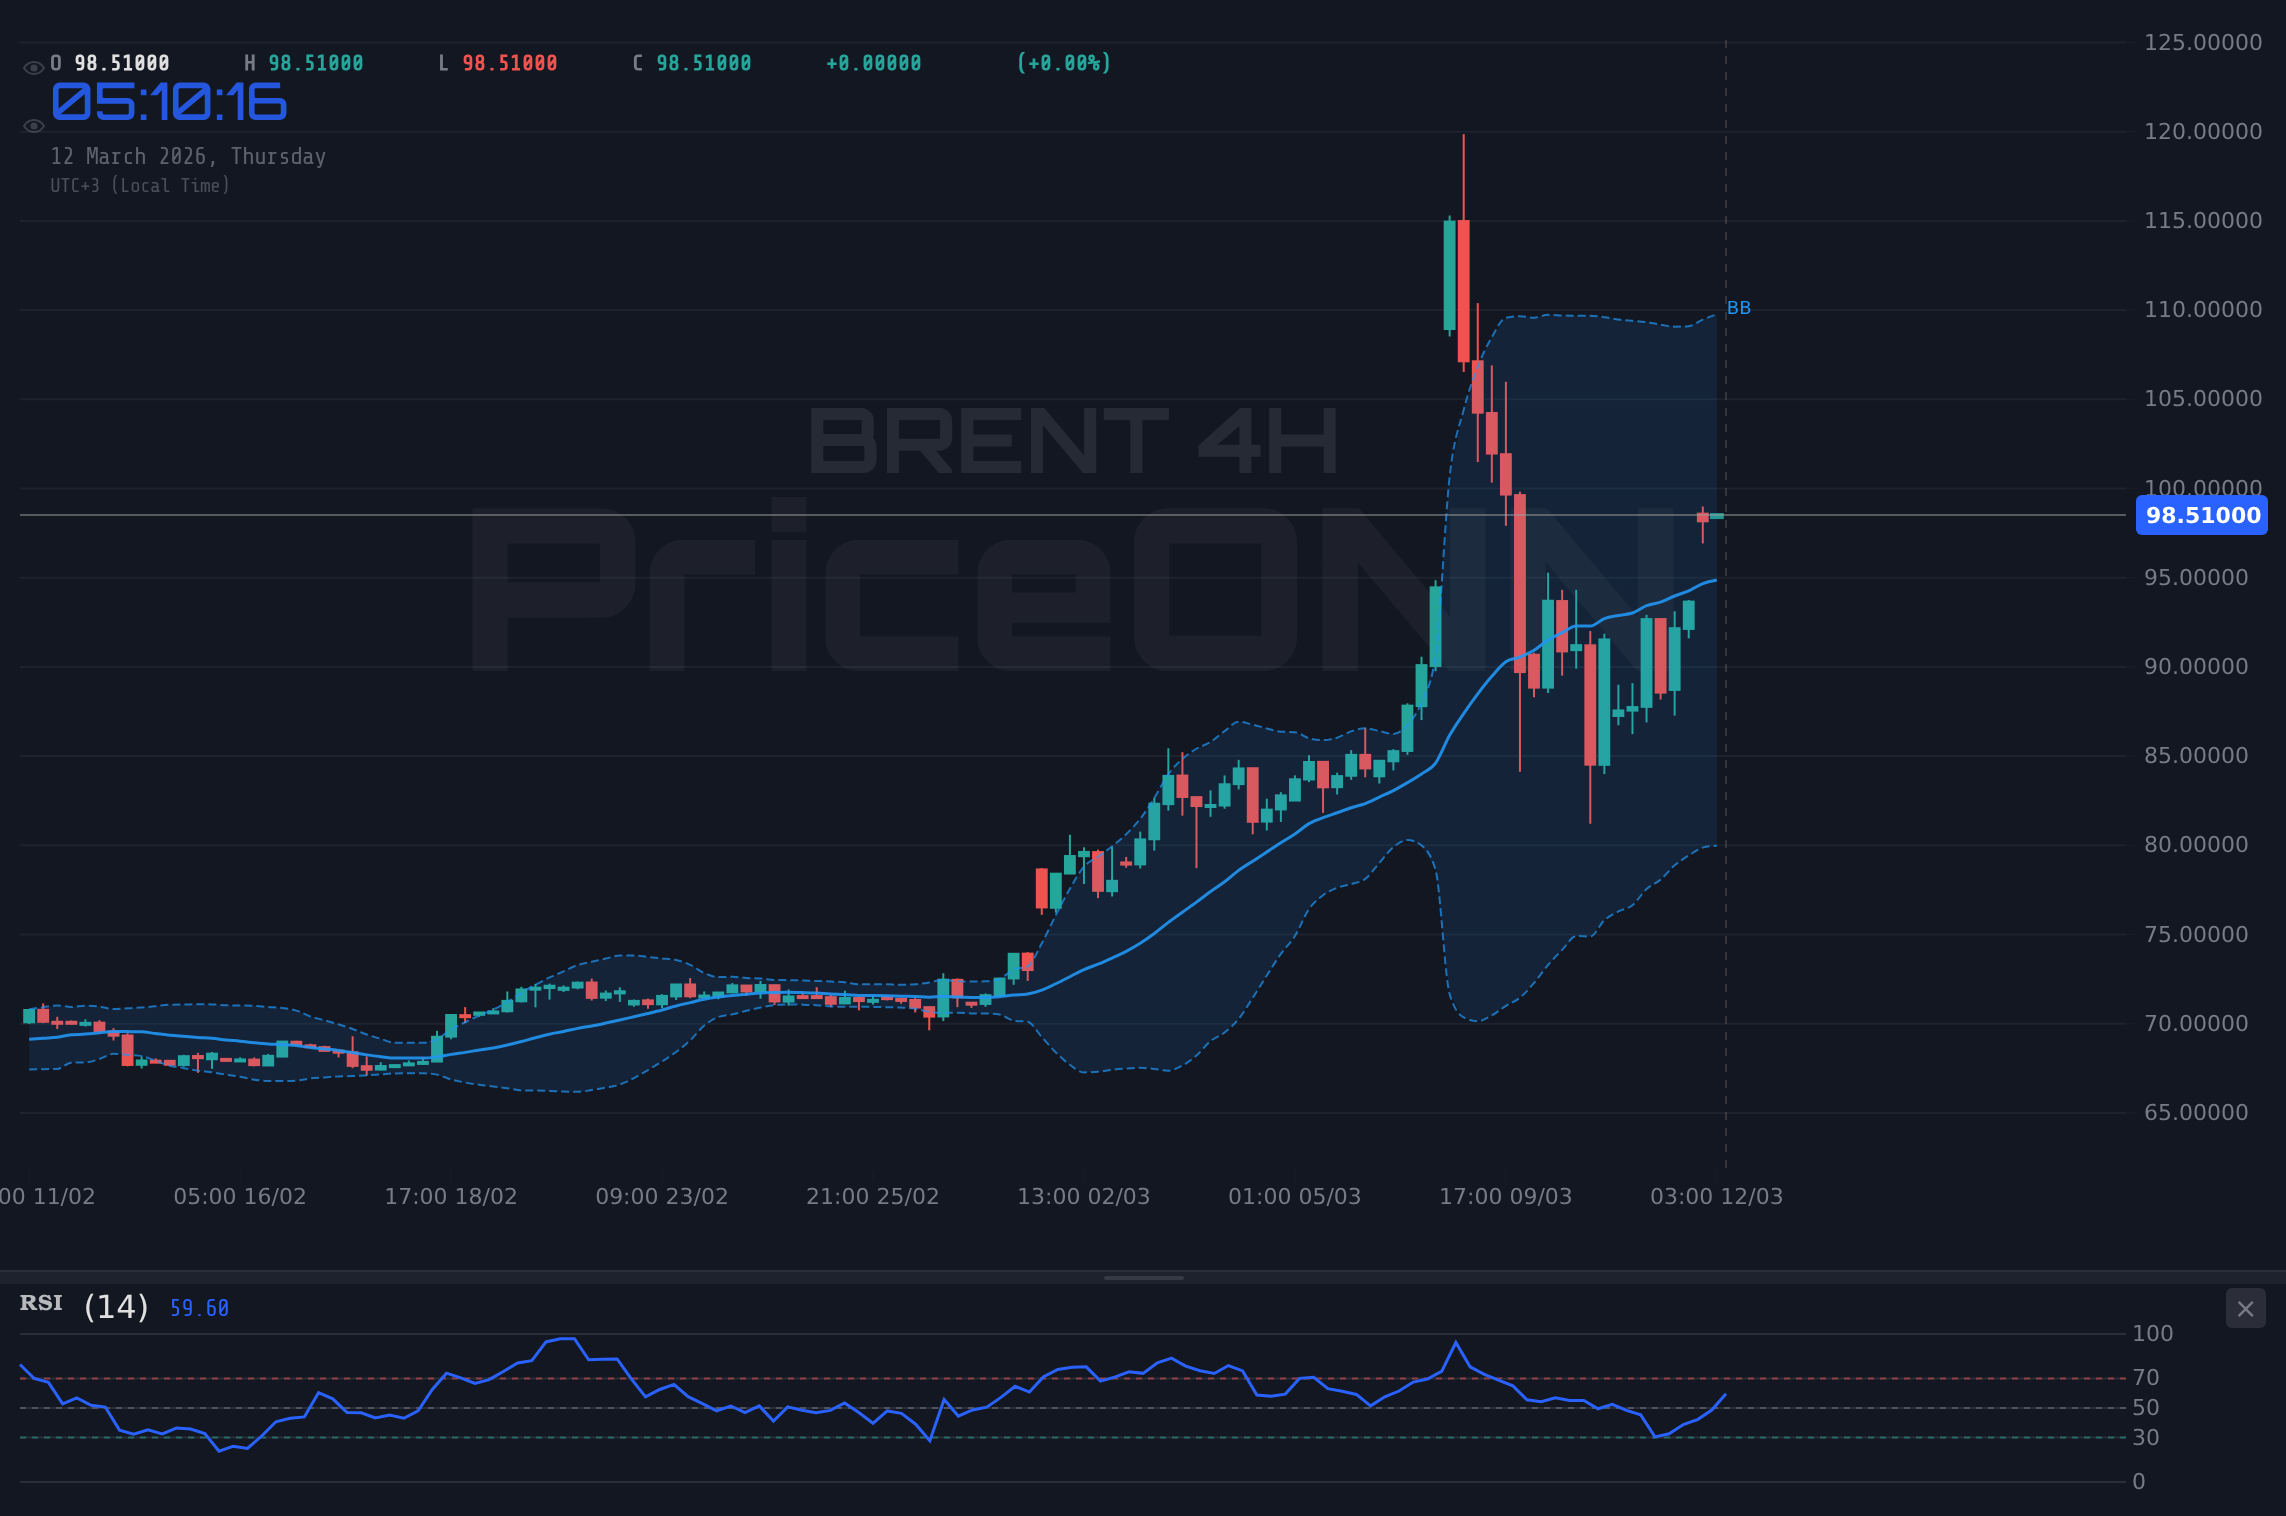
Despite the bullish factors, there are valid reasons to be cautious. The daily RSI at 85.07 indicates that BRENT is in overbought territory, suggesting a potential pullback or consolidation. The 1-hour chart also shows a neutral trend, with the RSI at 67.39 and the stochastic oscillator in overbought territory with K=97.89 and D=88.47. This suggests that the short-term momentum may be waning. Furthermore, concerns about a potential economic slowdown could curb demand, putting downward pressure on prices. The recent weakness in equity markets, with the S&P 500 declining by 1.02% to 6721.8, reflects this concern. A break below the 1-hour support at $93.08 could signal a deeper correction.
Moreover, upcoming US inflation data could also play a significant role. If US Inflation Watch triggers a Fed Rate Hike, the dollar could strengthen, putting downward pressure on BRENT. The daily MACD histogram, although still positive, shows a slight decrease in momentum, suggesting that the buying pressure may be easing. From a historical perspective, similar overbought conditions have often led to sharp corrections in BRENT prices. During the 2008 financial crisis, for example, BRENT prices saw significant declines following periods of extreme overbought conditions. Therefore, traders should be vigilant and manage their risk accordingly.
Technicals as Tiebreaker: Multi-Timeframe Analysis
A multi-timeframe analysis provides a more nuanced view. On the 1-hour chart, the trend is neutral, with the ADX at 22.57 indicating a moderate trend. The RSI is at 67.39, suggesting that bulls are losing steam, but not yet in full reversal territory. The 4-hour chart shows a bullish trend, but the MACD histogram is displaying negative momentum, and the stochastic oscillator is in overbought territory. On the daily chart, the trend is strongly bullish, but the RSI is in overbought territory, and the stochastic oscillator is signaling a potential pullback. This mix of signals suggests that caution is warranted, and traders should wait for confirmation before entering new positions.
Scalpers should watch for a break below the 1-hour support at $93.08, which could signal a short-term selling opportunity. Swing traders should monitor the 4-hour chart for a potential pullback towards the middle Bollinger Band, which could provide a buying opportunity. Long-term investors should focus on the daily chart and consider adding to their positions on pullbacks towards key support levels. Historically, BRENT has shown a strong correlation with geopolitical events. During the Gulf War and the Iraq War, for example, BRENT prices experienced significant spikes due to supply disruptions. Therefore, traders should closely monitor geopolitical developments and their potential impact on BRENT prices.
Correlation Analysis: DXY, Equities, and Geopolitical Factors
BRENT crude oil exhibits complex correlations with various asset classes. Typically, a stronger dollar (DXY) puts downward pressure on BRENT, as commodities are often priced in dollars. However, geopolitical tensions can override this inverse relationship, driving up BRENT prices despite a strong dollar. The current DXY level of 99.11 is contributing some pressure, but the tensions in the Middle East are proving to be a stronger force. Equities also play a role. A risk-off environment, characterized by declining equity prices (S&P 500 at 6721.8), can lead to increased demand for safe-haven assets, potentially diverting capital away from commodities like BRENT. However, the inflationary pressures stemming from higher oil prices can also negatively impact equities, creating a feedback loop.
Furthermore, the surge in BRENT prices is contributing to broader inflationary pressures, which could prompt central banks to tighten monetary policy. The US CPI data, expected on March 11th, will be closely watched for signs of rising inflation. If the data comes in higher than expected, the Fed may be forced to raise interest rates, which could strengthen the dollar and put downward pressure on BRENT. The key is to monitor the interplay between geopolitical risks, economic data, and central bank policy decisions. This requires a holistic approach to market analysis, considering both technical and fundamental factors.
Trade Recommendation: WATCH_ZONE - Patience is Key
Given the conflicting signals and heightened geopolitical risks, the current trade recommendation is WATCH_ZONE. The ADX at 22.19 indicates a moderate trend, and there is only partial indicator alignment. The stochastic oscillator in the extreme zone suggests that entry timing is uncertain. A daily close above $97.48 would open the door for a potential test of the $100 level. However, traders should wait for confirmation before entering new long positions. Conversely, a break below the 1-hour support at $93.08 could signal a deeper correction, providing a short-term selling opportunity. Therefore, patience and disciplined risk management are crucial in this environment.
Traders should focus on the key level to watch, which is $97.48. A sustained break above this level, confirmed by increased volume and positive momentum, would signal that the bullish trend is likely to continue. Conversely, a failure to break above this level, followed by a break below the 1-hour support at $93.08, would suggest that the bullish momentum is waning, and a correction is likely. Until a clear breakout or breakdown occurs, traders should remain on the sidelines and wait for a more favorable setup. The key is to manage risk and protect capital, while waiting for the market to provide a clear signal.
- BRENT is currently trading at $98.73, driven by geopolitical risks and supply concerns.
- Key support is seen at $93.08 on the 1-hour timeframe, while resistance looms at $103.41 on the daily.
- The daily RSI at 85.07 signals overbought conditions, suggesting a potential pullback.
- Geopolitical tensions and upcoming US inflation data will significantly influence BRENT's direction.
Frequently Asked Questions: BRENT Analysis
What happens if BRENT breaks above $97.48 resistance?
A break above the $97.48 resistance level would likely open the door for a test of the $100 level. This scenario would be supported by increased volume and positive momentum on the daily chart, signaling a continuation of the bullish trend.
Should I buy BRENT at current levels of $98.73 given the RSI at 85.07?
Given the RSI at 85.07 indicating overbought conditions, buying at current levels carries increased risk. It would be prudent to wait for a pullback towards key support levels, such as $93.08 on the 1-hour chart, before considering new long positions.
Is the MACD signal on the 1-hour chart a reliable indicator for BRENT?
The MACD signal on the 1-hour chart shows negative momentum, which suggests that the short-term buying pressure may be easing. However, it is important to consider the broader context and confirm the signal with other indicators and price action before making trading decisions.
How will the US CPI data affect BRENT this week?
If the US CPI data comes in higher than expected, it could prompt the Fed to raise interest rates, which could strengthen the dollar and put downward pressure on BRENT. Conversely, if the data is lower than expected, it could weaken the dollar and provide some upward pressure on BRENT.
Technical Outlook Summary
| Indicator | Value | Signal |
|---|---|---|
| RSI (14) | 85.07 | Overbought |
| MACD Histogram | Positive | Neutral |
| Stochastic | 46.82 | Overbought |
| ADX | 51.79 | Strong Trend |
| Bollinger | Upper Band | Watch |
Key Levels
Support Levels
Resistance Levels
Track markets in real-time
AI-powered analysis, technical indicators and real-time price data.
Join Our Telegram Channel
Breaking market news, AI analysis and trading signals instantly.
Join Channel