

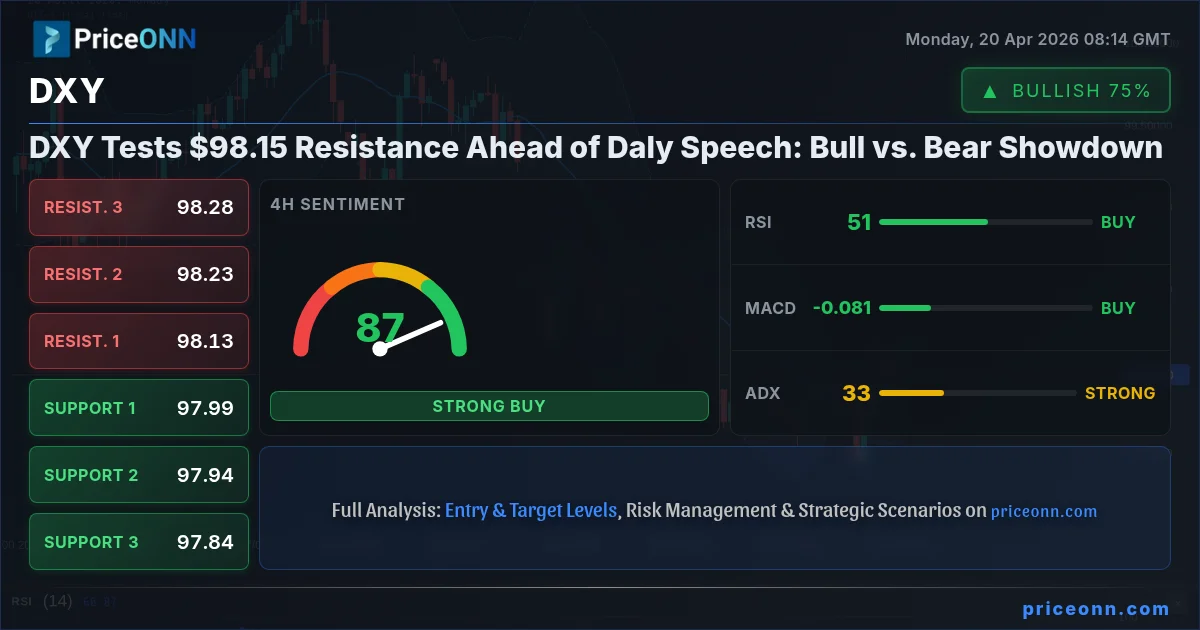
The Dollar Index (DXY) is currently locked in a tense battleground, hovering just below the critical $98.15 resistance level. As traders brace for a speech from San Francisco Fed President Mary Daly, the market is sharply divided. Bulls are pushing for a decisive breakout above this key technical barrier, citing persistent dollar strength and a robust trend on longer timeframes. Conversely, bears are looking for signs of exhaustion, pointing to conflicting signals on shorter timeframes and the ever-present risk of a broader market shift. This standoff at $97.99 is more than just a technical flick; it's a pivotal moment reflecting the ongoing debate about the dollar's near-term trajectory amidst shifting economic expectations and geopolitical undercurrents.
- The DXY is currently trading at $97.99, testing resistance at $98.15.
- On the 1-hour chart, RSI at 58.12 shows upward momentum, but Stochastic K=65.16 signals potential pullback.
- The 4-hour chart shows strong ADX at 33.01, indicating a significant trend, though daily RSI at 42.19 suggests bearish pressure.
- Key levels to watch are support at $97.92 and resistance at $98.05 on the 1H, with daily support at $97.48 and resistance at $98.15.
- Upcoming commentary from Fed's Daly adds uncertainty, potentially triggering volatility around current price levels.
The market's current posture on the DXY is a fascinating study in contrasts. On the daily chart, the overall trend appears neutral, yet the ADX reading of 26.24 still indicates a solid downward trend, albeit with moderate strength. This suggests that while the dollar has seen some recent upward movement, the underlying pressure might still be to the downside. However, the 1-hour chart paints a different picture, showing a neutral trend with moderate strength (ADX 21.22) and a clear bullish signal from the MACD, which is trading above its signal line with positive momentum. This divergence across timeframes is precisely what creates this tense consolidation phase. Traders are essentially caught between the lingering bearish sentiment on the daily and the more immediate bullish push on the hourly. This is where seasoned traders look for confirmation, waiting for a decisive move that aligns the longer-term picture with the short-term signals.
The narrative for the bulls hinges on the strength observed in shorter timeframes and the dollar's ability to hold ground despite broader market sentiment shifts. The 1-hour chart is particularly encouraging for dollar bulls. With an RSI of 58.12, the index is comfortably in neutral territory, showing room for further upside before hitting overbought conditions. More importantly, the MACD is displaying positive momentum, trading above its signal line. This technical configuration suggests that the recent upward push has underlying strength. Even the Stochastic oscillator, while showing a K=65.16 and D=73.54 (a slight bearish signal as K crosses below D), is still in a zone that hasn't reached extreme overbought levels, implying that a short-term pullback might be a healthy consolidation rather than the start of a reversal. The DXY's ability to maintain its current levels, especially holding above the 1H support at $97.92, is seen as a testament to its resilience. This bullish case is further bolstered by the fact that major currencies like EURUSD and GBPUSD are showing signs of weakness on their 1-hour charts, implicitly supporting the DXY.
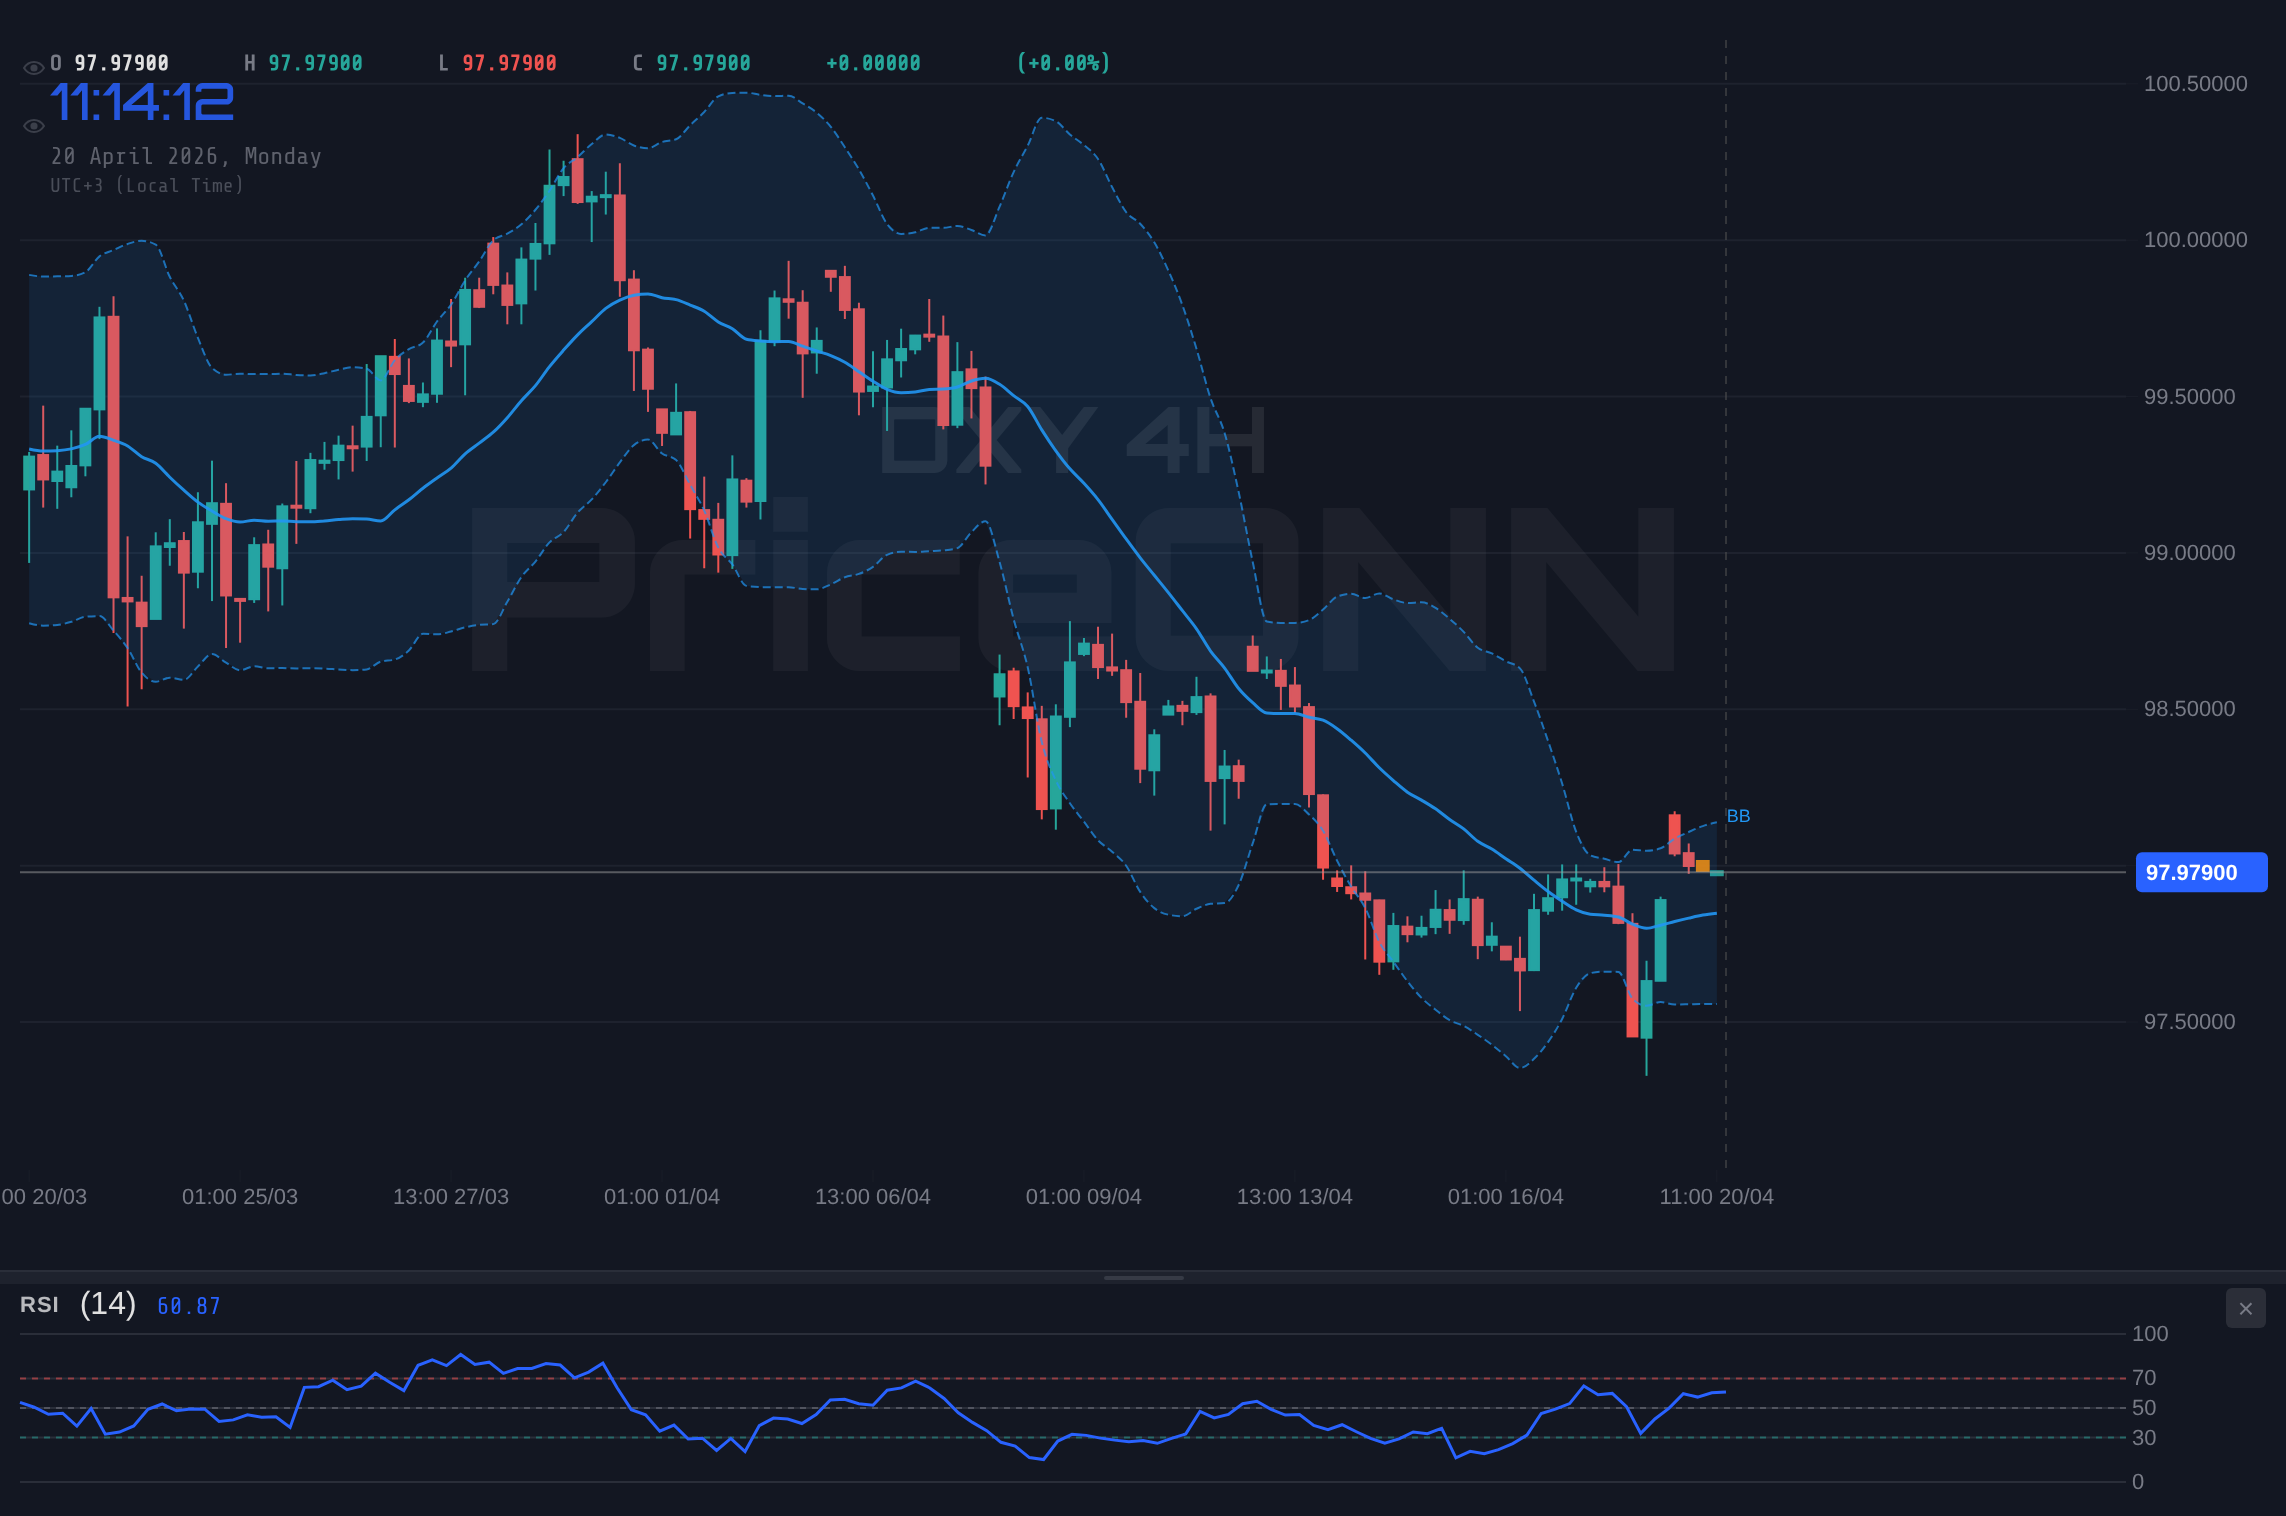
However, the bears are not without their ammunition. The daily chart presents a more cautious outlook. While the 1-hour chart shows positive momentum, the daily RSI sits at 42.19, firmly in neutral territory but leaning towards a bearish bias as it hasn't broken decisively above the 50 level. This suggests that the broader upward momentum might be losing steam. Furthermore, the daily MACD is currently negative, trading below its signal line, which is a classic bearish indicator. The Stochastic on the daily chart, with K=28.72 and D=11.68, is showing a bullish crossover, but it's emerging from oversold territory, which can sometimes lead to weak rallies before a further decline. The daily ADX at 26.24 indicates a strong downward trend, suggesting that the current upward move might just be a temporary correction within a larger bearish phase. The bears are watching the $97.48 support level on the daily chart intently; a break below this could signal a more significant decline. They also point to the general weakness in risk assets like SP500 and Nasdaq, which often correlates inversely with the DXY, as a sign that safe-haven demand for the dollar might not be as strong as the price action suggests.
The correlation with other markets is a crucial piece of this puzzle. While the DXY is showing signs of strength, the broader market sentiment is mixed. The SP500 is trading at 6572.87, showing a daily gain of 0.74%, indicating some risk appetite. However, its 1-hour RSI at 70.95 is bordering on overbought, and the MACD shows negative momentum, suggesting potential headwinds for equities. The Nasdaq100, currently at 26481.27, is down 0.75% on the day, highlighting weakness in the tech sector. This divergence between the S&P 500's resilience and the Nasdaq's dip adds another layer of complexity. Traditionally, a strong DXY would weigh on equities, but the current price action doesn't present a clear correlation. The Brent crude oil price at $96.70 is surging, up 4.61%, which typically fuels inflation concerns and could indirectly support the dollar as a hedge, but the immediate impact on the DXY is not straightforward. The interplay between these assets is dynamic, and traders are carefully dissecting these correlations to gauge the true underlying sentiment.
The Bull Case: Dollar Strength Persists
For the bulls, the immediate future of the DXY looks promising, primarily driven by the technical setup on the 1-hour chart and the general resilience of the US dollar. The current price of $97.99 is finding support, and the immediate resistance at $98.05 and $98.15 is being tested. A decisive close above $98.15 on the 1-hour chart would be a strong signal for continuation. This bullish scenario is supported by the MACD's positive momentum and the RSI hovering in a healthy neutral zone, indicating room for growth. The Stochastic oscillator's K line is above the D line, suggesting upward momentum, even if it's nearing a potential crossover. This technical picture suggests that the dollar is poised to continue its upward trend, potentially challenging higher resistance levels. The fact that the DXY is showing strength while EURUSD is struggling below 1.17617 and GBPUSD is below 1.35025 further reinforces the dollar's dominance in the short term. This suggests that market participants are favoring the greenback, perhaps anticipating a more hawkish tone from the Fed or seeking refuge in the dollar amidst global economic uncertainties.
Furthermore, the underlying economic context, while debated, offers some support for the dollar. Recent US economic data, though mixed, has not been overwhelmingly negative. While some indicators might be showing deceleration, others, particularly in the labor market, have remained robust. This resilience can give the Federal Reserve room to maintain a cautious stance on monetary policy, which is generally supportive of a stronger currency. The market is constantly digesting news regarding potential Fed rate hikes or prolonged periods of higher rates, and any hint of such a policy direction would significantly boost the DXY. The upcoming speech by Mary Daly, while adding an element of uncertainty, could also provide the catalyst for a bullish move if her remarks are interpreted as leaning towards tighter monetary policy. Bulls are keenly watching her commentary for any signals that could confirm their thesis of continued dollar strength. They believe that if the DXY can successfully consolidate above $97.99 and break through $98.15, it could set the stage for a move towards the next significant resistance at $98.42 on the daily chart.
The upcoming speech by Fed's Daly introduces significant event risk. Traders should be prepared for increased volatility and potential sharp price swings in the DXY around this announcement. Tight risk management is advised.
From a longer-term perspective, the bulls can point to the 4-hour chart, which shows a strong upward trend with an ADX of 32.9. Although the 1-hour and daily charts present a more mixed picture, the strength on the 4-hour timeframe suggests that the underlying trend might still favor the dollar. The support levels identified on the 4-hour chart at $97.358, $97.178, and $97.076 provide a solid floor. A failure to hold these levels would invalidate the bullish short-term thesis, but as long as the DXY remains above them, the possibility of a renewed upward push remains. The bulls are looking for a sustained move above $98.15, followed by consolidation, which would then target the daily resistance levels. They are betting that the dollar's inherent strength, driven by its global reserve status and the Fed's policy outlook, will ultimately prevail over short-term market fluctuations and conflicting technical signals.
The Bear Case: Dollar Exhaustion Looms
On the other side of the coin, the bears see the current price action as a potential trap, a temporary pause before a more significant dollar decline. Their argument is primarily anchored in the daily chart's technicals and the broader macroeconomic environment. The daily RSI at 42.19, while not deeply oversold, indicates a lack of strong buying pressure. The negative MACD momentum on the daily chart is a significant bearish signal, suggesting that the downtrend might be reasserting itself. While the Stochastic is showing a bullish crossover, it's emerging from very low levels, which often precedes weaker upside moves. The bears are particularly focused on the daily support at $97.48. A confirmed break below this level, especially with increasing volume, would signal a shift in sentiment and open the door for a deeper correction, potentially towards the $97.06 and $96.80 support levels. They argue that the short-term bullish signals on the 1-hour chart are simply noise within a larger weakening trend.
The bears also highlight the mixed signals from US economic data. While some aspects remain strong, there are increasing signs of a slowdown. Falling consumer sentiment and potential revisions to GDP figures could be early indicators of economic headwinds. If upcoming data releases, such as the forecasted figures for USD consumer sentiment or manufacturing indices, come in weaker than expected, it could significantly dampen the bullish outlook for the dollar. Furthermore, the global economic picture is complex. While the US economy shows resilience, other major economies are also showing signs of recovery or stability, which could reduce the relative attractiveness of the dollar. The recent news about a surprise trade surplus in New Zealand, for instance, indicates pockets of strength outside the US, potentially diverting some capital flow away from the greenback. The bears believe that the market might be overestimating the Fed's hawkishness, especially if inflation shows signs of cooling, which could lead to a more dovish policy stance and a weaker dollar.
Geopolitical factors also play into the bears' hands. While the Strait of Hormuz situation has seen some volatility, the broader easing of Middle East tensions mentioned in recent news could reduce the safe-haven demand for the dollar. If global risk appetite continues to grow, as suggested by the positive moves in SP500 (despite Nasdaq's weakness), investors might rotate away from the dollar towards riskier assets. The bears are watching the correlation between the DXY and equity markets closely. If the DXY fails to hold its gains while equities rally, it would be a strong bearish signal. They are also mindful of the upcoming economic data releases, especially those related to inflation and growth, as any negative surprises could quickly shift the narrative and trigger a sell-off in the dollar. Their strategy involves waiting for a clear break of key support levels, confirming the bearish thesis and setting targets towards the lower end of the daily range.
Traders are closely monitoring the interplay between the DXY's price action and the performance of EURUSD and GBPUSD. A sustained drop in these pairs below their key support levels, even as DXY consolidates, would strengthen the bearish case for the dollar.
Navigating the Crosscurrents: Scenarios and Outlook
Given the conflicting signals across different timeframes and the looming uncertainty from Fed speak, the DXY is currently in a precarious position. The $97.99 price point represents a critical juncture where both bullish and bearish forces are battling for control. The immediate future will likely be dictated by how key technical levels hold and the narrative that emerges from upcoming economic data and central bank commentary.
Bearish Scenario: Dollar Retreats Below Key Support
60% ProbabilityNeutral Scenario: Consolidation Around $98.00
25% ProbabilityBullish Scenario: Breakout Above Resistance
15% ProbabilityThe technical indicators provide a mixed bag of signals, reflecting the current indecision in the market. On the 1-hour chart, the RSI at 58.12 suggests some upward momentum, but the Stochastic crossover (K=65.16, D=73.54) hints at potential consolidation or a short-term dip. The MACD is showing positive momentum, which is a bullish sign for the immediate term. However, stepping back to the daily chart, the RSI at 42.19 leans bearish, and the MACD is still in negative territory, indicating that the longer-term trend might be weakening. The ADX readings are also telling: a strong 33.01 on the 4-hour chart suggests a significant trend is in play, but the daily ADX at 26.24 indicates a moderately strong downward trend. This confluence of conflicting signals means that confirmation is key. A bullish scenario requires a break above $98.15, ideally supported by positive news or data. A bearish scenario hinges on holding below resistance and eventually breaking key daily support levels like $97.48.
The upcoming commentary from Fed's Mary Daly is the wildcard. Her remarks could either reinforce the narrative of a strong dollar, potentially triggering a breakout above $98.15, or signal a more cautious approach, validating the bearish concerns and leading to a decline towards $97.48. Traders will be dissecting every word for clues about the Fed's future policy path, inflation outlook, and the overall health of the US economy. The market's reaction to this speech will likely be amplified due to the current technical tension at resistance. Volatility is almost guaranteed. For those looking to trade the DXY, patience and strict risk management are paramount. Waiting for a clear signal - either a confirmed breakout or a decisive failure at resistance - is crucial. The current environment favors a cautious approach, focusing on risk-reward ratios and avoiding premature entries. The market is at a crossroads, and the path forward will be illuminated by decisive price action and clear economic guidance.
What happens if DXY breaks decisively above $98.15 resistance?
A confirmed break above $98.15, especially on the daily chart, would invalidate the bearish short-term outlook and signal a continuation of the dollar's strength. This could trigger a move towards the daily resistance at $98.42, with a secondary target at $98.83. Such a move would likely be supported by positive economic news or hawkish Fed commentary.
Should I consider buying DXY at current levels around $97.99 given the mixed signals?
Buying at current levels carries significant risk due to the proximity of resistance at $98.15 and conflicting signals across timeframes. A higher probability trade would involve waiting for confirmation: either a clear breakout above $98.15 with strong volume or a confirmed rejection at resistance leading to a move back towards daily support at $97.48. Risk management is crucial; define your stop-loss before entering any trade.
Is the RSI at 58.12 on the 1-hour chart a buy signal for DXY?
An RSI of 58.12 on the 1-hour chart indicates upward momentum but is not yet in overbought territory. While it supports the immediate bullish bias, it's not a standalone buy signal. It needs to be confirmed by other indicators, such as a positive MACD and a clear break of resistance, and should be considered in conjunction with the bearish signals on the daily chart.
How might Fed's Daly speech impact DXY's trend analysis this week?
Fed President Daly's speech is a significant event risk. If her comments are hawkish, implying continued rate hikes or a prolonged period of high rates, it could boost the DXY and potentially break the $98.15 resistance. Conversely, any dovish hints or concerns about economic slowdown could trigger a sell-off, invalidating the bullish setup and pushing DXY towards daily support levels.
Track markets in real-time
AI-powered analysis, technical indicators and real-time price data.
Join Our Telegram Channel
Breaking market news, AI analysis and trading signals instantly.
Join Channel