

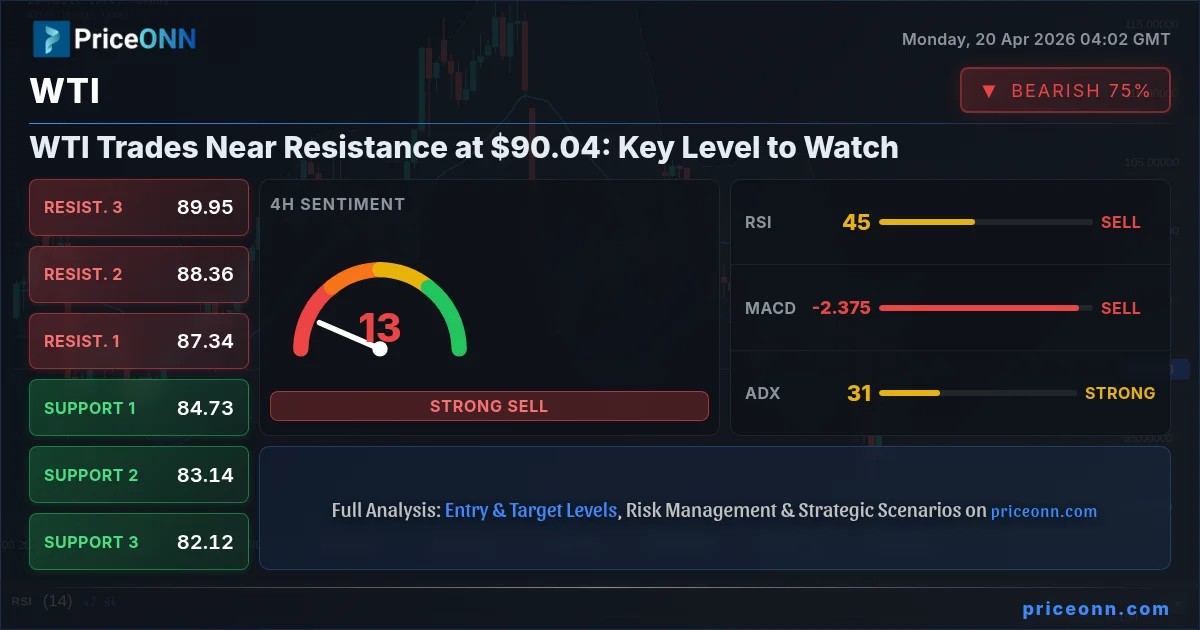
The relentless climb in crude oil prices has brought West Texas Intermediate (WTI) to a critical juncture, trading precariously close to significant resistance levels around the $90.04 mark. After a substantial rally, the market is now at a crossroads, with traders and analysts closely scrutinizing the data for clues on the next directional move. This isn't just another day in the energy markets; it's a pivotal moment where technical indicators, fundamental drivers, and market sentiment are converging, demanding a closer look at the potential for a breakout or a sharp reversal.
- WTI trades near resistance at $90.04, following a strong upward move.
- The ADX at 30.61 signals a strong trend, but conflicting signals from RSI and Stochastic suggest caution.
- Key resistance lies at $92.41, while support is found at $88.41 and $89.25.
- Geopolitical tensions and inventory data remain key drivers for WTI price action.
The current price action for WTI, hovering at $90.04, presents a classic technical scenario. On the 1-hour chart, the trend is neutral with moderate strength (50%), but the overall signal leans towards a 'SELL' based on a confluence of indicators. However, the 4-hour timeframe paints a more bullish picture, with a strong uptrend (90% strength) and a 'BUY' signal from most indicators, suggesting underlying strength despite short-term choppiness. The daily chart reinforces a bearish sentiment with its trend direction, yet shows a rising RSI and MACD momentum, creating a complex tapestry of conflicting signals. This divergence across timeframes is precisely what makes the $90.04 level so critical. It’s a battleground where short-term bearish pressures meet longer-term bullish aspirations, and the outcome will likely dictate the next significant price move.
The strength of the trend, as indicated by the ADX, is noteworthy. On the 1-hour chart, the ADX reads 27.05, indicating a strong downward trend in that specific timeframe. However, the 4-hour ADX at 20.42 suggests a medium-strength trend, and the daily ADX at 21.26 also points to a medium-strength trend, albeit with a bearish direction. This might seem contradictory, but it highlights the intraday volatility and the larger, more established trend. The 'General Signal' across the 1-hour and 4-hour charts leans towards 'SELL', while the daily chart shows a 'BUY' signal. This internal conflict is typical of markets approaching key resistance levels, where short-term traders might be taking profits while longer-term players are still accumulating.
Navigating the Technical Landscape: Indicators in Focus
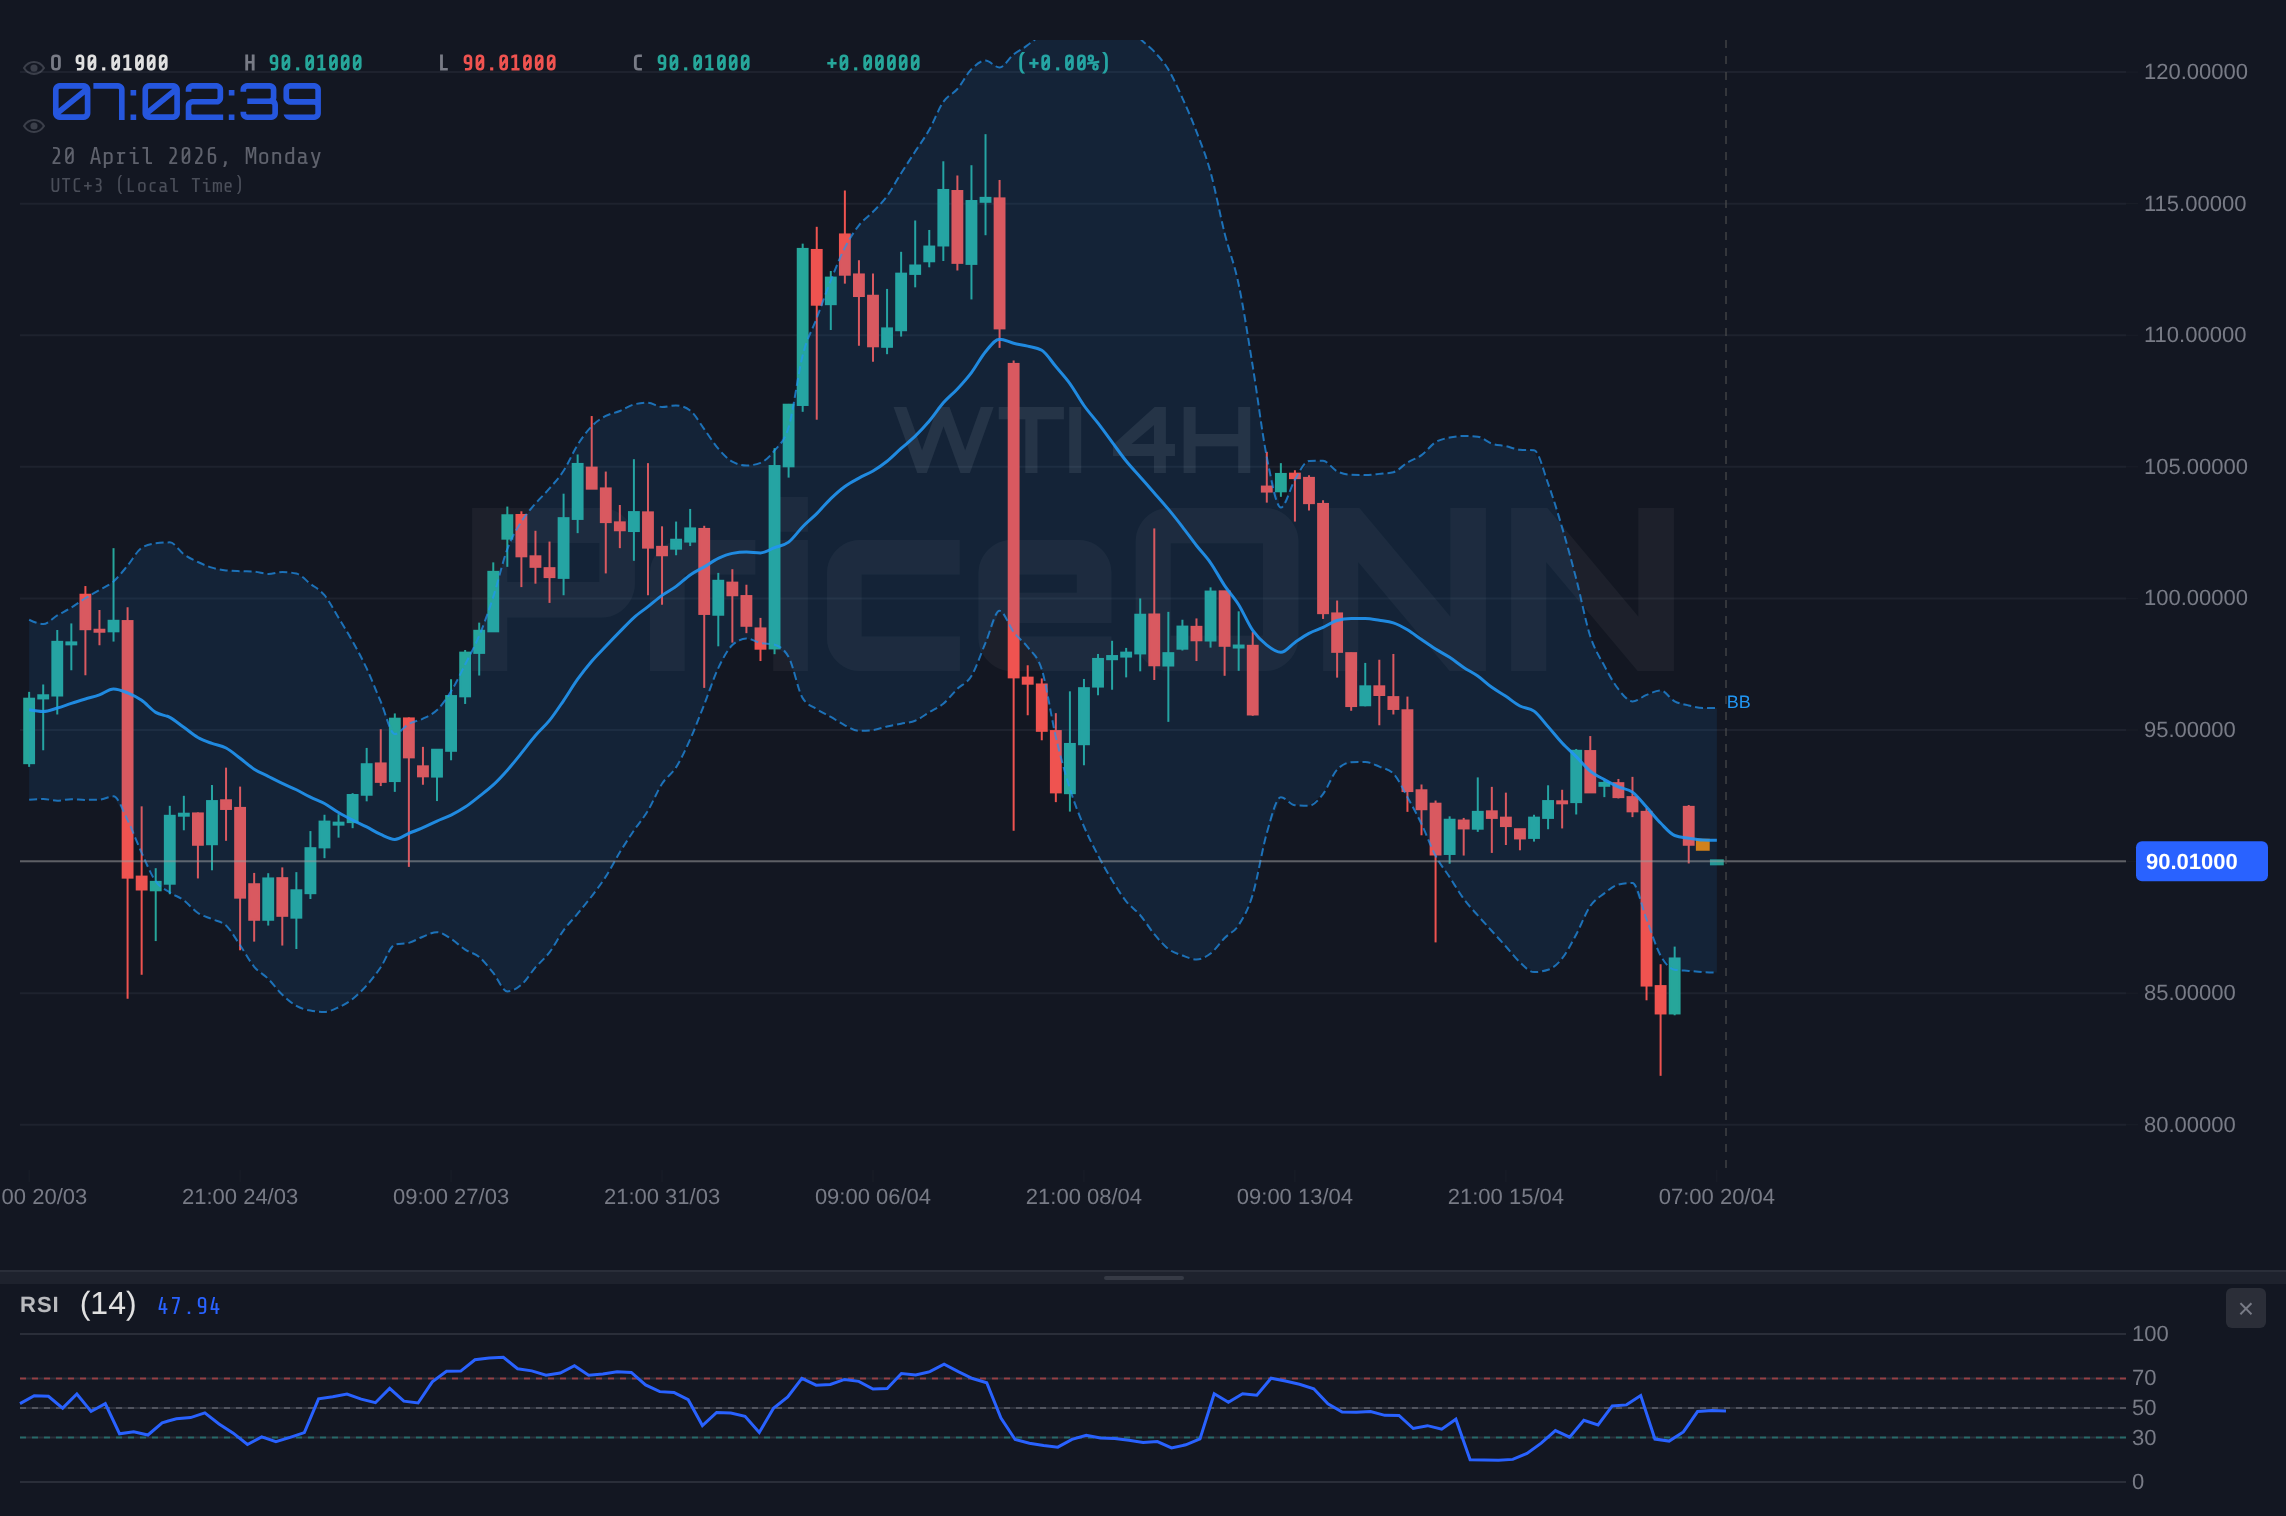
Diving deeper into the technical indicators, we see a mixed bag that requires careful interpretation. On the 1-hour chart, the RSI(14) is at 44.58, indicating a neutral position with a slight downward lean. This suggests that while not yet oversold, there isn't significant buying pressure building. The MACD is also showing negative momentum, reinforcing the short-term bearish bias. However, the Stochastic oscillator on the 1-hour chart presents a contrasting 'BUY' signal with %K (46.23) above %D (32.91), hinting at potential upward momentum building from oversold conditions. This is the first major contradiction: MACD and RSI lean bearish, while Stochastic suggests a bounce.
Moving to the 4-hour timeframe, the picture shifts. The RSI(14) is at 48.26, still in neutral territory but with a downward trend. The MACD remains bearish, but the Stochastic oscillator (%K=57.3, %D=58.34) now provides a 'SELL' signal, with %K falling below %D. This aligns more with the bearish momentum seen in the MACD. Yet, the overall signal for the 4-hour chart, despite these indicators, leans towards 'BUY' (1 Buy, 7 Sell, 0 Neutral). This discrepancy underscores the complexity; the raw indicator readings might suggest selling, but the broader trend context on this timeframe appears to be holding up.
The daily chart offers yet another perspective. Here, the RSI(14) is at 51.19, comfortably in neutral territory and showing a slight upward trend. The MACD is positive and above its signal line, indicating bullish momentum. The Stochastic is showing a 'SELL' signal (%K=70.15, %D=76.8), which is a bearish divergence against the MACD and RSI's upward lean. The ADX on the daily chart at 21.26 suggests a medium-strength trend, and the overall signal is 'BUY' (6 Buy, 2 Sell, 0 Neutral). This daily bullish bias, particularly from the MACD and RSI, clashes with the shorter-term bearish signals, creating the tension around the $90.04 resistance.
What the Conflicting Signals Mean for Traders
This technical ambiguity is precisely why $90.04 is such a crucial level. For short-term traders looking to fade the rally, the bearish signals on the 1-hour and 4-hour charts, combined with the approach to resistance, offer a potential entry point for a short position. A break below the immediate support at $89.25 could signal a move lower, targeting $88.77 and potentially $88.41. The risk here is that the longer-term daily trend remains bullish, and any dip could be seen as a buying opportunity by larger market participants. Stops would need to be tight, likely just above the $90.04 resistance.
Conversely, for those looking to play a breakout, holding above $90.04 is the key. A decisive move and close above this level, especially with conviction on increasing volume, could signal the start of a move towards the next resistance at $90.45, and potentially higher towards $90.93. The bullish signals on the daily chart, if they continue to dominate, could fuel such a rally. However, the overhead resistance is significant, and the conflicting signals across timeframes suggest that any breakout might be tested thoroughly. Confirmation would be crucial, perhaps a retest of $90.04 as support after the initial break.
The neutral scenario, which often plays out in such indecisive markets, involves consolidation. WTI could trade sideways between the current levels and the immediate support/resistance zones. This would likely be characterized by lower volatility and a lack of clear direction. Traders might look for range-bound strategies, buying near support and selling near resistance, though the strong ADX readings suggest that a range might not hold for long. The real risk in a consolidation phase is getting caught on the wrong side of a sudden breakout driven by news or a shift in market sentiment.
Fundamental Drivers and Geopolitical Undercurrents
Beyond the charts, the fundamental picture for WTI crude oil is equally complex. Recent market data indicates that US crude oil inventories surged by a significant margin, a factor that typically weighs on prices. The provided data shows a substantial increase in these inventories, which often signals weakening demand or oversupply. This news, if it were the sole driver, would suggest downward pressure on WTI. However, the market seems to be simultaneously reacting to other powerful forces.
Geopolitical tensions remain a constant undercurrent, particularly concerning the Strait of Hormuz. News reports from April 18th highlighted the fluctuating control over this vital shipping lane. While there was a period of perceived easing, tensions have resurfaced, potentially impacting supply routes and injecting volatility into oil prices. Such events can override typical inventory data, creating spikes based on fear of supply disruptions. The 'peace trade' in oil, as some analysts called it, appears to be over, with the potential for renewed volatility.
Furthermore, the broader economic context cannot be ignored. The US dollar index (DXY) is currently trading around 98.00, showing signs of strength on the 1-hour and 4-hour charts, though facing bearish signals on the daily. A stronger dollar generally exerts downward pressure on dollar-denominated commodities like oil, making them more expensive for holders of other currencies. Conversely, if the dollar were to weaken, it could provide a tailwind for WTI. The correlation between DXY and WTI is complex and can shift, but at current levels, the dollar's strength is a factor that could cap oil's upside potential.
Inflation expectations also play a crucial role. Rising oil prices are a significant contributor to inflation. Central banks, particularly the Federal Reserve, are closely monitoring energy costs as they formulate monetary policy. While the provided economic calendar doesn't detail specific upcoming events for today, upcoming data releases on employment and consumer spending will be critical. Traders are watching for signs of consumer resilience amidst rising inflation and elevated gas prices, as highlighted in recent market commentary. Any indication of weakening demand due to high prices or aggressive monetary tightening could curb oil's upward trajectory.
Trade Scenarios and Risk Management
Given the confluence of technical signals and fundamental drivers, several scenarios are plausible for WTI. The current price of $90.04 sits at a critical resistance level.
Bearish Scenario: Resistance Holds Firm
60% ProbabilityBullish Scenario: Breakout Above Resistance
30% ProbabilityNeutral Scenario: Consolidation Around $90.04
10% ProbabilityRisk management is paramount in this environment. For traders considering a short position, placing a stop-loss just above the $90.04 resistance, perhaps at $90.45, would be prudent. This allows for minor fluctuations but protects against a breakout. For those anticipating a bullish move, a stop below the $89.25 support level, or even tighter below $88.77, would be essential to limit potential losses if the market reverses.
The probability assignments reflect the current technical picture. The 60% weighting towards the bearish scenario is driven by the immediate resistance, conflicting short-term signals, and the potential impact of rising US inventories. However, the strong daily bullish bias and the possibility of geopolitical events driving prices higher mean the bullish scenario, though less probable currently, cannot be ignored. The 30% allocation acknowledges this potential upside. The neutral scenario, with a 10% probability, is less likely given the ADX readings suggesting a trending market, but consolidation is always possible around key levels.
The Road Ahead: What to Watch
Looking ahead, the focus remains squarely on the $90.04 resistance level for WTI. A failure to decisively break this barrier could lead to a pullback, with immediate support at $89.25 and $88.77. The strength of the daily trend, indicated by the MACD and RSI, suggests that any significant dip could be a buying opportunity, provided it doesn't break key lower support levels. The target for a bullish breakout scenario would be the daily resistance at $92.41, a level that would signal a continuation of the broader uptrend.
The narrative around US crude oil inventories will be crucial in the coming days. If further data points to sustained high inventory levels, it could put significant pressure on prices, potentially invalidating the bullish outlook. Conversely, any geopolitical escalation or unexpected demand surge could quickly push WTI above $90.04 and towards higher targets. Traders should remain vigilant, paying close attention to the interplay between supply data, geopolitical developments, and the US dollar's movement.
Frequently Asked Questions: WTI Analysis
What happens if WTI fails to break above the $90.04 resistance level?
If WTI fails to break decisively above $90.04 resistance, expect a potential pullback. The bearish scenario, with a 60% probability, suggests a move towards support levels at $89.25 and potentially $88.77. This would be confirmed by a close below $89.25.
Should I consider buying WTI at current levels around $90.04 given the mixed signals?
Buying at $90.04 is risky due to the confluence of resistance and mixed short-term signals. A more prudent approach for a bullish trade would be to wait for a confirmed breakout above $90.45, ideally with a retest of $90.04 as support. This scenario has a 30% probability.
Is the ADX at 30.61 a reliable indicator for WTI trend analysis right now?
The ADX at 30.61 on the 1-hour chart indicates a strong trend, but its direction conflicts with other indicators on shorter timeframes. While it suggests momentum, the conflicting RSI and Stochastic readings mean caution is advised. Confirmation from price action is key.
How will rising DXY levels around 98.00 affect WTI prices this week?
A strengthening US Dollar Index (DXY), currently around 98.00, typically exerts downward pressure on dollar-denominated commodities like WTI. This could cap upward potential and increase the probability of the bearish scenario playing out if inventories also rise.
Navigating these choppy waters requires discipline. The market is presenting a clear battle between short-term bearish pressures and longer-term bullish undercurrents. While the immediate outlook suggests caution, a decisive break above $90.45, targeting $92.41, remains a strong possibility if fundamentals shift. Conversely, a failure at resistance could see prices retreat to the $88.41 support zone. Ultimately, managing risk and waiting for clear confirmation at key levels will be the most effective strategy in this environment.
Track markets in real-time
AI-powered analysis, technical indicators and real-time price data.
Join Our Telegram Channel
Breaking market news, AI analysis and trading signals instantly.
Join Channel