

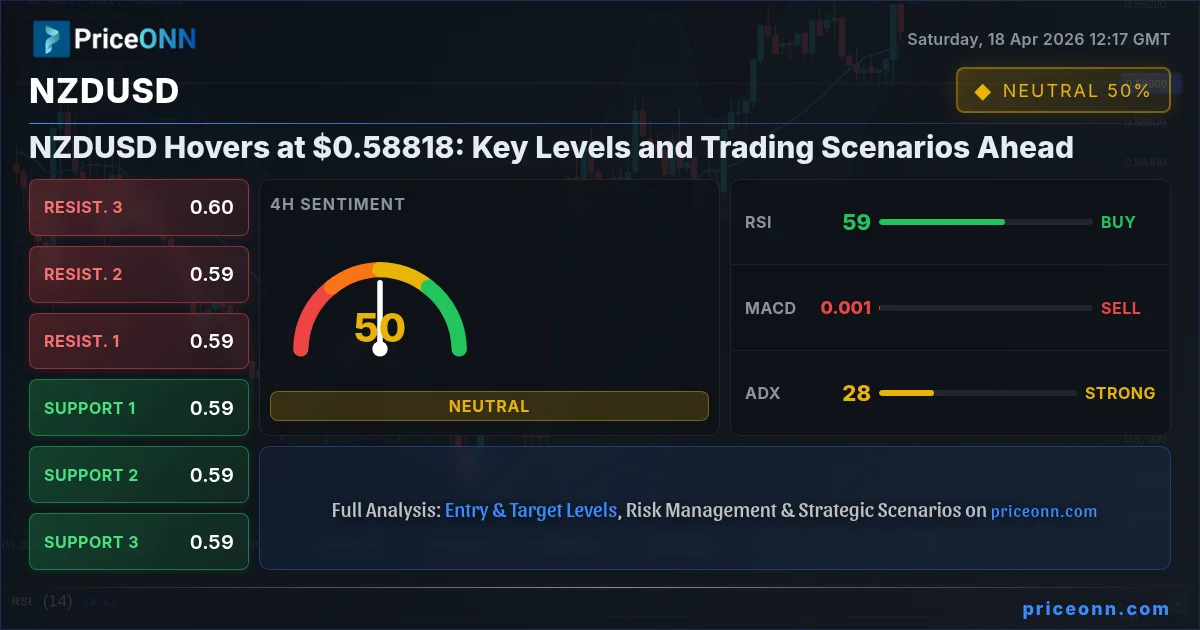
The New Zealand Dollar has found itself in a delicate position against the US Dollar, trading around the $0.58818 mark as the market digests a mixed bag of economic signals and a fluctuating risk sentiment. Last Friday's close saw NZDUSD consolidate, painting a picture of neutrality that belies the underlying currents shaping its potential trajectory. As a seasoned analyst who has weathered numerous market cycles, I see this current pause not as a lack of direction, but as a critical juncture where different trading strategies can find their footing. Whether you're a scalper looking for a quick scalp, a swing trader aiming for multi-day moves, or a long-term investor positioning for broader trends, understanding the nuances of the current NZDUSD technical landscape is paramount. The interplay between the US Dollar Index (DXY), global equity markets like the S&P 500 and Nasdaq, and even the price of oil, provides crucial context for deciphering where this pair might be headed. This analysis delves deep into the multi-timeframe technicals, exploring the 'why' behind indicator readings and historical patterns, to offer a clear roadmap for navigating the week ahead.
- NZDUSD is trading at $0.58818, reflecting a neutral market sentiment.
- Key support is identified at $0.58719, with critical resistance at $0.59117.
- The 1-hour RSI at 44 suggests bearish momentum, while the 4-hour RSI at 59.35 indicates a bullish inclination.
- The ADX at 25.63 on the 1-hour chart confirms a strong downtrend, contrasting with the 4-hour ADX at 28.26 showing a strong uptrend.
- Correlation analysis shows DXY's slight dip to 97.9 is not significantly pressuring NZDUSD currently.
The current technical setup for NZDUSD presents a classic case of consolidation, where short-term indicators often dance a tango of conflicting signals. On the 1-hour chart, the Relative Strength Index (RSI) hovers at 44, dipping into bearish territory and suggesting that downward momentum has been building in intraday trading. This is complemented by the Moving Average Convergence Divergence (MACD) which shows negative momentum, with the MACD line below its signal line, indicating selling pressure. Furthermore, the Stochastic Oscillator is deeply oversold, with the %K line at 16 and %D at 25.24, a classic bearish signal that often precedes a bounce, but in this context, suggests a lack of buying conviction. The Average Directional Index (ADX) at 25.58 confirms a strong downtrend on this timeframe, implying that any upward movements might be mere retracements within a larger bearish structure for the immediate hours. This immediate hourly picture paints a cautious, if not bearish, outlook for very short-term trades, where scalpers might look for opportunities on the short side if key intraday support levels falter.
However, broadening our perspective to the 4-hour timeframe reveals a significantly different narrative. Here, the RSI climbs to 59.35, sitting comfortably in neutral territory and leaning towards bullish, suggesting that the intraday selling pressure might be temporary or confined to shorter trading sessions. The MACD, while still showing negative momentum on this timeframe, is closer to its signal line, hinting at a potential shift or at least a stabilization. The Stochastic Oscillator, in stark contrast to the 1-hour chart, shows %K at 64.45 and %D at 82.11, presenting a bullish signal as %K crosses above %D. This indicates that buying interest is emerging on the medium-term chart. The ADX here reads 32.48, confirming a strong uptrend, which directly contradicts the 1-hour timeframe's bearish trend signal. This divergence between timeframes is crucial; it suggests that while intraday traders might see selling, the medium-term trend might still favor buyers. This is where swing traders start to pay attention, looking for confirmation of an uptrend continuation or a decisive bounce from key support levels.
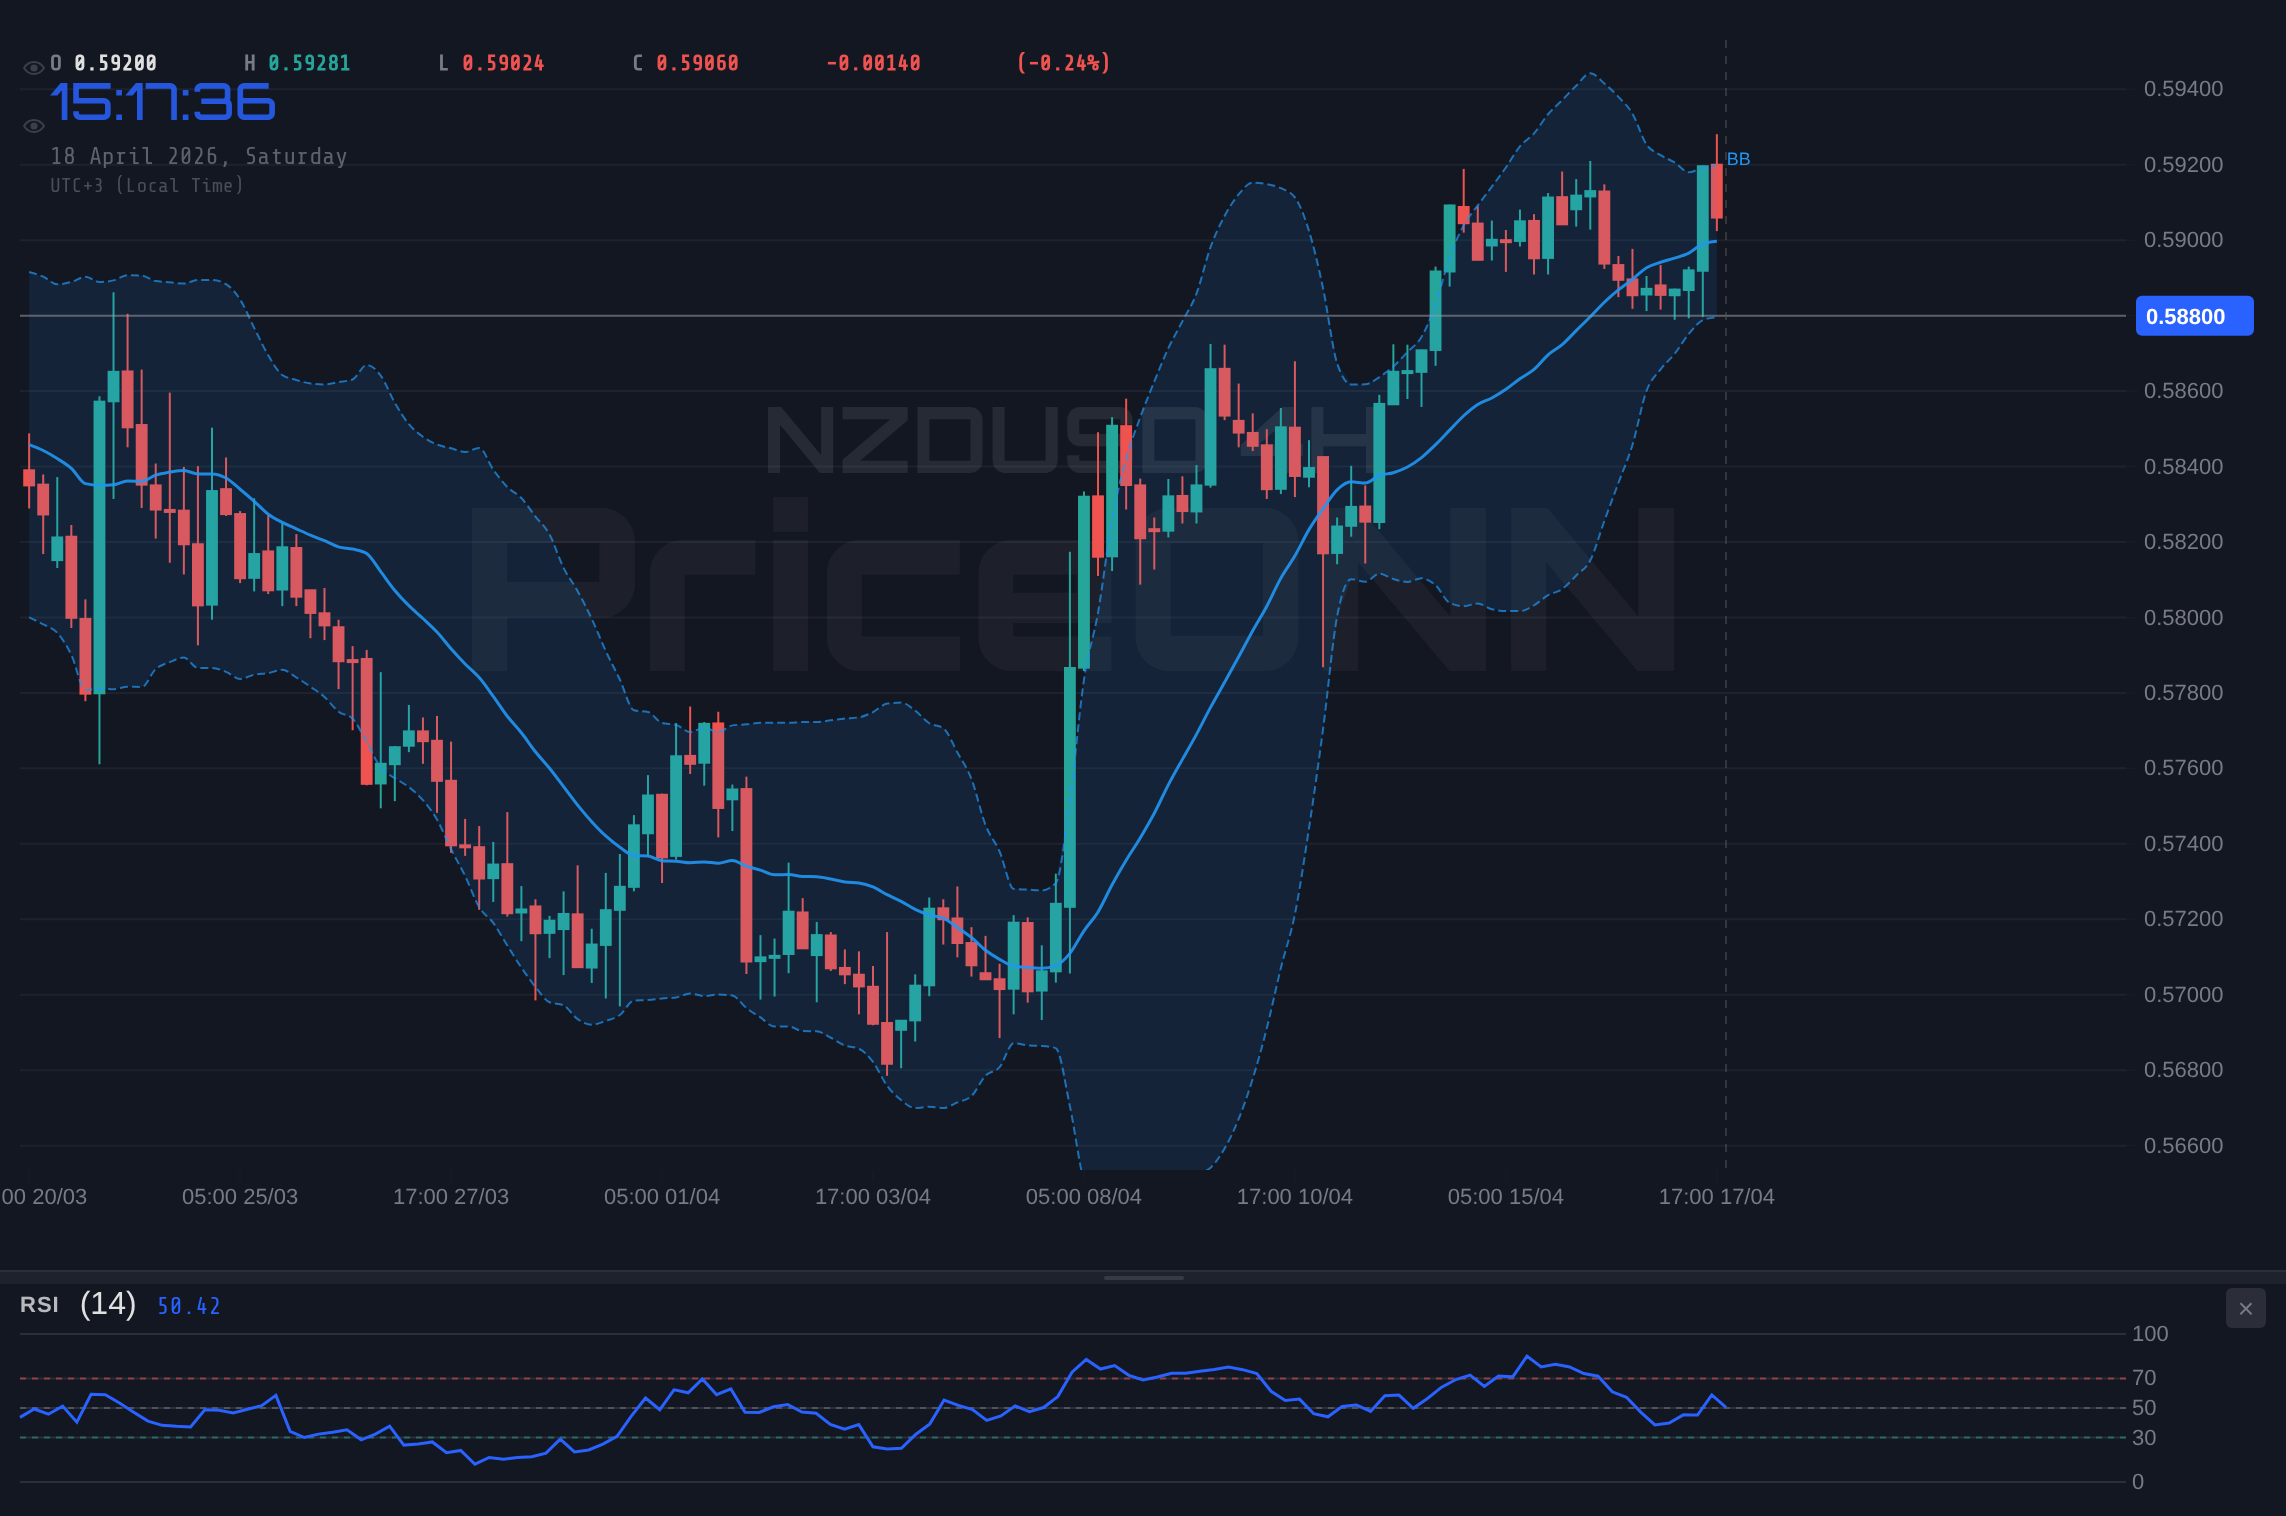
Zooming out to the daily timeframe provides yet another layer of complexity and context. The daily RSI stands at 64.61, firmly in the neutral-to-bullish zone and indicating a healthy upward bias without being overbought. The MACD is positive, with the MACD line comfortably above the signal line, reinforcing the bullish sentiment on the longer term. The Stochastic Oscillator, with %K at 82.76 and %D at 83.32, is in overbought territory, signaling caution for further immediate upside but also confirming the strength of the prevailing uptrend. It's important to remember that overbought Stochastic readings do not automatically signal a sell; they can persist in strong uptrends for extended periods. The ADX on the daily chart is 20.91, indicating a moderately strong uptrend. This daily picture suggests that despite any short-term headwinds or intraday choppiness, the overarching trend for NZDUSD has been bullish. Long-term investors will likely view pullbacks as potential buying opportunities, especially if they occur near established support levels, provided the broader economic and geopolitical backdrop remains supportive.
Navigating the Conflicting Timeframes: A Trader's Dilemma
The conflicting signals between the 1-hour, 4-hour, and daily charts for NZDUSD are not unusual; they are the very essence of market dynamics. The key for any trader is to understand which timeframe aligns with their trading style and risk tolerance. For scalpers, the 1-hour chart might be their primary focus, and the bearish signals there would suggest caution or short-selling opportunities if support fails. They would be watching the intraday support at $0.58834, $0.58773, and $0.58680. A break below these levels could trigger a cascade of sell orders, pushing the price lower towards the 4-hour support levels. Conversely, a strong bounce off these intraday supports, perhaps fueled by a shift in broader market sentiment or positive news from New Zealand, could offer a quick scalp opportunity for the bulls, targeting the 1-hour resistance levels at $0.58988, $0.59081, and $0.59142.
Swing traders, who typically hold positions for days to weeks, will pay closer attention to the 4-hour and daily charts. The bullish leanings on the 4-hour chart, supported by the ADX at 28.26 indicating a strong uptrend, suggest that dips might be opportunities. They would be watching the 4-hour support levels at $0.58929, $0.58661, and $0.58527. A successful hold above $0.58929, for instance, could be a trigger for a bullish swing trade, targeting the 4-hour resistance levels around $0.59331 and potentially higher. The daily chart's overall bullish bias provides a tailwind for such strategies, suggesting that the medium-term trend is still intact. However, the overbought Stochastic on the daily chart warrants caution; a sustained move above $0.59117 (daily resistance) would be needed to confirm further upside potential without immediate profit-taking pressure.
Long-term investors, operating on weekly and monthly charts (not detailed here but inferred from the daily trend), would be looking for confirmation of a sustained bullish trend above the daily resistance at $0.59117. They would be less concerned with intraday fluctuations and more focused on fundamental shifts or major technical breakouts. The daily support at $0.58719 and $0.58566 would be critical areas to watch for potential accumulation phases. A failure to hold these levels, especially on significant volume, could signal a trend reversal, prompting a re-evaluation of long-term positions. The historical context of NZDUSD often shows strong correlation with commodity prices and risk appetite, factors that are currently mixed, making a longer-term directional bet a higher-risk proposition without clearer macro signals.
Correlation Analysis: The Dollar, Equities, and Oil's Shadow
Understanding the NZDUSD's behavior requires looking beyond its own charts to the broader market ecosystem. The US Dollar Index (DXY) is currently trading at 97.9, showing a slight dip from its recent highs. Historically, a strengthening DXY puts downward pressure on pairs like NZDUSD. The current DXY reading, while not aggressively bearish, suggests a temporary reprieve for riskier currencies like the Kiwi. If the DXY were to break below its 4-hour support at 97.32, it could signal further dollar weakness, potentially giving NZDUSD a boost towards its higher resistance levels. Conversely, a sustained rally in the DXY above its 1-hour resistance of 97.73 could cap any upside for NZDUSD.
The performance of major US equity indices also provides a vital clue. The S&P 500 is up 0.74% at 6572.87, and the Nasdaq 100 has surged 1.45% to 26682.75. This indicates a healthy risk appetite in the market, which generally benefits commodity-linked currencies like the NZD. A continued rise in equities could support NZDUSD, while a sharp reversal in stocks, perhaps triggered by inflation concerns or geopolitical shocks, could lead to a flight to safety, strengthening the USD and weakening the Kiwi. The Dow Jones Industrial Average, up 1.74% at 49470.5, further corroborates this risk-on sentiment. This positive correlation between equities and NZDUSD suggests that as long as the stock market remains buoyant, the Kiwi has a supportive backdrop.
Oil prices, particularly WTI at $86.42 and Brent at $92.54, are experiencing significant daily drops (WTI -6.71%, Brent -6.93%). While this might seem counterintuitive for a commodity currency, the sharp decline could be interpreted in a few ways. It might signal easing inflation expectations, which could reduce the pressure on central banks to hike rates aggressively, indirectly supporting currencies like the NZD. Alternatively, it could reflect weakening global demand, a more bearish signal for the global economy and risk assets. Currently, the falling oil prices do not appear to be directly correlated with a bearish move in NZDUSD, suggesting other factors like USD strength or specific New Zealand economic data are playing a more dominant role. However, sustained high oil prices (even with recent dips) remain a background risk for inflation and global growth, which could eventually weigh on risk appetite and NZDUSD.
Historical Perspective: Patterns in NZDUSD's Neutrality
Looking back at the historical performance of NZDUSD, periods of neutrality often precede significant directional moves. The pair has a tendency to consolidate in ranges, especially when key economic data releases are imminent or when there's uncertainty surrounding central bank policy. For instance, during the latter half of 2023, NZDUSD spent several weeks trading within a relatively tight range between $0.5800 and $0.5950. This period of consolidation was eventually broken by a sharp move higher following more dovish-than-expected commentary from the Federal Reserve and a weaker-than-anticipated US Non-Farm Payrolls report. The ADX indicator during those consolidation phases often dipped below 20, signaling a weak trend, only to surge rapidly once a breakout occurred. The current ADX readings across different timeframes (1H: 25.63, 4H: 28.26, 1D: 25.02) suggest that while there might be short-term directional bias, the overall trend strength is building, potentially indicating that this period of neutrality might be shorter-lived than historical precedents.
When NZDUSD has entered neutral phases in the past, the RSI indicator often oscillated around the 50 level, mirroring the indecision in the market. Readings between 40 and 60 on the RSI (as we see on the 1-hour and daily charts currently) typically denote a lack of strong directional conviction. However, the divergence between the 1-hour RSI (44) and the 4-hour RSI (59.35) is a key observation. Historically, when such divergences occur, the longer-term timeframe's signal often carries more weight, especially if confirmed by other indicators. The 4-hour chart's RSI above 50, coupled with a strong ADX, suggests that the underlying bullish momentum might be more persistent than the intraday bearish readings imply. This historical pattern suggests that traders should be wary of fading moves too early based solely on short-term indicators, and instead look for confirmation on higher timeframes before committing to trades.
The Stochastic Oscillator's behavior during previous neutral phases also offers valuable insights. Rapid crosses in and out of overbought/oversold territory, often seen during consolidation, typically signal choppy conditions rather than the start of a new trend. However, when the Stochastic aligns with other indicators, such as a strong ADX and a daily RSI above 60, it can precede significant moves. For example, a sustained period of Stochastic readings in the 70-90 range on the daily chart, even with brief dips into oversold territory on shorter timeframes, has historically preceded strong bullish continuations for NZDUSD. The current daily Stochastic readings of %K=86.57 and %D=88.93, while technically overbought, align with the daily's bullish trend signal, suggesting that this pair might be building energy for a potential upward breakout, rather than an imminent reversal.
Key Levels and Trading Scenarios for the Week Ahead
Bearish Scenario: Downside Pressure Mounts
55% ProbabilityNeutral Scenario: Consolidation Continues
25% ProbabilityBullish Scenario: Upside Momentum Builds
20% ProbabilityFor scalpers, the bearish scenario presents the most immediate opportunity if the 1-hour support at $0.58834 fails. A quick move down to $0.58719 could yield profits before a potential bounce. Swing traders would be looking for confirmation of the bullish scenario, ideally a hold above $0.58988, with targets at $0.59117 and $0.59362. Long-term investors should monitor the daily support levels; a failure to hold $0.58719 could signal a more significant downturn, while a sustained move above $0.59117 could confirm a continuation of the broader uptrend. The probabilities assigned reflect the current technical ambiguity, with a slight lean towards downside pressure in the very short term, but a strong underlying bullish trend on the daily chart.
What Different Trader Types Should Watch
For the scalper, the immediate focus is on the 1-hour chart's price action around the $0.58834 level. A decisive break below this level, confirmed by increasing volume and bearish divergence on the 1-minute RSI, could offer a shorting opportunity targeting $0.58719. Conversely, a strong rejection of $0.58680, perhaps on a news catalyst, could present a quick long scalp aiming for $0.58988. Scalpers must be extremely disciplined with their stop-losses, likely placing them just above the entry resistance or below the entry support, and aiming for tight risk-reward ratios given the choppy intraday conditions. The Stochastic Oscillator's oversold reading on the 1-hour chart is a double-edged sword; it could signal a bounce, or it could persist as the price grinds lower.
Swing traders will be more interested in the 4-hour and daily charts. The 4-hour chart's bullish bias, supported by the ADX at 28.26, suggests that pullbacks towards the $0.58929 support level might be buying opportunities. A confirmation could be a bullish candlestick pattern forming on the 4-hour chart after touching this level, coupled with a daily close above $0.58988. The invalidation level for such a trade would be a firm break below the daily support at $0.58719. Swing traders should also keep an eye on the DXY and S&P 500; a rising DXY or falling equities could quickly derail a bullish NZDUSD thesis. They are looking for trades that can potentially yield 100-200 pips, managing risk by placing stops below key daily support levels.
For the long-term investor, the focus shifts to the daily chart's trend and the confluence of technical and fundamental factors. The current bullish trend on the daily chart, indicated by the RSI above 60 and MACD's positive momentum, suggests that any significant pullbacks towards $0.58566 or even $0.58321 could be long-term accumulation zones. However, the overbought Stochastic on the daily chart warrants caution regarding extended upside without consolidation. A sustained move and daily close above the significant resistance at $0.59515 would be a strong bullish signal for the longer term, potentially opening the door for targets much higher. Conversely, a decisive break and weekly close below $0.58321 would be a major bearish signal, suggesting a potential trend reversal and a need to reassess long-term positioning. Investors must also consider the broader macroeconomic picture, including inflation trends, central bank policies, and geopolitical stability, which can override technical levels.
Economic Calendar and Geopolitical Undercurrents
The economic calendar for the upcoming week holds several key events that could influence NZDUSD. While today, Saturday April 18th, is quiet, the following week presents data points that warrant attention. The US Retail Sales data, due on Tuesday, will offer crucial insight into consumer spending resilience amidst rising gas prices, with a forecast of 2.1% actual growth against a previous 3.081%. A significantly weaker-than-expected reading could dampen the USD's strength, potentially benefiting NZDUSD. Similarly, the US Producer Price Index (PPI) data, which came in at 2.6% actual versus a forecast of 2.5%, provides further context on inflation, though its immediate impact on forex markets can be nuanced. The market will also be watching the upcoming GBP data, particularly the inflation figures, as significant deviations could impact the broader risk sentiment and indirectly affect NZDUSD.
Geopolitically, the situation remains fluid. The recent surge in gold prices, settling at $4,885.50, and the temporary reopening of the Strait of Hormuz, signal ongoing tensions in the Middle East. While this hasn't directly translated into sustained USD strength, such events can quickly shift market sentiment towards risk aversion, benefiting safe-haven currencies and potentially pressuring the NZD. The continued elevated oil prices, despite recent dips, remain a background factor influencing inflation expectations globally. If oil prices were to spike again, central banks might be forced into more hawkish stances, which could strengthen the USD and create headwinds for NZDUSD, especially if New Zealand's economic data doesn't keep pace.
The interplay between these economic data releases and geopolitical developments creates a complex environment. For instance, if US inflation data proves stubborn, it could increase the probability of further Fed tightening, strengthening the USD and putting pressure on NZDUSD. Conversely, any signs of economic slowdown in New Zealand, such as the previously reported contraction in the services sector, could independently weaken the Kiwi. Traders must remain vigilant, monitoring how NZDUSD reacts to each piece of news. The recent PriceONN market news highlighted concerns about the New Zealand services sector contracting, which could be a significant bearish factor for the Kiwi, even if current technicals show a neutral to bullish bias on higher timeframes. This emphasizes the need to integrate fundamental analysis with technical signals.
Historical Context and Technical Divergences
Reflecting on past market behavior, NZDUSD's current neutral stance is not unprecedented. Periods of consolidation, often characterized by oscillating RSI levels between 40 and 60 and subdued ADX readings below 20, have historically preceded significant trend developments. For example, during the latter half of 2023, the pair spent weeks consolidating between $0.5800 and $0.5950. This period of indecision was eventually resolved by a substantial upward move following a dovish shift in Federal Reserve policy expectations and weaker US employment figures. The current ADX values, while showing stronger trends on the 4-hour (28.26) and 1-hour (25.63) charts than typically seen in pure consolidation, still indicate a market that has not fully committed to a direction. This suggests that the current consolidation might be a precursor to a more decisive move, rather than a prolonged period of sideways trading.
The divergence in indicator signals across timeframes is a recurring theme in NZDUSD's history. The 1-hour chart's bearish RSI (44) and Stochastic oversold conditions often battle with the daily chart's bullish RSI (64.61) and positive MACD. Historically, such divergences have often resolved in favor of the longer-term trend, especially when confirmed by price action. When NZDUSD has shown a strong daily uptrend (as indicated by RSI > 60 and MACD positive), intraday bearish signals have often been short-lived, leading to 'buy the dip' opportunities. The current daily Stochastic in the overbought zone (%K: 86.57, %D: 88.93) is a sign of strength, not immediate reversal, as these readings can persist in strong uptrends. This historical pattern suggests that while caution is warranted on intraday charts, the overall daily trend might provide a more reliable guide for medium-term trades.
Furthermore, the correlation with the US Dollar Index (DXY) and equity markets provides a critical lens. When the DXY strengthens significantly, it often exerts downward pressure on NZDUSD, irrespective of the pair's internal technicals. Conversely, a falling DXY, especially when coupled with positive equity market sentiment (like the current rise in S&P 500 and Nasdaq), tends to support NZDUSD. The recent dip in DXY to 97.9 offers a slight reprieve, but its direction remains a key determinant. Investors and traders must constantly assess this correlation; a breakdown in risk appetite, often signaled by falling stocks and a rising DXY, could quickly negate bullish technical setups on NZDUSD, regardless of how strong they appear on paper. The historical tendency for NZDUSD to follow risk sentiment means that global economic health indicators and geopolitical stability reports are as important as any chart pattern.
Frequently Asked Questions: NZDUSD Analysis
What happens if NZDUSD breaks below the $0.58719 support level?
A break below the daily support at $0.58719, especially on increased volume, would invalidate the current bullish lean on the daily chart and likely trigger further selling. This could lead to a move towards the next significant support at $0.58566, aligning with the bearish scenario's targets. The 1-hour chart's bearish signals would gain more credence in this outcome.
Is the RSI reading of 44 on the 1-hour chart a sell signal for NZDUSD at $0.58818?
An RSI of 44 on the 1-hour chart suggests bearish momentum for intraday trading, but it's not a standalone sell signal. It indicates potential downside pressure, especially if price struggles to stay above $0.58818. However, given the daily RSI is at 64.61, this intraday weakness might be a short-term pullback rather than a trend reversal. Confirmation from price action breaking below key intraday support is needed for a definitive short entry.
How will the upcoming US Retail Sales data affect NZDUSD trading around $0.58818?
The US Retail Sales data, with a forecast of 2.1%, is crucial. If the actual figure significantly misses expectations, it could weaken the USD, potentially pushing NZDUSD above the $0.59117 resistance level. Conversely, a strong reading could boost the USD, leading to a test of the $0.58719 support. Traders should anticipate volatility around the release.
Should traders consider buying NZDUSD at current levels near $0.58818 given the conflicting technical signals?
Buying at current levels requires careful risk management due to conflicting signals. The bullish daily trend suggests potential upside, making $0.58719 a key support for entry. However, the bearish 1-hour signals warrant caution. A more prudent approach might be to wait for a confirmed break above $0.58988 or a clear bounce from $0.58719, targeting $0.59117, with stops placed below $0.58719.
The path forward for NZDUSD appears to hinge on its ability to overcome the short-term bearish signals and align with the stronger daily bullish trend. Key levels to watch remain $0.58719 as critical support and $0.59117 as the immediate resistance. A decisive break above the latter, confirmed by broader market sentiment and potentially supportive economic data, could propel the pair higher. Conversely, a failure to hold support could see a retest of lower levels. Traders must remain agile, adapt to changing market conditions, and prioritize risk management above all else. The market always presents opportunities, but patience and discipline are the keys to capitalizing on them effectively.
Track markets in real-time
AI-powered analysis, technical indicators and real-time price data.
Join Our Telegram Channel
Breaking market news, AI analysis and trading signals instantly.
Join Channel