

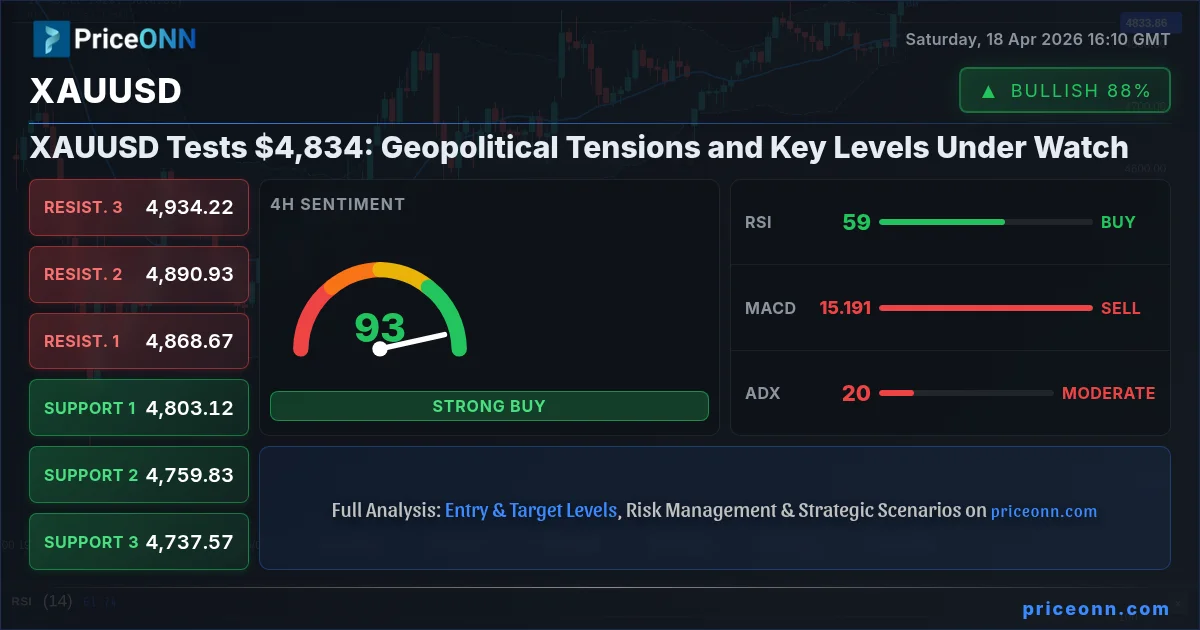
Gold has entered a period of consolidation around the $4,834 mark this past week, reflecting a market caught between lingering geopolitical anxieties and a cautious approach ahead of significant economic data. While the recent easing of tensions in the Strait of Hormuz provided some relief, the underlying macroeconomic currents and central bank policy expectations continue to shape investor sentiment. This neutral phase presents a critical juncture, demanding close attention to key technical levels and the fundamental drivers that will ultimately dictate gold's next significant move. The market is currently absorbing a complex interplay of factors, from the persistent strength in the US Dollar Index (DXY) to the mixed signals emanating from major equity indices like the S&P 500 and Nasdaq.
- Gold is currently trading around $4,834.08, indicating a neutral trend on the daily chart with a Power Gauge of 50%.
- Key support levels are identified at $4,803.12 (4H) and $4,763 (1D), while resistance is noted at $4,868.67 (4H) and $4,828.04 (1D).
- The RSI(14) hovers around 53-59 across timeframes, suggesting room for further upward movement but indicating a lack of strong bullish conviction.
- The DXY is trading near 97.9, exerting some pressure, while the S&P 500 shows a strong bullish trend on 1H/4H charts but a bearish trend on the daily, adding to market uncertainty.
- Geopolitical developments and upcoming economic data releases, particularly from the US, will be crucial in determining the direction of gold prices.
The past week has been characterized by a delicate balancing act for gold traders. After a period of significant volatility driven by escalating geopolitical risks in the Middle East, the yellow metal has found itself in a holding pattern. The price, currently hovering around the $4,834.08 level, reflects this indecision. On the 1-hour chart, the trend is neutral with a power gauge of 50%, suggesting a lack of clear direction. However, the 4-hour chart paints a more constructive picture, with a strong bullish trend (95% power) and indicators like RSI at 59.02 pointing towards potential upside. Yet, the daily timeframe reverts to neutrality, with ADX at 22.43 indicating a weakening trend. This multi-timeframe divergence underscores the current market's ambiguity. The immediate price action is being closely watched around the 4-hour resistance of $4,868.67 and support at $4,803.12. Traders are keenly observing whether the recent geopolitical de-escalation will allow for a sustained push higher or if underlying macroeconomic concerns will reassert themselves.
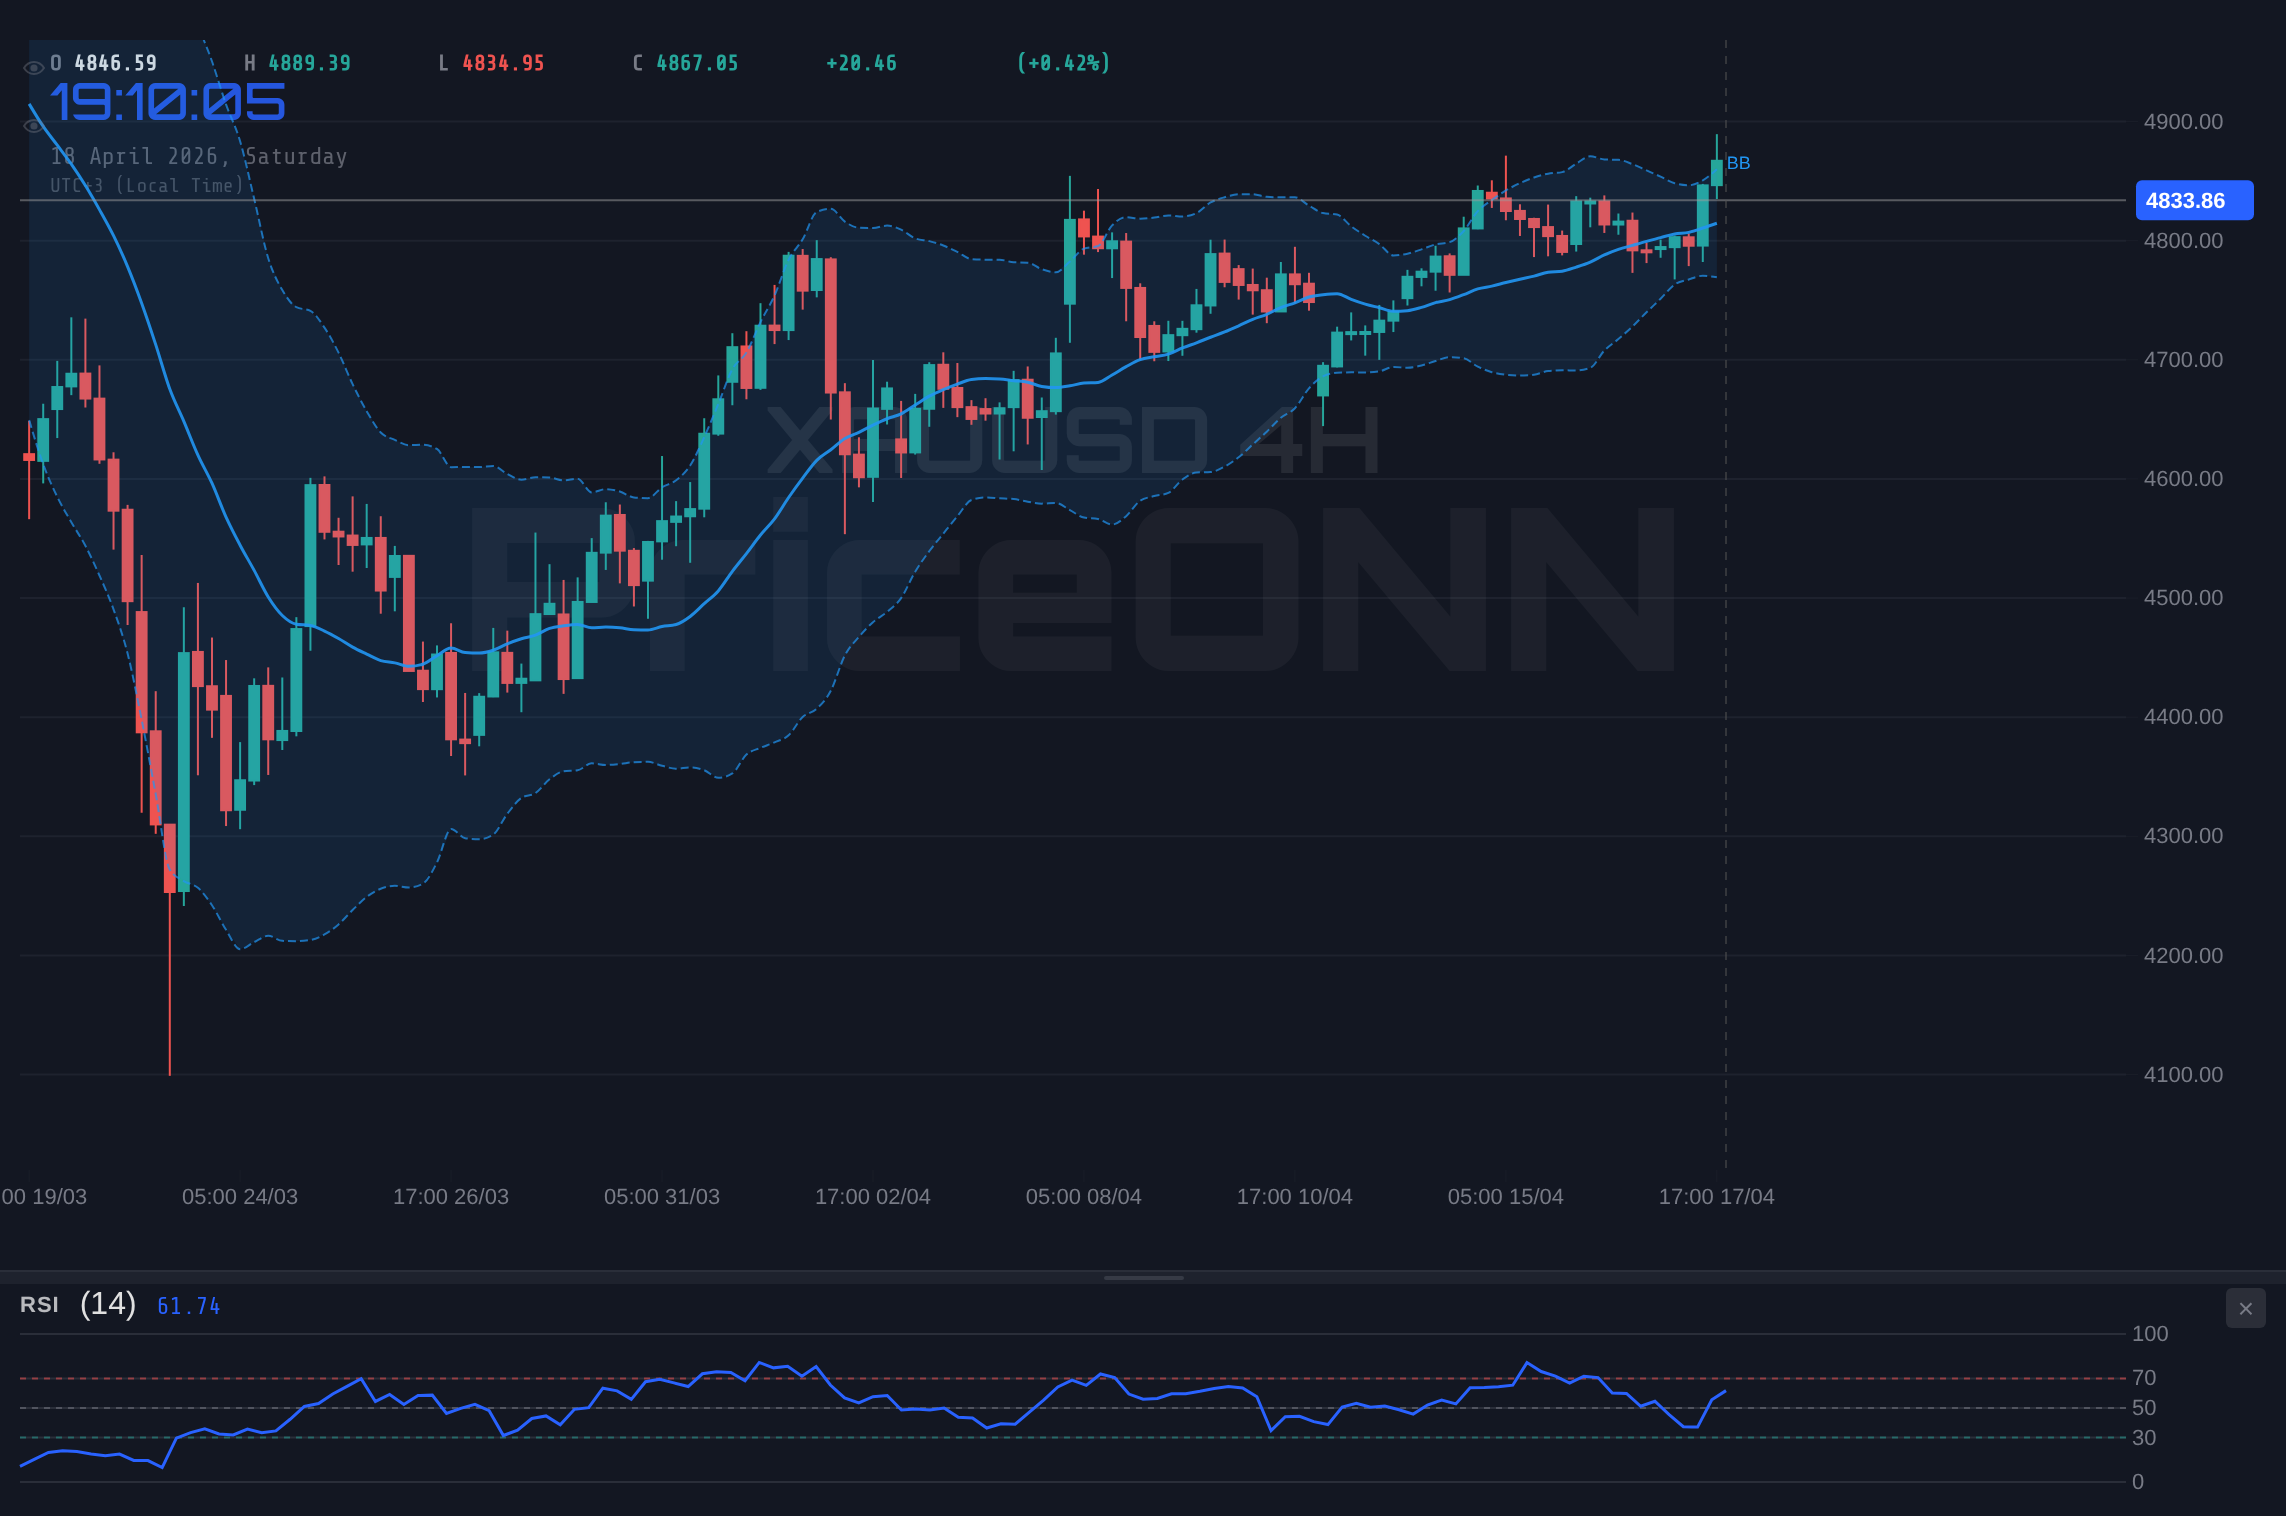
From a technical perspective, the $4,834.08 price point is not just a number; it's a battleground. On the 1-hour chart, the immediate resistance lies at $4,865.55, with further hurdles at $4,872.84 and $4,877.63. Conversely, support is found at $4,853.47, then $4,848.68, and $4,841.39. The RSI(14) at 53.37 on this timeframe suggests a neutral stance, with a slight upward bias, while the Stochastic oscillator's K line (64.62) crossing below its D line (79.54) hints at a potential pullback. The ADX at 27.71 confirms a strong upward trend on this shorter timeframe, yet the conflicting Stochastic signal warrants caution. Moving to the 4-hour chart, the picture becomes more bullish: RSI at 59.02, a strong ADX of 20.46, and a Stochastic K line (64.4) above its D line (44.28) all point towards continued upward momentum. Here, resistance is stacked from $4,868.67 up to $4,934.22, with support at $4,803.12 and below. The daily chart, however, brings us back to a neutral outlook. RSI at 53.91, a Stochastic %K below %D, and an ADX of 22.43 suggest that while the broader trend might still hold some promise, the immediate daily momentum is not strongly committed. This nuanced technical landscape demands a patient, level-headed approach.
The broader market context, particularly the performance of the US Dollar Index (DXY) and major equity indices, adds another layer of complexity. The DXY, currently trading around 97.9, is in a neutral trend on the 1-hour and 4-hour charts but shows a strong bearish trend on the daily timeframe with RSI at 40.62. A weakening dollar typically provides a tailwind for gold, as it becomes cheaper for holders of other currencies. However, the DXY's current mixed signals reflect broader uncertainty about the Federal Reserve's future policy path. On the equity front, the S&P 500 is showing a strong bullish trend on the 1-hour and 4-hour charts, reaching 6572.87, but exhibits a bearish daily trend. Similarly, the Nasdaq 100 is bullish across shorter timeframes, trading at 26682.75, but its daily trend is neutral. This divergence between shorter-term bullishness and longer-term caution in equities might suggest a 'risk-on' sentiment is currently dominant, but it's fragile. For gold, this dynamic is crucial: a strong equity market can sometimes dampen safe-haven demand, but persistent inflation fears, often linked to energy prices, can simultaneously boost gold's appeal.
Geopolitical developments, though somewhat subdued recently, remain a background hum influencing gold's safe-haven appeal. The news that Iran has reopened the Strait of Hormuz for all ships, as reported by PriceONN, has indeed eased immediate oil price fears, contributing to the recent downturn in crude. WTI falling below $84/bbl is a direct consequence of this perceived de-escalation. This easing of immediate energy supply concerns has, in turn, reduced some of the inflation premium that had been supporting gold. However, the underlying geopolitical landscape remains complex. While the Strait of Hormuz situation may have calmed, broader regional tensions and diplomatic dialogues, such as the US-Iran peace talks mentioned in recent PriceONN market news, continue to be closely monitored. Any renewed flare-up or breakdown in diplomatic efforts could quickly reignite safe-haven demand for gold. The market's reaction to these events highlights gold's persistent role as a hedge against uncertainty, even when other factors seem to point in a different direction. The price at $4,834.08 reflects this cautious optimism, a belief that while immediate conflict risks have receded, the potential for renewed instability keeps a floor under the precious metal.
Looking at the broader economic calendar, the upcoming US Retail Sales data, expected to show a significant jump in March due to rising gasoline prices (as noted by PriceONN), will be a key event. While higher gas prices might boost the headline number, the underlying consumer spending resilience amidst these costs will be closely scrutinized. Analysts are anticipating an outsized gain, but the true health of the US consumer will be revealed in the details. Furthermore, the upcoming Fed minutes and any related commentary from Fed officials will be pivotal. The market is currently pricing in a complex outlook for interest rates, with mixed signals regarding future policy moves. If inflation data continues to be 'sticky', as suggested by some recent reports, the Federal Reserve might be compelled to maintain a hawkish stance for longer, which could support the dollar and put pressure on gold. Conversely, any signs of cooling inflation or a significant economic slowdown could lead to expectations of rate cuts, potentially weakening the dollar and boosting gold prices. The current neutral stance of gold around $4,834.08 suggests that the market is waiting for these macroeconomic pieces to fall into place.
The strength of the US Dollar Index (DXY) is a critical variable in the gold equation. Currently trading around 97.9, the DXY's daily chart shows a bearish trend with RSI at 40.62, suggesting potential weakness ahead. However, its 1-hour and 4-hour charts display a neutral to bullish trend. This inconsistency mirrors the broader market's indecision. Historically, a weaker dollar makes gold more attractive to international buyers, potentially driving prices higher. A stronger dollar, conversely, tends to weigh on gold. The current price action of XAUUSD at $4,834.08 appears to be somewhat decoupled from the dollar's immediate movements, perhaps indicating that other factors, like geopolitical risk or inflation expectations, are temporarily taking precedence. However, a sustained move in the DXY, either up or down, will undoubtedly influence gold. If the Fed signals a more hawkish stance in its upcoming minutes, it could bolster the dollar and cap gold's upside potential, even if inflation remains a concern. Conversely, any hint of a dovish pivot or a significant economic slowdown would likely weaken the dollar and provide a strong tailwind for gold.
The relationship between gold and equity markets, particularly US indices like the S&P 500 and Nasdaq 100, offers further insight. While gold is often considered a safe-haven asset, its correlation with equities can be complex. Currently, the S&P 500 and Nasdaq 100 show strong bullish trends on shorter timeframes but neutral to bearish trends on the daily. This suggests a degree of optimism in the immediate trading environment, potentially diverting some capital away from safe havens like gold. However, the underlying economic data and central bank policies are crucial. If inflation remains elevated and the Fed is forced to maintain higher interest rates, it could eventually put a damper on equity market performance, increasing the appeal of gold. The current price of $4,834.08 for XAUUSD reflects a market that is weighing these competing forces. The potential for a risk-off environment, driven by persistent inflation or unexpected economic headwinds, could see gold benefit as investors seek refuge.
The technical indicators provide a mixed but leaning-positive outlook on the shorter timeframes. On the 1-hour chart, the RSI at 53.37 and MACD showing positive momentum suggest continued upward potential, though the Stochastic oscillator is hinting at a possible short-term pullback. The ADX at 27.71 reinforces a strong trend. The 4-hour chart is even more compelling, with RSI at 59.02, a Stochastic crossover signalling a buy, and a strong ADX of 20.46, all pointing towards further gains. The general signal on this timeframe is a strong 'BUY'. However, the daily timeframe introduces caution. RSI at 53.91, a Stochastic %K below %D, and a relatively weak ADX of 22.43 suggest that the longer-term trend is not yet firmly established. This conflict between short-term bullish signals and longer-term neutrality is typical of consolidation phases. Traders must be mindful that a break above the $4,868.67 resistance on the 4-hour chart could trigger further upside, while a failure to hold support around $4,803.12 could signal a deeper correction.
The implications for different types of traders are varied. For scalpers and short-term traders, the neutral 1-hour trend around $4,834.08 offers opportunities within the immediate support and resistance levels of $4,841.39 and $4,865.55. A break of either could lead to quick profits. Swing traders, however, will likely be more focused on the 4-hour chart's bullish signals. A sustained move above $4,868.67, confirmed by daily indicators, could set the stage for a rally towards higher resistance levels. They would be looking for confirmation on the daily chart before committing significant capital. Long-term investors, meanwhile, are probably more concerned with the underlying macroeconomic narrative. Persistent inflation, central bank policy shifts, and geopolitical stability (or lack thereof) are the primary drivers. For them, the current price around $4,834.08 might represent an attractive entry point if they believe the long-term bullish case for gold remains intact, driven by systemic risks and potential currency debasement. They would be watching the daily trend indicators and major economic data releases for confirmation.
The recent PriceONN news regarding the potential breakout above $4,900, as well as the focus on US-Iran peace talks, paints a picture of a market poised for movement, but waiting for a catalyst. The fact that gold tested $4,800 amid hopes for diplomacy and a weaker dollar previously highlights its sensitivity to these macro factors. Currently, the price at $4,834.08 reflects a market that has partially priced in the de-escalation but remains aware of underlying risks. If diplomatic progress stalls or if new geopolitical tensions emerge, gold could quickly find support. Conversely, a strong US economic report that reinforces expectations of a hawkish Fed could dampen gold's appeal, especially if the dollar strengthens significantly. The market sentiment appears to be one of cautious optimism, but the underlying fundamentals suggest that volatility is likely to remain a key feature.
As we look towards the coming week, several factors will be critical for XAUUSD. The upcoming US Retail Sales data and any further commentary from Fed officials will provide crucial insights into the economic trajectory and the central bank's policy path. Any signs of persistent inflation could reinforce the case for higher-for-longer interest rates, potentially pressuring gold. Conversely, a significant economic slowdown or a shift in Fed rhetoric towards easing could trigger a rally. Geopolitically, any renewed tensions or significant diplomatic breakthroughs will have an immediate impact. Technically, the levels around $4,803 (support) and $4,868 (resistance) on the 4-hour chart will be key. A decisive break above $4,868, confirmed by daily indicators, could open the door to $4,934. On the downside, a break below $4,803 could signal a move towards $4,759.
The current market environment for gold, trading around $4,834.08, is a testament to the complex interplay of geopolitical events, macroeconomic data, and central bank policy. While recent de-escalation in the Middle East has reduced immediate pressure, the underlying risks and the ongoing debate surrounding inflation and interest rates keep gold on the radar. The technical indicators present a mixed picture, with short-term bullish signals tempered by longer-term neutrality. This suggests a period of consolidation or a potential breakout waiting for a clear catalyst. As always, disciplined risk management is paramount. Traders should pay close attention to the key levels identified and await confirmation from macroeconomic data releases or geopolitical developments before committing to significant positions.
Bearish Scenario: Consolidation and Potential Downside
60% ProbabilityNeutral Scenario: Range-Bound Trading
30% ProbabilityBullish Scenario: Upside Breakout
10% ProbabilityFrequently Asked Questions: XAUUSD Analysis
What happens if XAUUSD breaks below the $4,803.12 support level?
A break below the 4-hour support at $4,803.12 could signal a bearish move, potentially targeting the next support at $4,759.83. This would likely be invalidated if price reclaims levels above $4,893.08.
Should I buy XAUUSD at current levels around $4,834 given the mixed daily trend?
Caution is advised. While 1-hour and 4-hour charts show bullish momentum, the daily trend is neutral. A high-probability entry would require a confirmed break above $4,868.67 resistance, targeting $4,890.93, or a confirmed hold of $4,803.12 support.
Is the RSI at 59.02 on the 4-hour chart a buy signal for XAUUSD?
An RSI of 59.02 indicates a bullish bias but is not yet in overbought territory. Combined with other bullish indicators on the 4-hour chart, it supports potential upside, but confirmation from price action breaking key resistance levels is needed.
How will upcoming US economic data affect XAUUSD prices around $4,834?
Stronger-than-expected US Retail Sales or persistent inflation figures could lead to a stronger dollar and pressure gold. Conversely, weak data or signs of economic slowdown might weaken the dollar and boost gold prices towards $4,868.67 and beyond.
| Indicator | Value | Signal | Interpretation |
|---|---|---|---|
| RSI (14) | 53.37 | Neutral | Neutral zone, slight upward bias |
| MACD Histogram | 0.35 | Bullish | Positive momentum, above signal line |
| Stochastic (%K) | 64.62 | Bearish Crossover | %K |
| ADX | 27.71 | Strong Trend | Confirms strong upward trend on 1H |
| Bollinger Bands | Middle Band | Bullish | Price above middle band |
Track markets in real-time
AI-powered analysis, technical indicators and real-time price data.
Join Our Telegram Channel
Breaking market news, AI analysis and trading signals instantly.
Join Channel