

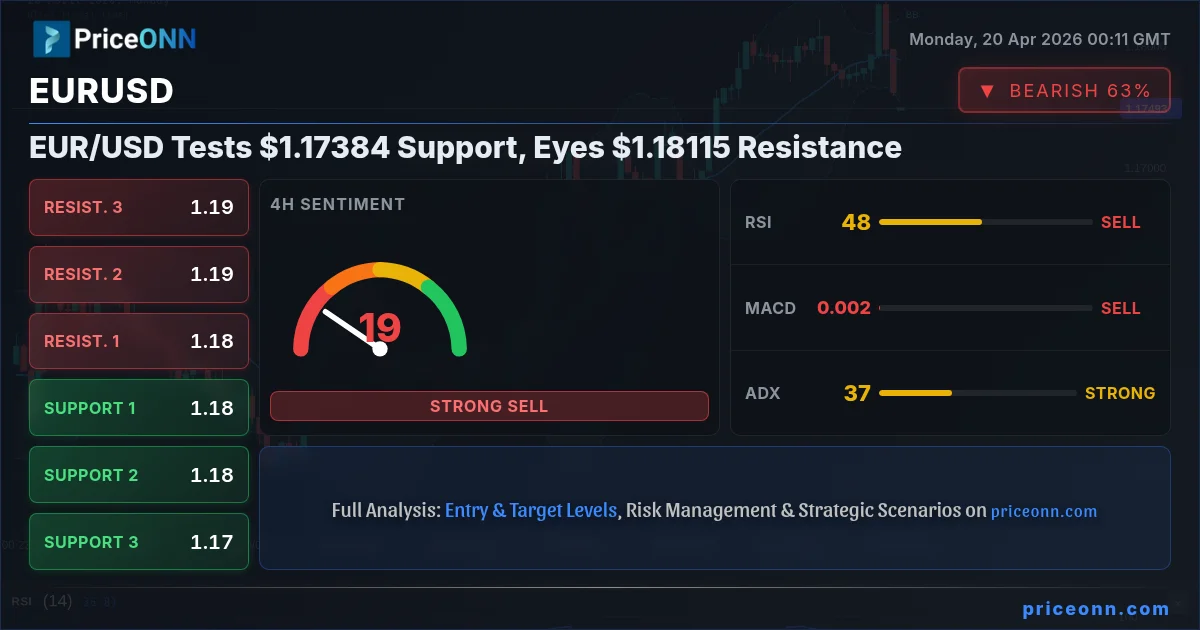
The recent price action in EUR/USD presents a complex picture for traders, hovering precariously near the 1.17384 support level. As the market grapples with a strengthening US Dollar Index (DXY) and divergent technical indicators, the critical question remains whether the pair can muster the strength to challenge the 1.18115 resistance. This analysis delves into the interplay of macroeconomic factors, geopolitical undercurrents, and intermarket dynamics to decipher the immediate trading outlook for EUR/USD, offering a nuanced perspective for informed decision-making.
- EUR/USD RSI at 32.75 on the 1H chart signals bearish pressure, approaching oversold territory.
- Critical support for EUR/USD sits at $1.1732, tested multiple times this week.
- The DXY's advance to 98.11 is a key driver, correlating with EUR/USD's downward pressure.
- Mixed signals from 4H and 1D charts suggest a potential consolidation phase before the next directional move.
Navigating the Dollar's Ascent
The US Dollar Index (DXY) is currently trading at 98.11, showing a noticeable uptick of 0.15% on the day. This strengthening dollar is a significant headwind for EUR/USD, which is currently priced at $1.17502. Historically, a rising DXY tends to put downward pressure on major currency pairs like EUR/USD, as it signifies increased demand for the greenback relative to a basket of other major currencies. The intraday movement of the DXY, though modest, reflects a broader market sentiment that may be favoring safe-haven assets, a trend often amplified during periods of geopolitical uncertainty or economic apprehension.
The current technical setup for the DXY on the 1H timeframe shows a neutral trend with 50% strength, but with an RSI at 65.37 indicating upward momentum. The MACD is positive, and the Stochastic oscillator shows a clear buy signal (%K > %D). However, the 4H chart presents a more complex picture, with a neutral trend and a stronger ADX of 35.54 suggesting a robust trend, albeit potentially fading. The RSI at 54.31 is neutral, but the Stochastic is showing a bearish crossover. On the daily chart, the DXY shows a bearish signal with RSI at 43.39 and negative MACD momentum. This divergence across timeframes suggests that while the dollar has seen some intraday strength, its longer-term trajectory might be facing headwinds, creating a complex correlation for EUR/USD traders to untangle.
EUR/USD: Caught Between Support and Dollar Strength
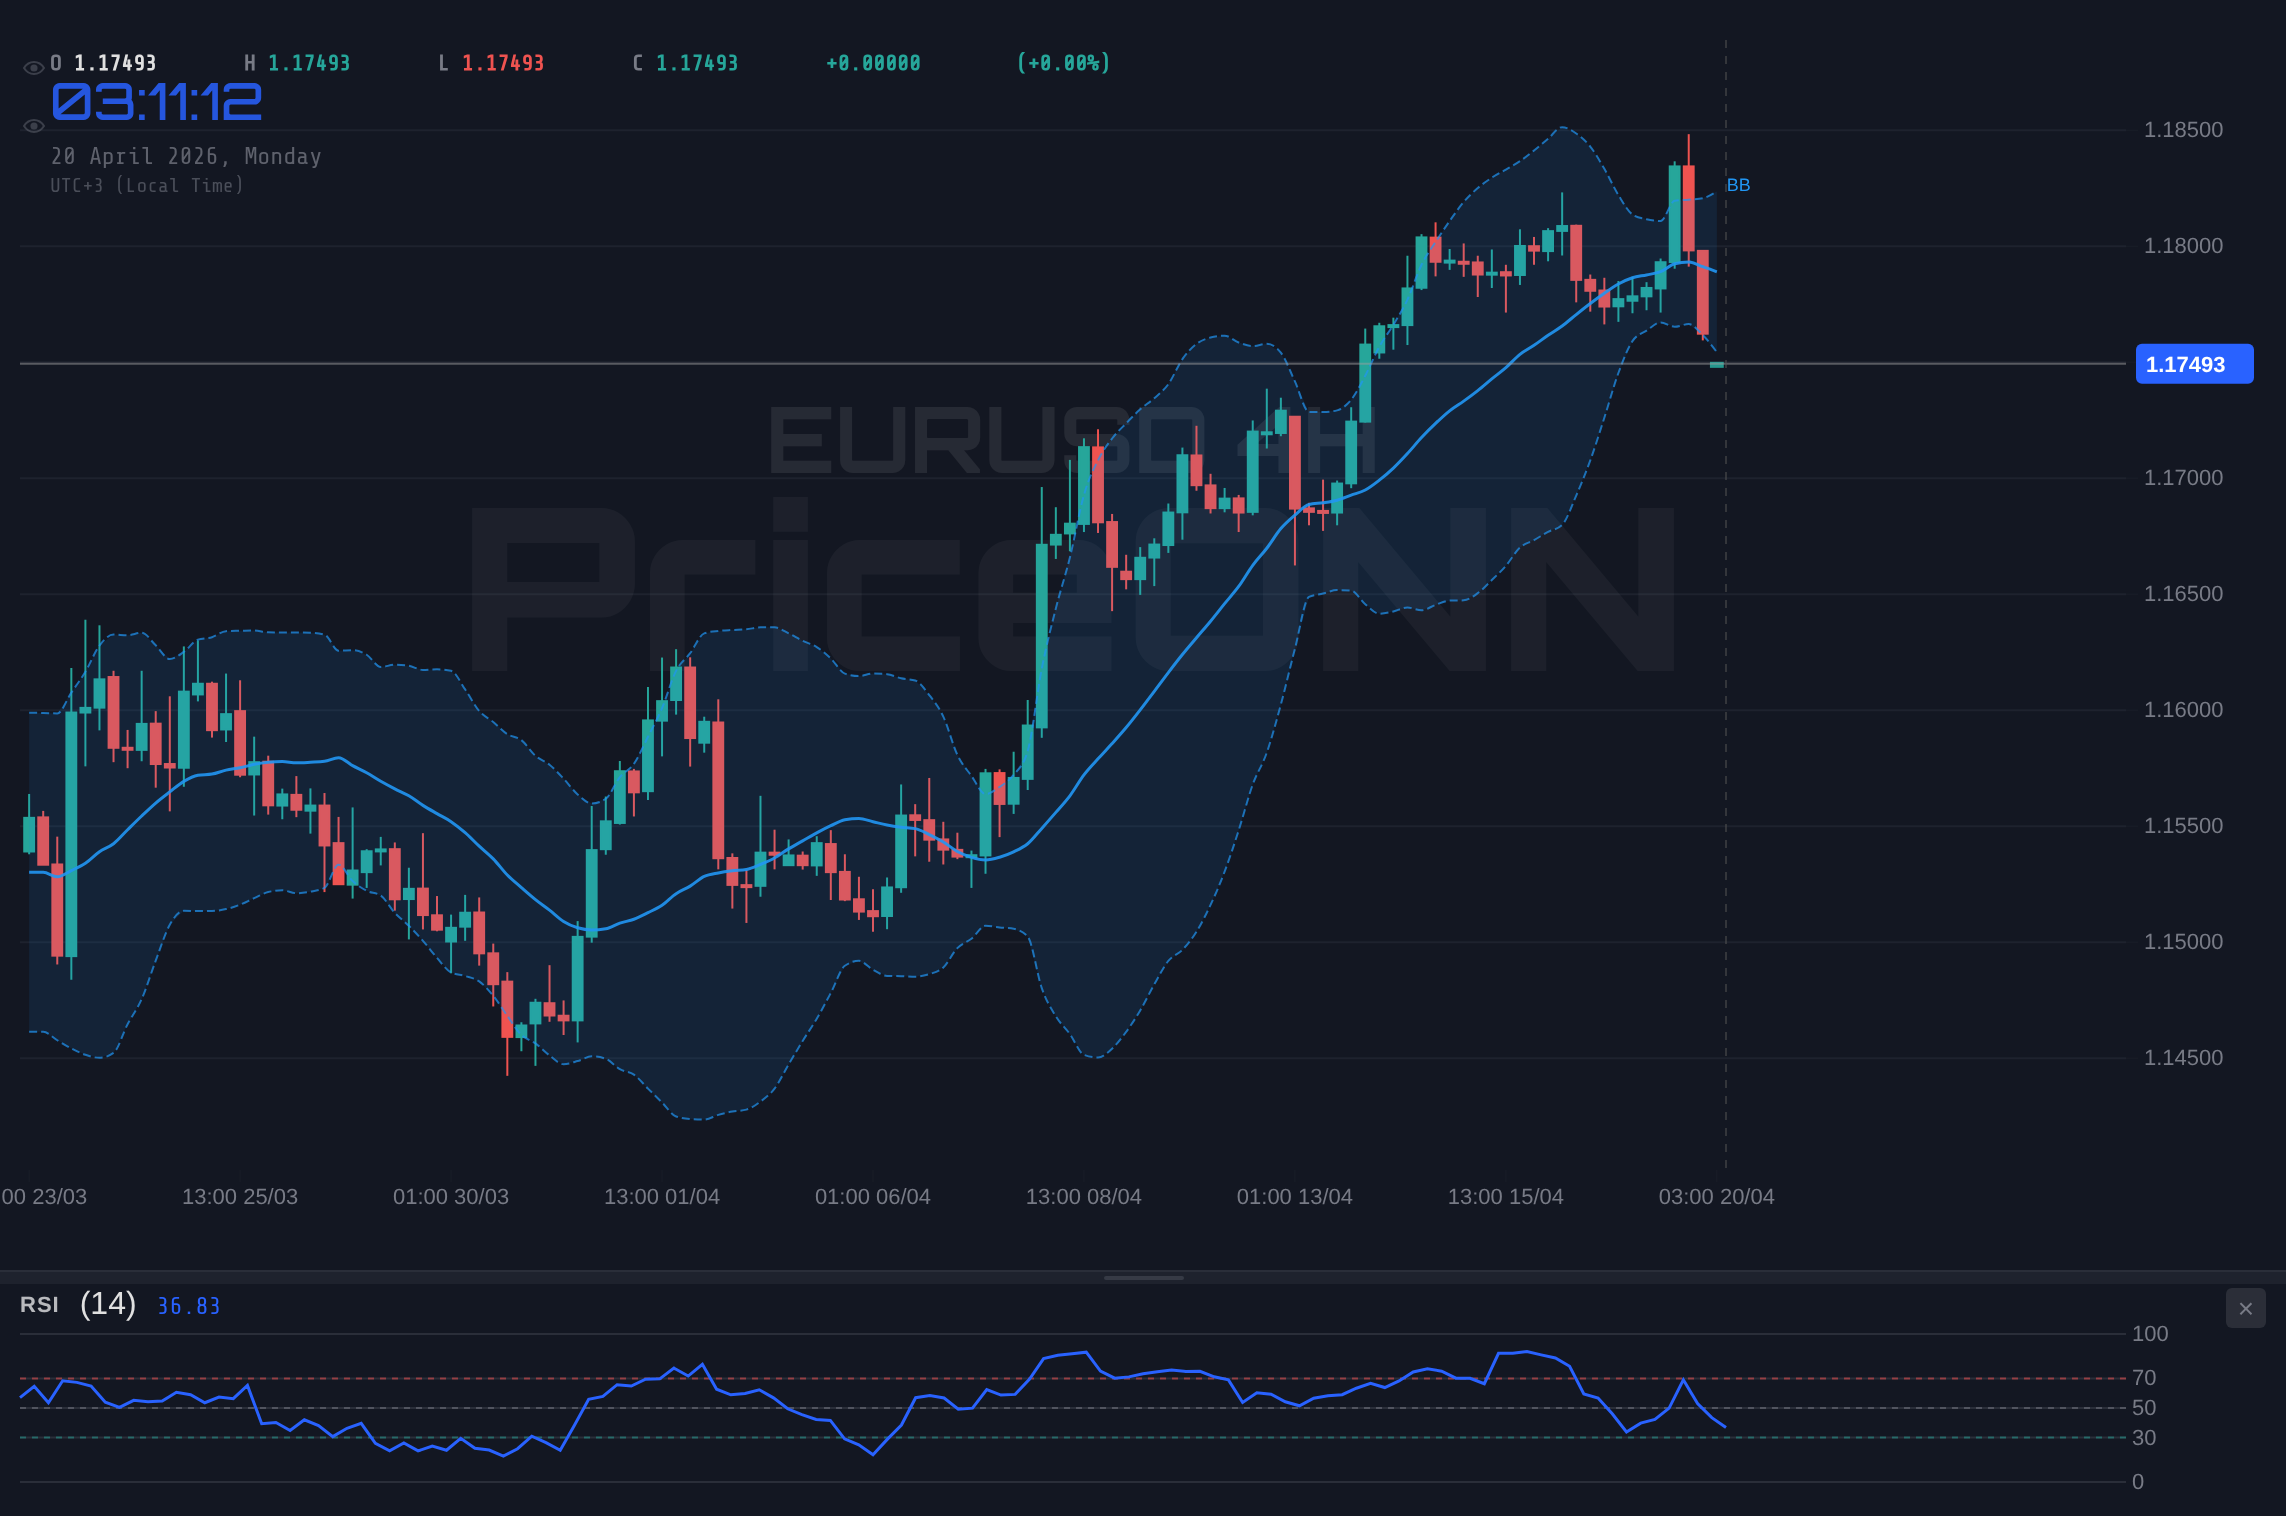
The EUR/USD pair is currently exhibiting bearish momentum on the 1-hour chart, trading at $1.17502. The immediate support levels are identified at $1.1732, $1.1725, and $1.17213. The RSI(14) reading of 32.75 on this timeframe is firmly in neutral territory but trending downwards, indicating a bearish inclination. This is further supported by negative MACD momentum and the price trading below the middle Bollinger Band, suggesting a bearish bias in the short term. The Stochastic oscillator is in the oversold region with %K below %D, hinting at potential for a bounce, but the ADX at 21.12, while indicating a moderate downtrend, isn't showing extreme strength. The overall signal on the 1H is a 'SELL', with 6 out of 8 indicators pointing downwards.
However, the picture shifts when we examine the longer timeframes. The 4-hour chart shows a neutral trend with a stronger ADX of 37.16, indicating a more established trend, though the signal is mixed. While the RSI at 47.83 is neutral and trending down, the Stochastic is showing a bullish crossover (%K > %D). The price is currently below the lower Bollinger Band, which could signal oversold conditions or an impending breakdown. The daily chart presents an even more bullish tilt, with a neutral trend but a strong RSI of 60.87 and positive MACD momentum. The price is above the middle Bollinger Band, and the Stochastic is in overbought territory with a bearish crossover (%K
Intermarket Dynamics: Gold and Equities
The current market environment is heavily influenced by the performance of major risk assets and commodities. Gold, trading at $4753.35, is experiencing a notable decline of 0.78% ($37.19) on the day. The 1-hour technicals for XAUUSD are predominantly bearish, with RSI at 32.02 and ADX at 28.85, indicating a strong downtrend. However, the 4-hour chart shows a bullish trend with an RSI of 43.2, and the daily chart exhibits a neutral trend with an RSI of 49.23. This mixed picture in gold, often seen as a safe-haven asset, could imply that global risk appetite is not uniformly deteriorating, or that specific factors are at play within the precious metals market itself. The decline in gold, despite some geopolitical tensions, might be a consequence of dollar strength or a rotation out of safe havens into other asset classes.
In contrast, US equities are showing resilience. The S&P 500 is up 0.74% at 6572.87, and the Nasdaq 100 has gained 0.64% to 26469.99. This risk-on sentiment in equities, particularly the tech-heavy Nasdaq, is somewhat at odds with the dollar's strength and gold's weakness. The S&P 500's 1-hour chart shows a strong bullish trend with an RSI of 70.95 nearing overbought territory, while the Nasdaq 100's 4-hour chart also indicates a strong bullish trend with an RSI of 70.83. This divergence between commodities (gold down) and equities (stocks up), coupled with a rising dollar, creates a complex tapestry of market signals. It suggests that the drivers for each asset class are varied, potentially including specific sector performance in equities, central bank policy signals influencing the dollar, and perhaps temporary factors affecting gold prices.
Geopolitical Currents and Central Bank Whispers
The geopolitical landscape remains a key, albeit often unpredictable, driver of market sentiment. Recent news regarding the Strait of Hormuz, with reports of its temporary reopening following earlier tensions, injected some volatility into oil prices. Brent crude is down 1.41% at $98.03, and WTI is down 1.29% at $91.44. While the easing of tensions might suggest a reduction in immediate risk, the underlying geopolitical dynamics in the Middle East remain a constant source of potential disruption, capable of impacting energy prices and, by extension, inflation expectations globally. This volatility in oil markets can indirectly influence central bank policy decisions, as elevated energy prices contribute to inflationary pressures.
On the central bank front, while no major high-impact events are scheduled for today, the market continues to digest recent commentary and economic data. The upcoming US Retail Sales data, expected with a forecast of 1.4%, will be crucial for gauging consumer resilience amidst rising inflation. Any deviation from expectations could significantly impact the Federal Reserve's policy outlook, which in turn, heavily influences the DXY and consequently, EUR/USD. Similarly, upcoming UK inflation data and US PMI figures will provide further clues on the economic health of major economies, shaping the broader market sentiment and potentially influencing the direction of EUR/USD. The lingering question remains whether inflation is truly cooling or proving more persistent, a debate that will continue to dominate financial markets and central bank policy discussions.
Trading Scenarios for EUR/USD
Given the conflicting signals across different timeframes and asset classes, a multi-scenario approach is warranted for EUR/USD. The short-term technicals lean bearish, but the longer-term picture, coupled with equity market strength, introduces elements of potential upside. The key will be how the pair reacts to the immediate support and resistance levels, and whether any significant economic data releases provide a clear directional catalyst.
Bearish Scenario: Dollar Dominance Persists
65% ProbabilityConsolidation: Choppy Waters Ahead
25% ProbabilityBullish Reversal: Dollar Weakness Returns
10% ProbabilityThe Road Ahead: What Traders Should Watch
The immediate outlook for EUR/USD hinges on the interplay between short-term bearish technical signals and the potential for longer-term dollar weakness or a shift in risk sentiment. The 1-hour chart strongly suggests a bearish bias, with multiple indicators aligning for a potential move lower towards $1.17213 and possibly $1.16977. However, the conflicting signals on the 4-hour and daily charts, particularly the strong RSI and MACD readings on the daily timeframe, indicate that this bearish move might be a short-term correction within a broader range or even a precursor to a reversal if key resistance levels are breached.
Traders should pay close attention to the $1.1732 support level. A decisive break below this could trigger further selling, targeting the $1.17213 and $1.16977 levels. Conversely, if EUR/USD manages to hold above $1.1732 and shows signs of recovery, especially if the DXY begins to falter, then a move towards the $1.17534 resistance becomes plausible. A sustained push above this level, ideally confirmed by a pullback in the DXY, could open the door for a more significant rally towards the $1.18115 resistance. The upcoming US Retail Sales and PMI data releases will be critical in shaping the market's direction, potentially providing the catalyst needed to break out of the current indecision.
The current ADX readings across timeframes are notable. The 1H shows a moderate downtrend (ADX 21.12), the 4H shows a strong uptrend (ADX 37.16), and the 1D shows a strong uptrend (ADX 28.38). This divergence in trend strength signals is particularly interesting. The strong ADX on the 4H and 1D charts, despite the current bearish price action on the 1H, suggests that underlying bullish momentum might still be present on longer timeframes. This could mean that the current dip is a buying opportunity for those with a longer-term perspective, provided that key support levels hold. However, for short-term traders, the bearish signals on the 1H are more relevant, suggesting caution and a focus on potential downside targets.
The Stochastic oscillator also provides conflicting information. On the 1H, it's oversold, suggesting a potential bounce. On the 4H, it's showing a bullish crossover, reinforcing the idea of a potential upward move. Yet, on the daily chart, it's in overbought territory with a bearish crossover, indicating that the longer-term uptrend might be losing steam or is due for a correction. This stochastic divergence is a classic sign of market indecision and highlights the importance of waiting for confirmation before committing to a trade. The interplay between these indicators, combined with the price action around the critical support at $1.1732 and resistance at $1.18115, will dictate the next significant move for EUR/USD.
Frequently Asked Questions: EURUSD Analysis
What happens if EUR/USD breaks below the $1.1732 support level?
A break below $1.1732 on the 1H chart would invalidate the current consolidation pattern and likely trigger further downside. The immediate targets would then be $1.17213, followed by the daily support level at $1.16977. This scenario gains probability if the DXY continues its upward trend.
Should I buy EUR/USD at current levels of $1.1750 given the mixed signals?
Buying at current levels carries risk due to the bearish 1H signals and the strong DXY. A more prudent approach would be to wait for confirmation, such as a hold above $1.1732 and a break of $1.17534 resistance, or wait for a confirmed bounce from oversold conditions on the 1H chart. The probability of a short-term bounce is higher if the 1H Stochastic remains oversold.
Is the RSI at 32.75 on the 1H chart a sell signal for EUR/USD?
An RSI of 32.75 on the 1H chart indicates bearish momentum but is not yet in extreme oversold territory (typically below 30). While it suggests downward pressure, it also implies that further downside might be limited in the very short term. A sustained move below 30 would strengthen the sell signal and increase the likelihood of a bounce if price action supports it.
How will the upcoming US Retail Sales data affect EUR/USD this week?
Stronger-than-expected US Retail Sales data (forecast 1.4%) would likely boost the DXY and put further downward pressure on EUR/USD, potentially reinforcing the bearish scenario. Conversely, weaker data could lead to dollar pullback, supporting a bullish move for EUR/USD towards the $1.18115 resistance level.
Track markets in real-time
AI-powered analysis, technical indicators and real-time price data.
Join Our Telegram Channel
Breaking market news, AI analysis and trading signals instantly.
Join Channel