

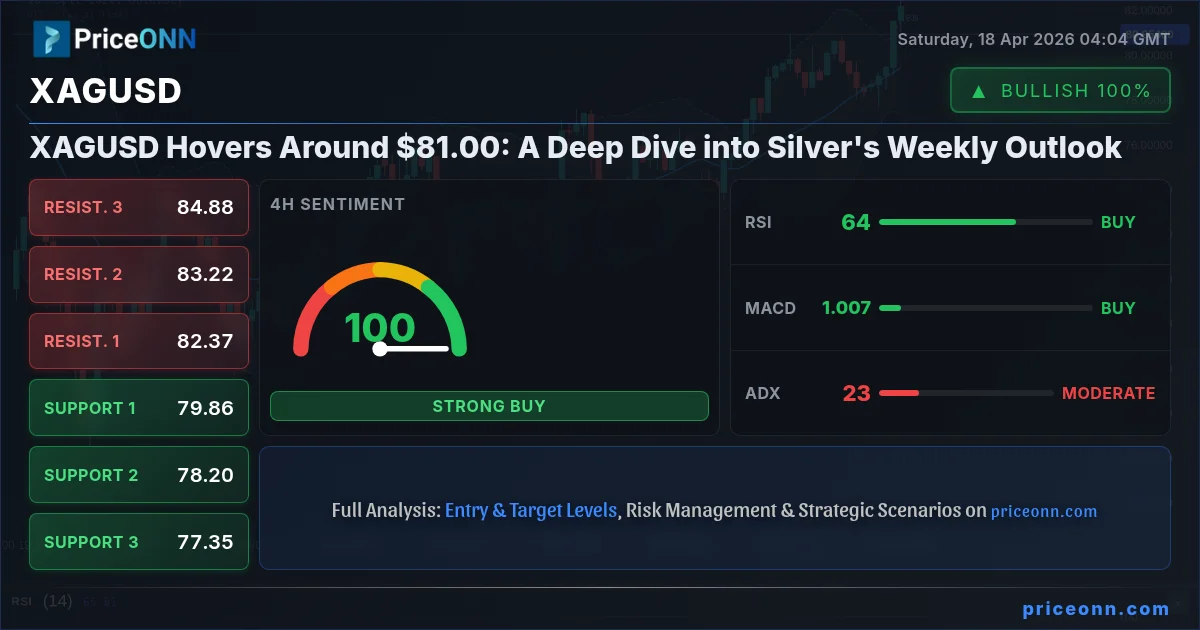
Last Friday, silver (XAGUSD) concluded its trading week hovering around the critical $81.00 mark, a level that has seen significant attention from traders and analysts alike. After a notable 3.3% gain for the week, the precious metal is at a crucial juncture, with its next move heavily dependent on a confluence of technical signals and evolving macroeconomic winds. This comprehensive analysis delves into the past week's price action, explores the technical landscape, and examines the fundamental drivers that are likely to shape silver's trajectory in the coming week. From the nuances of its correlation with the US Dollar Index (DXY) to the impact of inflation data and central bank policy expectations, we aim to provide a clear roadmap for navigating the silver market.
- XAGUSD closed near $81.00 after a 3.3% weekly gain, indicating consolidation after a strong move.
- The 1-hour RSI at 53.37 shows neutral momentum, while the 4-hour RSI at 59.02 suggests a bullish lean, highlighting a mixed short-term picture.
- Key support for XAGUSD is observed at $81.00, with immediate resistance noted around $81.85.
- The US Dollar Index (DXY) is currently trading around 97.90, showing a mixed signal that could influence silver's direction.
- Upcoming economic data, particularly on inflation and employment, will be crucial for shaping the outlook for both silver and the broader market.
Navigating the $81.00 Crossroads: Last Week's Price Action
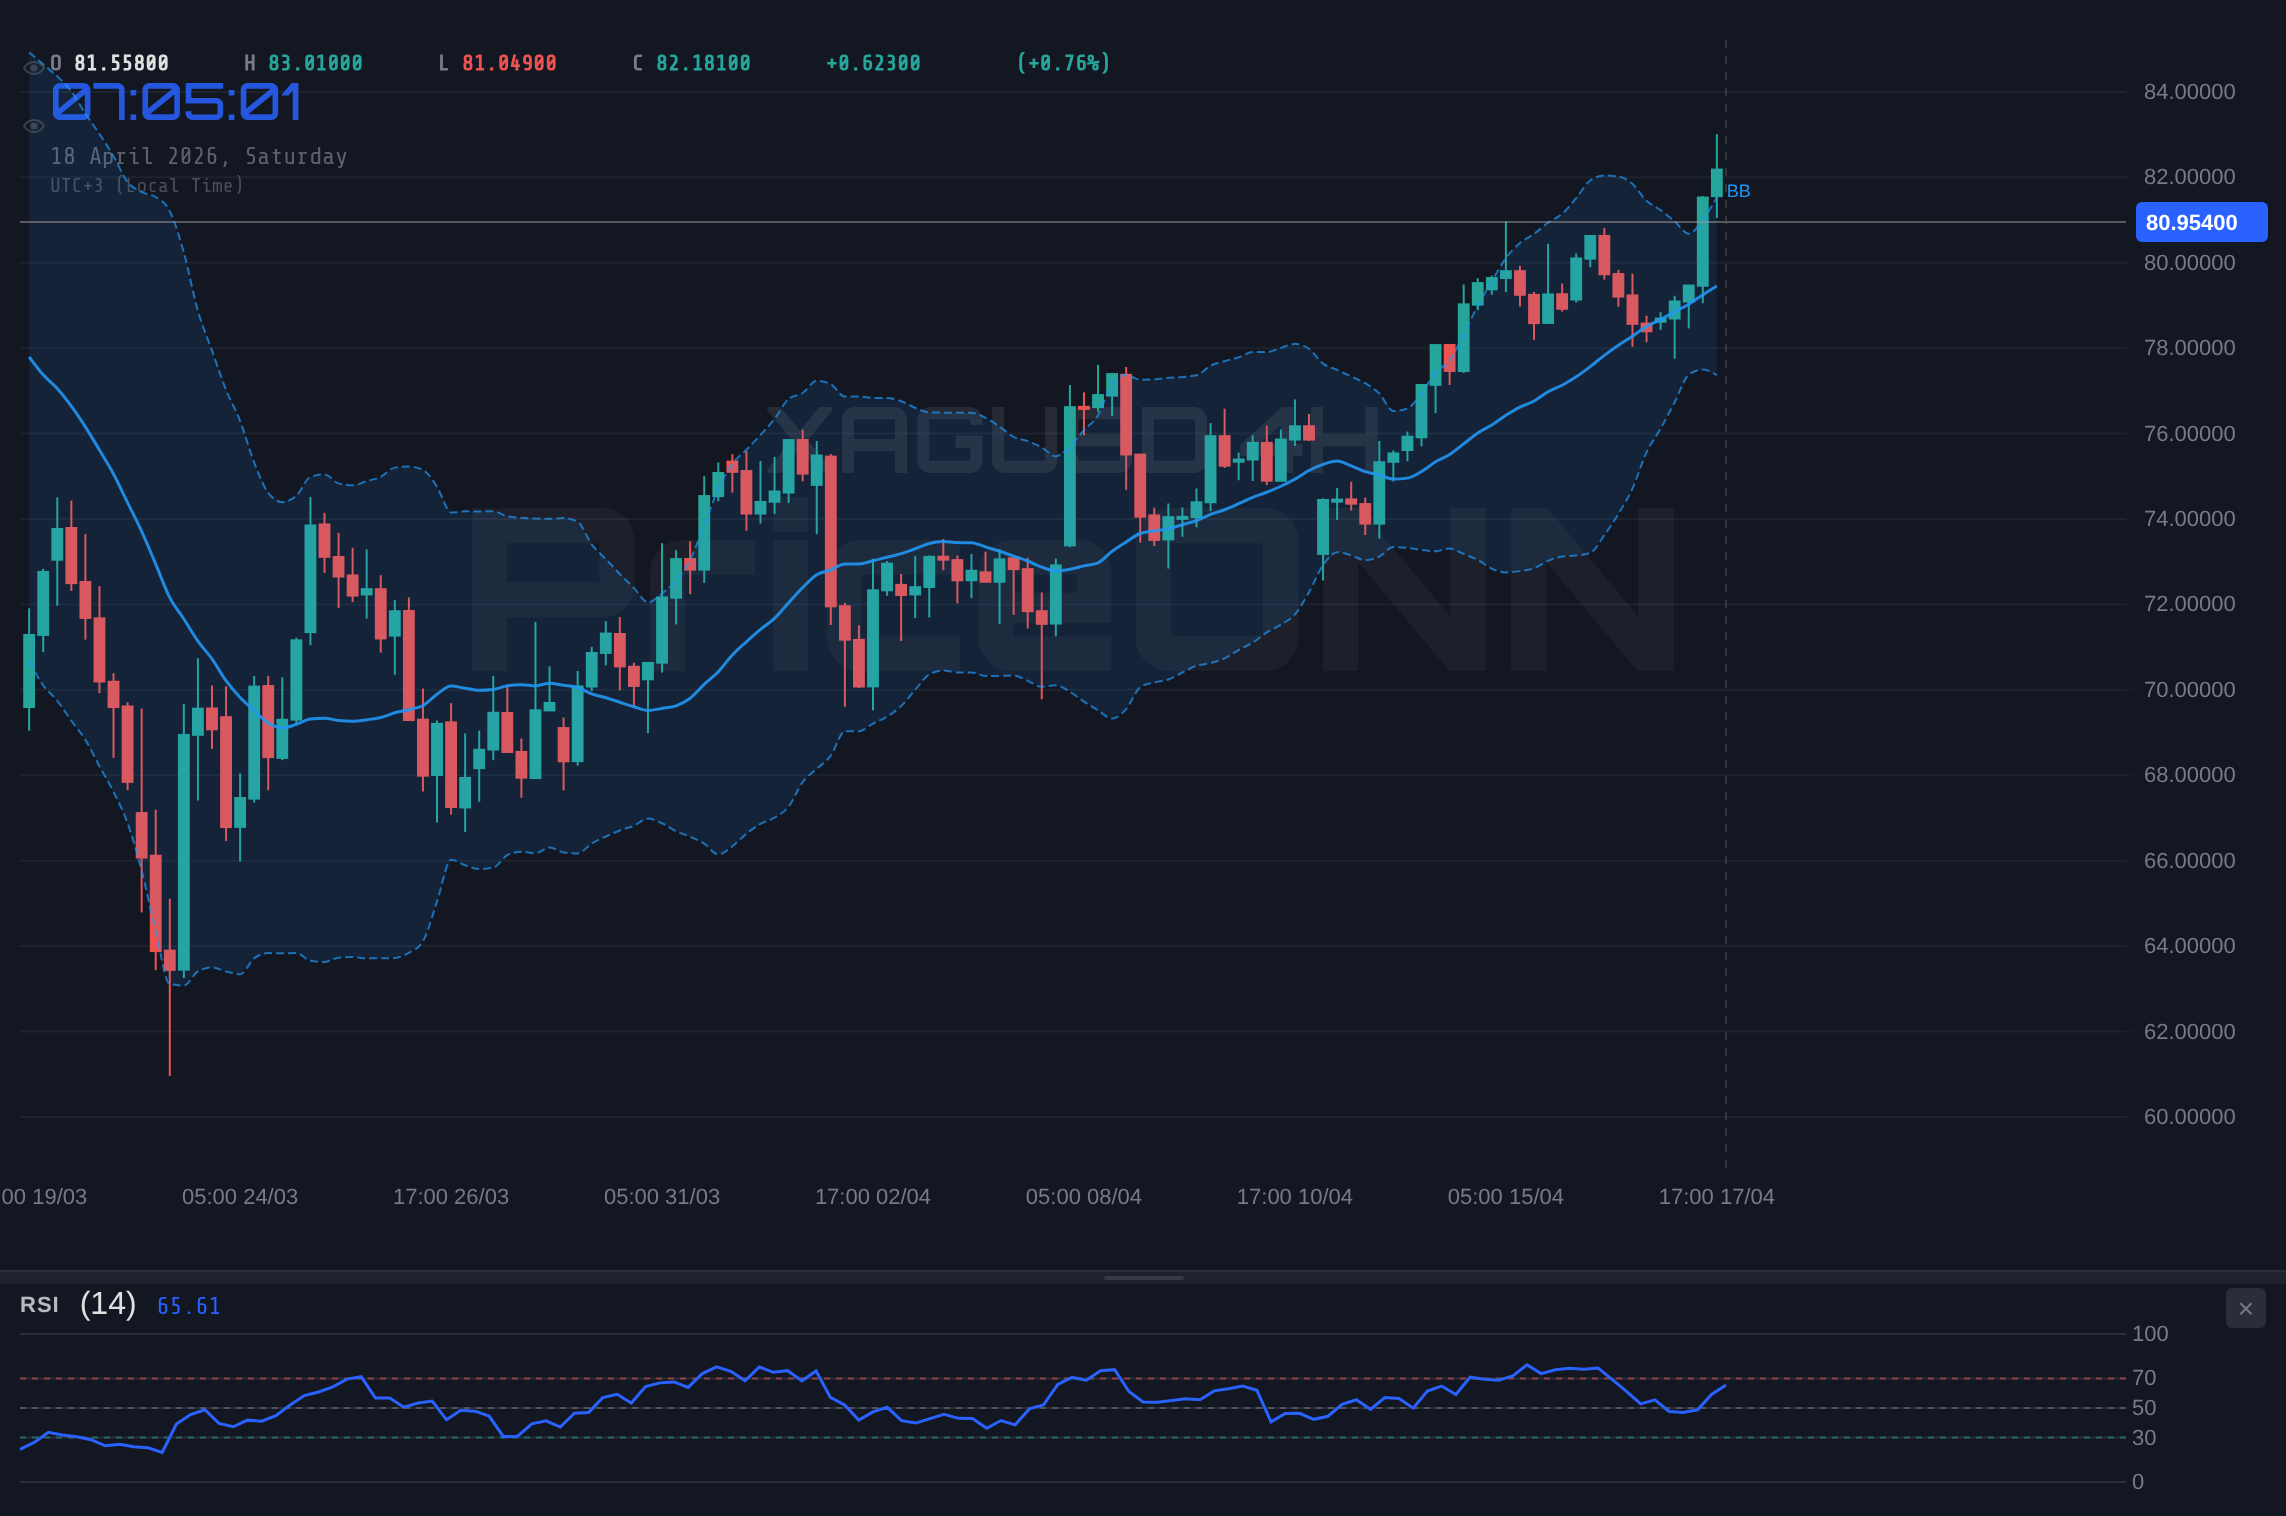
The past week was a dynamic one for XAGUSD, characterized by a robust upward move culminating in a close near the $81.00 psychological level. This 3.3% weekly appreciation, translating to approximately $2.60, reflects a significant shift in market sentiment following a period of consolidation. The journey to $81.00 was not a straight line; the metal experienced volatility, with price action ranging from a low of $77.75 to a high of $83.01. This wide daily range underscores the underlying choppy conditions, but the overarching trend for the week was decidedly bullish. The strength observed on Friday, pushing the price towards the week's high, suggests that buyers were in control as the market closed. This upward momentum, however, now faces the challenge of consolidating gains at these higher levels, setting the stage for a critical test of resolve in the coming trading sessions. Understanding the drivers behind this recent rally is paramount to assessing its sustainability.
Several factors contributed to silver's impressive weekly performance. Firstly, softer inflation data released earlier in the week, which came in below forecasts, weakened the US dollar. The DXY, which typically moves inversely to silver, saw a pullback from its recent highs around 98.00. This dollar weakness provided a significant tailwind for dollar-denominated commodities like silver. Secondly, renewed geopolitical tensions, although not explicitly detailed in the provided news snippets, often increase demand for safe-haven assets, and silver, alongside gold, benefits from such flows. The PriceONN market news also highlighted several articles suggesting a potential silver recovery, with Elliott Wave patterns pointing towards a path to $89 and analysts eyeing gains, even as some noted a temporary stall at the 100-day SMA. This blend of macroeconomic shifts and potential safe-haven demand created a fertile ground for silver's ascent.
However, the rally was not without its cautionary signals. Some reports indicated that silver tumbled below $73 on Monday amidst rising geopolitical tensions, suggesting that the path upwards has been far from smooth and that significant selling pressure can emerge quickly. The fact that the price stalled around certain technical resistance levels, even as the overall trend was upward, hints at the presence of strong selling interest at higher prices. The Stochastic indicator on the 1-hour chart, for instance, showed a 'Düşüş sinyali' (%K
The Technical Picture at $81.00: Mixed Signals Across Timeframes
At the $81.00 level, XAGUSD presents a complex technical tapestry woven from indicators across multiple timeframes. On the 1-hour chart, the trend is classified as 'Yükseliş' with a strength of 84%. The RSI(14) sits at 56.78, firmly in neutral territory but with a bullish inclination, while the ADX at 27.43 confirms a strong uptrend. Stochastic, however, shows a bearish divergence (%K=59.56, D=79.73), indicating a potential for short-term weakness. The MACD is positive, and prices are trading above the middle Bollinger Band, reinforcing the bullish short-term outlook, yet the Stochastic reading is a clear warning.
Stepping back to the 4-hour timeframe, the bullish conviction strengthens. The trend is 'Yükseliş' with a power score of 92%. RSI(14) at 63.99 is in the upper neutral zone, and the ADX at 23.31 signals a moderately strong uptrend. Stochastic here provides a bullish signal (%K=72.23, D=41.37), aligning with the overall trend. MACD is also positive, and prices are above the middle Bollinger Band. The general signal across this timeframe is a strong 'AL' (Buy). This timeframe paints a picture of underlying strength, suggesting that the short-term bearish signals might be mere noise in a larger upward move.
The daily chart, however, introduces a dose of caution, classifying the trend as 'Nötr' with 50% strength. RSI(14) is at 58.61, still leaning bullish, but Stochastic is showing an overbought condition with K=81.31 and D=82.11, indicating potential exhaustion. The ADX at 22.81 suggests a moderately strong downtrend, which contradicts the overall bullish direction suggested by the 4-hour timeframe and the weekly close. MACD remains positive, and prices are above the middle Bollinger Band, but the Stochastic overbought condition is a significant flag. The general signal here is 'AL', but the neutral trend and overbought Stochastic temper the enthusiasm. This conflict across timeframes - bullish on 4H, neutral on 1D with overbought signals - is precisely what creates the current indecision around the $81.00 level.
Support levels on the hourly chart are found at $81.25, $81.02, and $80.65. Resistance is eyed at $81.85, $82.23, and $82.45. On the 4-hour chart, support lies at $79.86, $78.20, and $77.35, while resistance is at $82.37, $83.22, and $84.88. The daily support levels are at $77.35, $76.29, and $74.56, with resistance at $80.13, $81.87, and $82.92. The $81.00 price point sits just above the hourly support of $81.02 and below the hourly resistance of $81.85, indicating a tight range for immediate action. The critical question is whether the strength seen on the 4-hour chart can overcome the overbought conditions and neutral trend on the daily chart.
Fundamental Drivers: Inflation, The Dollar, and Geopolitics
The fundamental backdrop for silver remains a complex interplay of inflation expectations, central bank policy, and geopolitical risks. Last week's inflation data, which surprised to the downside, played a significant role in weakening the US dollar. When inflation cools more than anticipated, it reduces the urgency for central banks, particularly the Federal Reserve, to maintain hawkish monetary policies. This can lead to expectations of earlier or deeper interest rate cuts, which typically weakens the currency. For silver, a weaker dollar is generally a bullish catalyst, as it makes the metal cheaper for holders of other currencies and often correlates with increased demand for hard assets as a hedge against currency depreciation.
The current DXY level of 97.90 reflects this mixed picture. While the dollar weakened on softer inflation, it hasn't collapsed, indicating underlying resilience or perhaps other factors supporting the greenback. The US Dollar Index's movement is a critical barometer for silver traders. A sustained decline in the DXY, especially if driven by dovish Fed policy expectations, would likely provide further impetus for silver to break through its immediate resistance levels. Conversely, any signs of sticky inflation or a more hawkish tone from Fed officials could quickly reverse the dollar's fortunes and put pressure back on XAGUSD.
Geopolitical uncertainty continues to be an underlying theme. While specific events were not detailed in the recent news, the PriceONN market news highlighted a general increase in geopolitical tensions in the past week, which has historically benefited silver as a safe-haven asset. The ongoing conflicts and political instability in various regions create a 'risk-off' sentiment in the broader market, prompting investors to seek refuge in assets perceived as less volatile or more stable. Silver, often called 'poor man's gold', can benefit significantly from such sentiment shifts, especially if gold also experiences upward pressure. The interplay between inflation concerns, central bank responses, and geopolitical stability will be key in determining whether silver can maintain its upward momentum or falter under renewed pressure.
Looking ahead, upcoming economic data releases will be crucial. Events such as PMI reports, employment figures (like NFP, although not explicitly listed for the immediate next 7 days in the provided snippet, they are always market-moving), and any further inflation indicators will provide critical insights into the health of the global economy and the likely path of monetary policy. For instance, if upcoming data suggests persistent inflation, it could force central banks to maintain higher interest rates for longer, which would typically be bearish for silver. Conversely, signs of economic slowdown coupled with easing inflation would support the case for rate cuts and potentially boost XAGUSD. The market's interpretation of this data, and how it aligns with or diverges from current expectations, will be a major price driver.
The relationship between interest rates, inflation, and the US Dollar is central to silver's price action. Historically, lower interest rates and higher inflation tend to be bullish for precious metals like silver, as they reduce the opportunity cost of holding non-yielding assets and act as a hedge against purchasing power erosion. Conversely, rising rates and falling inflation typically pressure silver prices.
The Bull's Roadmap: Pushing Past $81.85
For the bulls to maintain control and drive XAGUSD higher, a decisive break above the immediate resistance at $81.85 is paramount. This level, identified on the 1-hour chart, represents the first hurdle. A successful breach and sustained trade above $81.85, ideally with increasing volume, would signal a confirmation of the bullish momentum observed on the 4-hour timeframe. The next significant resistance target would then be $82.23, followed by $82.45 on the hourly chart. If these levels are cleared, the outlook becomes considerably brighter, potentially paving the way for a move towards the 4-hour resistance at $83.22 and even challenging the psychological $84.00 mark in the medium term.
The fundamental conditions supporting such a bullish scenario would likely involve continued dollar weakness, driven by dovish signals from the Federal Reserve or other major central banks, and persistent geopolitical uncertainty. Furthermore, a clear break above the daily resistance at $81.87 would be a strong technical confirmation. The RSI on the 4-hour chart, currently at 63.99, would need to remain above 60, and ideally push towards 70, to confirm strengthening bullish momentum. The ADX on the daily chart, currently at 22.43 (indicating a moderate downtrend), would need to shift significantly higher, perhaps above 25-30, to confirm a robust uptrend. The Stochastic indicator on the daily chart, currently overbought, would ideally need to cool off slightly before a sustained move higher, or show divergence that fails to materialize into a reversal.
The trigger for this bullish scenario would be a clear, decisive break above $81.85, with subsequent confirmation above $82.23. Invalidation of this bullish thesis would occur if price fails to sustain the move above $81.85 and instead falls back below the $81.00 handle, especially if it breaks the hourly support at $81.02. The immediate target would be $82.23, followed by $82.45. A more extended target could be set around $83.22, representing the next significant resistance on the 4-hour chart. This scenario is plausible if the macroeconomic environment continues to favor risk assets and safe havens, and if the Fed signals a more accommodative stance.
The Bull's Ascent: Targeting Higher Ground
45% ProbabilityWhere Bears Take Control: Testing the $80.65 Support
Conversely, if silver fails to overcome the immediate resistance and the bearish signals across shorter timeframes gain traction, the bears could seize control. The first critical test for the bulls lies at the $81.00 psychological level, followed closely by the hourly support at $81.02 and $80.65. A decisive break below $81.02, and more importantly, a sustained close below $80.65 on the 1-hour chart, would signal a potential reversal or at least a deeper correction. This would likely be triggered by a strengthening US dollar, perhaps due to unexpected inflation data or a more hawkish stance from the Fed, or a significant de-escalation of geopolitical tensions.
Should the bears succeed in pushing XAGUSD below $80.65, the next logical downside target would be the 4-hour support at $79.86. Further selling pressure could then lead to a test of the more significant 4-hour support at $78.20. The daily chart's neutral trend and overbought Stochastic readings provide a technical basis for such a pullback. If the ADX on the daily chart, currently at 22.43 (moderate downtrend), begins to rise, it would confirm increasing bearish momentum. The RSI, currently at 58.61, would need to fall decisively below 50 to indicate a shift in sentiment.
The invalidation of this bearish scenario would occur if price action bounces strongly from any of these support levels, particularly $80.65 or $79.86, and manages to reclaim the $81.85 resistance. However, if the bearish momentum builds, the primary target would be $79.86, with a secondary target at $78.20. This scenario becomes more probable if macroeconomic data disappoints for risk assets or if the dollar finds renewed strength. The market's reaction to upcoming economic releases will be crucial in determining whether the bears can capitalize on the current technical indecision.
The Bears' Defense: A Retreat to Lower Ground
40% ProbabilityThe Waiting Game: Range-Bound Consolidation Around $81.00
It's also entirely possible that XAGUSD consolidates within a defined range for the upcoming week, especially if conflicting signals from different timeframes and economic data continue to create uncertainty. In this 'waiting game' scenario, silver would likely trade between the immediate hourly resistance of $81.85 and the hourly support around $80.65. This range-bound action often occurs when the market is digesting recent moves and awaiting clearer fundamental direction, such as major economic data releases or central bank commentary.
Technical indicators might reflect this indecision. The RSI could hover around the 50-60 level, indicating a lack of strong momentum in either direction. The ADX might remain relatively subdued, perhaps between 20 and 25, suggesting a lack of a strong trending environment. MACD could oscillate around its signal line, producing choppy, unreliable signals. The Stochastic indicators might oscillate between overbought and oversold territory without committing to a sustained move, reflecting the back-and-forth price action within the range.
For this scenario to play out, neither the bulls nor the bears would be able to decisively break through their respective key levels. The DXY might also trade in a consolidative pattern, failing to provide a clear directional bias. Geopolitical news might be mixed, offering no strong 'risk-on' or 'risk-off' sentiment. In this range-bound environment, traders would focus on the edges of the range: buying near support and selling near resistance, with tight stop-losses to manage the risk of a breakout in either direction. The key levels to watch would be $80.65 as support and $81.85 as resistance. A sustained move outside this immediate range would signal the end of the consolidation phase.
The Waiting Game: Range-Bound Indecision
15% ProbabilityThe Most Likely Path and Key Triggers to Watch
Considering the technical signals and the current macroeconomic backdrop, the most probable scenario for XAGUSD in the short to medium term leans towards a cautious bullish outlook, but with significant risk of consolidation or a sharp pullback. The strong 4-hour bullish trend, combined with the recent weekly gain and the potential for continued dollar weakness due to inflation data, suggests that upside potential exists. However, the overbought Stochastic on the daily chart and the mixed signals across different timeframes cannot be ignored. Therefore, I assign a probability of 45% to the bullish scenario, 40% to the bearish scenario (reflecting the risk of failure at current levels), and 15% to a neutral, range-bound outcome.
The key to navigating this uncertainty lies in closely monitoring specific triggers. Firstly, the sustained break above $81.85 is critical. If silver can convincingly move and hold above this level, it would validate the bullish thesis and open the door for further gains towards $82.23 and potentially $83.22. This would likely be accompanied by a weakening DXY and positive risk sentiment. Secondly, the defense of the $80.65-$81.02 support zone is equally important. A failure to hold these levels, particularly a close below $80.65, would be a strong bearish signal, potentially leading to a rapid decline towards $79.86 and $78.20. This would likely be driven by a strengthening dollar or negative geopolitical news.
The market sentiment, as indicated by the PriceONN news snippets, seems to be leaning towards a potential breakout for gold above $4,900, which often bodes well for silver. However, the fact that silver experienced a tumble below $73 earlier in the week, despite geopolitical tensions, highlights its sensitivity to broader market movements and dollar strength. Therefore, vigilance is key. Traders should pay close attention to the upcoming economic calendar, especially any data that could influence Federal Reserve policy expectations. The interplay between inflation figures, employment numbers, and the Fed's forward guidance will be the ultimate arbiter of silver's direction.
My primary focus will be on the $81.85 resistance level. A clear break above this with confirming volume could signal the start of the bullish scenario. Conversely, a failure to hold support around $80.65 would be a strong bearish signal. I'll also be watching the DXY's reaction to any new economic data, as a sustained move above 98.00 could put significant pressure on XAGUSD.
Frequently Asked Questions: XAGUSD Analysis
What happens if XAGUSD breaks above the $81.85 resistance level this week?
A sustained break above $81.85, confirmed by strong volume, would validate the bullish scenario. The immediate target would be $82.23, with a secondary target at $83.22, suggesting continued upward momentum.
Should I buy XAGUSD at current levels around $81.00 given the mixed signals?
Buying at $81.00 carries risk due to mixed signals across timeframes and potential overbought conditions on the daily chart. A more prudent approach might be to wait for confirmation: either a break above $81.85 or a retest of support near $80.65 with bullish divergence.
Is the RSI at 58.61 on the daily chart a buy signal for XAGUSD?
An RSI of 58.61 on the daily chart indicates a leaning towards bullish momentum but is not yet in overbought territory. While supportive of an upward trend, it needs to be considered alongside other indicators like Stochastic, which shows overbought conditions, suggesting caution.
How will upcoming inflation data affect XAGUSD this week?
Softer-than-expected inflation data would likely weaken the US Dollar (DXY), providing a bullish catalyst for XAGUSD. Conversely, higher-than-expected inflation could strengthen the dollar and pressure silver prices downwards.
| Indicator | Value | Signal | Interpretation |
|---|---|---|---|
| RSI (14) | 58.61 | Neutral | Leaning bullish, but watch for overbought conditions |
| MACD Histogram | Positive | Bullish | Momentum supports upward move |
| Stochastic | K=81.31, D=82.11 | Bearish | Daily chart shows overbought, potential reversal |
| ADX | 22.43 | Weak Trend | Daily trend lacks strong conviction |
| Bollinger Bands | Middle Band | Above | Price trading above mean, bullish bias |
The Bull's Ascent: Targeting Higher Ground
45% ProbabilityThe Bears' Defense: A Retreat to Lower Ground
40% ProbabilityThe Waiting Game: Range-Bound Indecision
15% ProbabilityTrack markets in real-time
AI-powered analysis, technical indicators and real-time price data.
Join Our Telegram Channel
Breaking market news, AI analysis and trading signals instantly.
Join Channel