

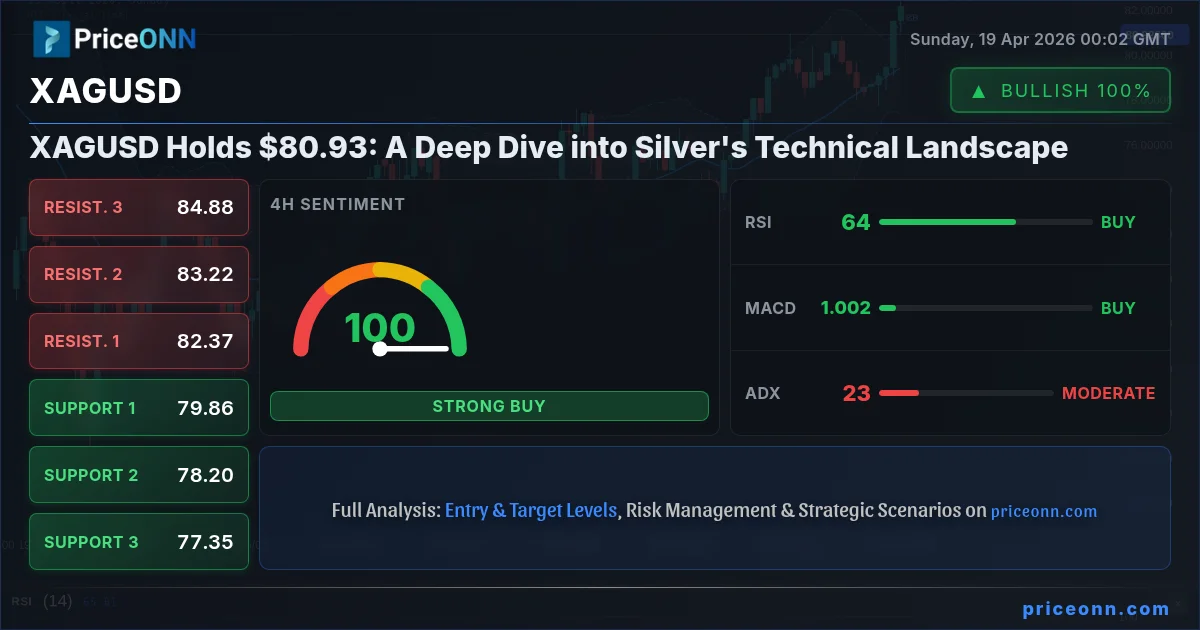
The silver market, represented by XAGUSD, has found itself navigating a critical juncture, currently holding its ground at the $80.93 mark. This past week has been a period of consolidation and mixed signals across various timeframes, making it imperative for traders and investors to dissect the technical tapestry woven by its price action, indicator readings, and key support and resistance zones. As we step into the new trading week, the question on many minds is whether the current levels will serve as a springboard for renewed upside or a pivot point for a bearish correction. Understanding the interplay between these technical elements is paramount for formulating a sound trading strategy.
- XAGUSD is currently trading at $80.93, holding a critical psychological level.
- The 1-hour chart shows a neutral trend with ADX at 27.32, indicating a potentially strong move is brewing.
- On the 4-hour chart, RSI stands at 63.55, suggesting bullish momentum, while Stochastic shows a buy signal.
- The daily chart presents a mixed picture with ADX at 22.43, but a strong overall buy signal across multiple timeframes suggests underlying strength.
- Key resistance is identified at $82.45, while crucial support lies at $80.65.
The precious metals market, particularly silver, often acts as a barometer for broader economic sentiment and inflationary pressures. As Alexei Sokolov, I've witnessed firsthand how geopolitical shifts and central bank policies can dramatically influence gold and silver prices. While gold has shown resilience, silver's recent performance, even with its inherent volatility, presents a compelling case for detailed technical scrutiny. The $80.93 level is not just a number; it's a battleground where bulls and bears are currently locked in a struggle for control. The outcome of this struggle will likely dictate the short-to-medium term trajectory of the white metal.
Zooming into the immediate 1-hour timeframe, the trend is currently neutral, with the Average Directional Index (ADX) sitting at 27.32. This reading suggests a developing trend rather than a fully established one, meaning we could be on the cusp of a significant price movement. The Relative Strength Index (RSI) at 52.99 hovers in neutral territory, showing a slight upward inclination, hinting that buyers are not yet exhausted. However, the Stochastic Oscillator, with %K at 64.29 and %D at 79.48, is flashing a bearish signal as %K has crossed below %D, suggesting potential for a short-term pullback. This divergence between indicators warrants caution, indicating that the immediate path might involve some choppiness before a clear direction emerges. The general signal across this timeframe leans towards 'BUY' (6 Buy, 2 Sell), but the Stochastic reading adds a layer of complexity that cannot be ignored.
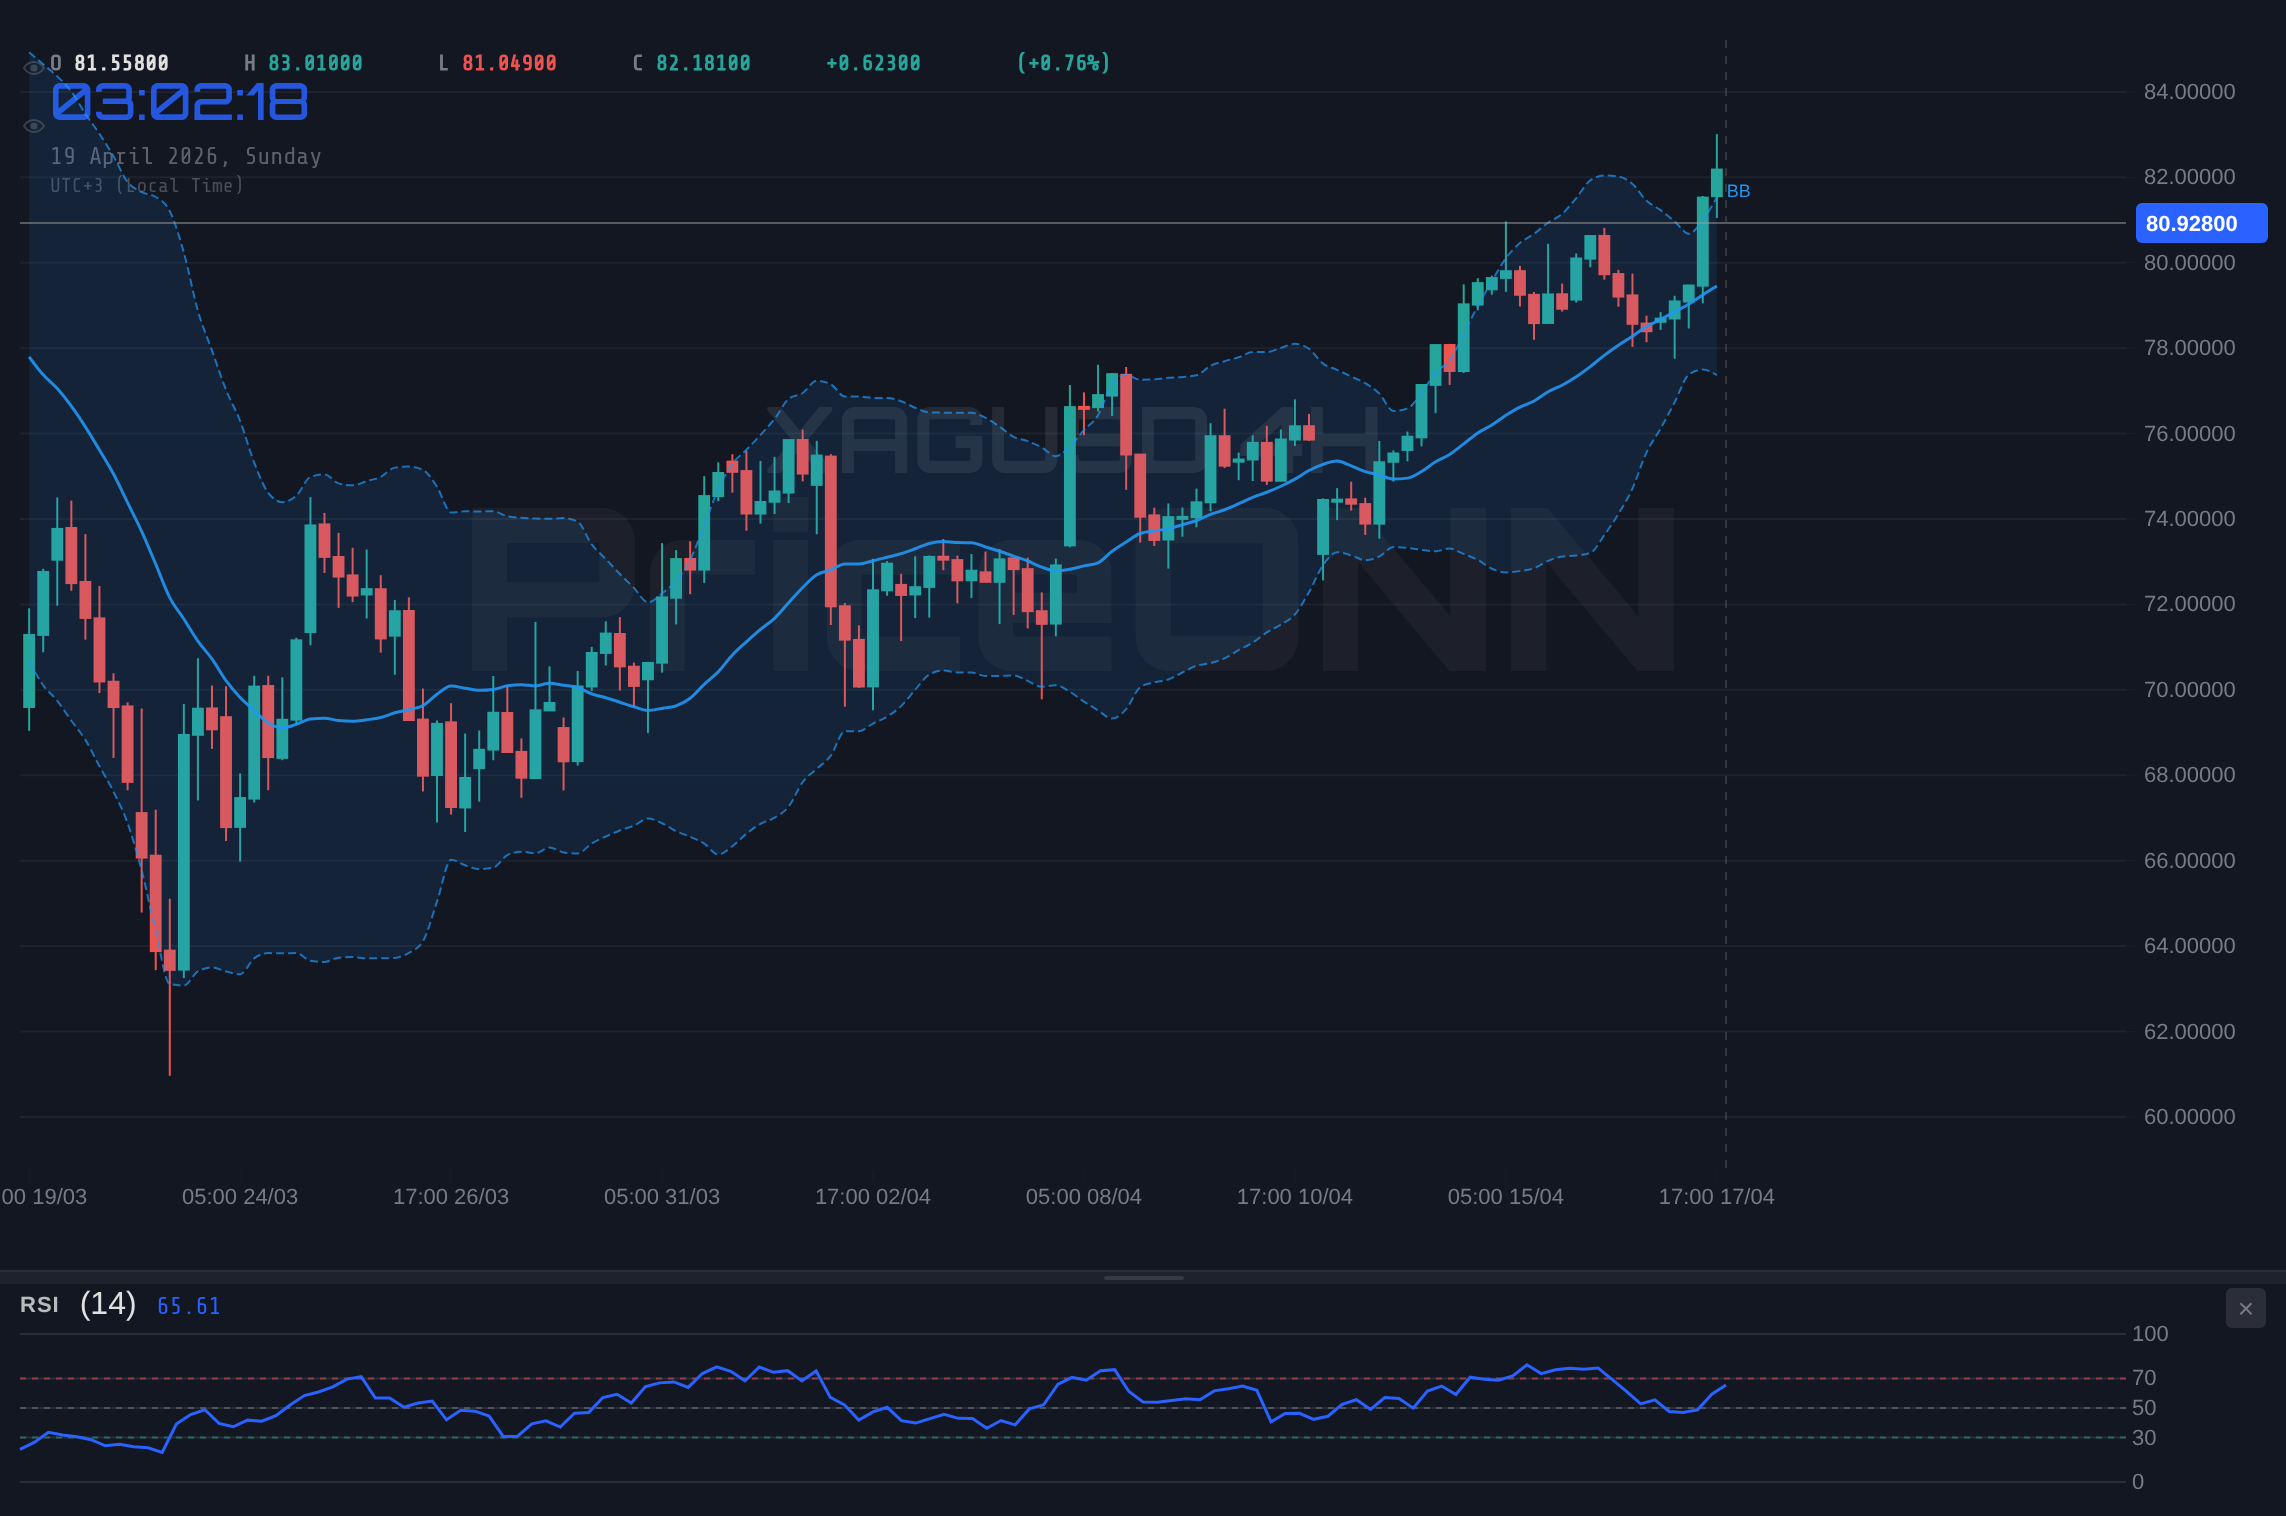
Shifting our focus to the 4-hour chart, the picture brightens considerably for the bulls. Here, the trend is firmly established as 'Uptrend' with an impressive strength of 95%. The RSI at 63.55 is comfortably in the neutral zone, reinforcing the bullish sentiment, and the MACD is showing positive momentum with its signal line. The Stochastic Oscillator (%K=64.12, %D=44.23) confirms the bullish bias, with %K comfortably above %D. The ADX at 20.46 indicates a moderately strong uptrend. This confluence of bullish signals across the 4-hour timeframe suggests that the underlying sentiment is positive, and any short-term pullbacks seen on the 1-hour chart could be viewed as opportunities to enter a rising market. The overall signal for this timeframe is a strong 'BUY' (7 Buy, 1 Sell).
The Daily Chart's Verdict: A Cautious Optimism
On the daily chart, the trend appears neutral, with a strength of 50%, reflecting the broader market's indecision. The RSI is at 53.85, still in neutral territory but showing a slight upward bias. The MACD is positive, indicating bullish momentum, and the Bollinger Bands suggest an upward trend. However, the Stochastic Oscillator (%K=74.9, %D=77.88) presents a bearish divergence, as %K has crossed below %D and is nearing overbought conditions. This is a crucial point; while the longer-term trend might be building, the daily indicators are flashing a warning sign for immediate upside. The ADX at 22.43 suggests a moderately strong trend, but its directionality can be swayed by shorter-term fluctuations. The overall signal here remains a 'BUY' (6 Buy, 2 Sell), but the Stochastic divergence on this timeframe demands respect and suggests that a period of consolidation or a minor pullback might precede any significant upward move.
The juxtaposition of these different timeframes paints a nuanced picture. While the 4-hour chart screams bullish conviction, the 1-hour and daily charts introduce elements of caution. This is typical in markets that are consolidating after a significant move or awaiting fresh catalysts. For a seasoned analyst like myself, this divergence is not a cause for alarm but an invitation to observe price action more closely around key levels. The support levels on the 1-hour chart are clustered around $4841.39 to $4853.47, while the resistance is seen between $4865.55 and $4877.63. On the daily chart, the critical support is at $4763, with resistance looming at $4893.08. These levels are the battle lines that will determine the short-term fate of silver.
Navigating the $80.93 Pivot: What the Data Suggests
The current price of $80.93 for XAGUSD is more than just a trading level; it represents a psychological pivot. Looking at the provided market data, the 1-hour chart's immediate support is found at $4853.47, followed by $4848.68 and $4841.39. Resistance is marked at $4865.55, $4872.84, and $4877.63. The 4-hour chart, however, suggests stronger underlying support at $4803.12 and $4759.83, with significant resistance overhead at $4868.67 and $4890.93. The daily timeframe confirms this broader range, with support at $4763 and a more distant resistance target at $4893.08. The fact that XAGUSD is currently trading at $80.93 means it is just below the immediate 1-hour resistance but well above the more significant 4-hour and daily support levels. This positioning suggests that the bulls have some breathing room, but breaking through near-term resistance is crucial for sustained upward momentum.
The RSI readings across the timeframes are particularly interesting. On the 1H, it's 52.99, leaning neutral-positive. On the 4H, it's 63.55, indicating a healthy bullish sentiment without being excessively overbought. The daily RSI at 58.75 also leans positive. This consistency in RSI suggests that, despite short-term stochastic divergences, the underlying momentum is not yet overheated. However, the Stochastic Oscillator's behavior is a cautionary tale. The bearish cross on the 1H and the overbought conditions on the 1D chart (K=74.9, D=77.88) cannot be ignored. This implies that sellers might step in if prices push higher too quickly, leading to profit-taking or a temporary reversal. Traders should be watching for confirmation of bullish continuation or signs of weakness around the $4865-$4877 resistance zone.
The ADX Indicator: Trend Strength Under the Microscope
The ADX, or Average Directional Index, provides a measure of trend strength, irrespective of its direction. On the 1-hour chart, the ADX stands at 27.32, suggesting a strong trend is developing. This aligns with the 'BUY' signal on this timeframe. The 4-hour chart shows an ADX of 20.46, indicating a moderately strong uptrend, which complements the bullish signals from RSI and Stochastic. However, the daily ADX at 22.43 suggests a moderate trend strength, but when viewed alongside the daily Stochastic divergence, it adds to the narrative of a market that is still finding its footing. A reading above 25 generally signifies a strong trend, so while the 1H and 4H are showing promising trend strength, the daily picture suggests that the trend is not yet fully solidified. This means that while opportunities exist, they might require tighter risk management and precise entry points.
The overall 'BUY' signals across all three timeframes (1H: 6 Buy, 2 Sell; 4H: 7 Buy, 1 Sell; 1D: 6 Buy, 2 Sell) are encouraging for the bulls. Despite the mixed signals from the Stochastic oscillator on the 1H and 1D charts, the preponderance of buy signals indicates that the market participants are leaning towards a bullish outlook. This is further supported by the fact that XAGUSD is trading above significant support levels identified on the 4-hour and daily charts. The key will be its ability to overcome the immediate resistance on the 1-hour chart. A decisive break and hold above the $4865.55 to $4877.63 range could trigger a cascade of buying, pushing prices towards the higher daily resistance targets.
Considering the Macroeconomic Backdrop
While this analysis focuses heavily on the technicals, it's crucial to remember the fundamental forces at play. Silver, often dubbed 'poor man's gold,' is highly sensitive to interest rate expectations, inflation data, and the strength of the US Dollar (DXY). Currently, the DXY is showing a slight downtrend, trading around 97.9. A weaker dollar typically supports silver prices, as it becomes cheaper for holders of other currencies. The provided economic calendar shows mixed signals. For instance, the recent USD retail sales data came in at 207 against a forecast of 213, suggesting a potential slowdown in consumer spending, which could lead to a less hawkish stance from the Federal Reserve. Conversely, the GBP data showed retail sales at 0.5, exceeding expectations. These conflicting data points contribute to the market's current indecision and the neutral trends observed on some timeframes.
The ongoing geopolitical tensions, particularly concerning the Strait of Hormuz, also play a role. While the immediate impact on oil prices has been volatile, such events often increase demand for safe-haven assets like gold and, by extension, silver. If these tensions escalate, we could see a surge in safe-haven demand that overrides the mixed technical signals. However, it's important to note that the provided news snippets do not directly link these geopolitical events to silver's current price action, suggesting that technical factors are the primary drivers at this moment. Nevertheless, keeping an eye on global risk sentiment and any further developments in the Middle East is prudent.
Trading Scenarios for XAGUSD
Given the current technical setup, with mixed signals on shorter timeframes and a generally bullish undertone on the 4-hour chart, we can outline three plausible scenarios for XAGUSD:
Bearish Reversal: Sellers Seize Control Below $80.65
40% ProbabilityConsolidation Around $80.93: Sideways Action Persists
30% ProbabilityBullish Continuation: Breaking Resistance at $4877.63
30% ProbabilityThe probabilities assigned reflect the current technical confluence: the strong 4-hour bullish signals provide a foundation for upside, but the divergences on the 1-hour and daily Stochastic oscillators, coupled with the neutral daily trend, introduce significant risk for a bearish reversal or prolonged consolidation. A successful break above the immediate resistance zone is key for the bullish scenario to materialize. Conversely, a failure to hold the current $80.93 level could open the door for a deeper correction towards the $4800 handle.
The Role of Central Banks and Institutional Flows
As a long-term analyst, I always consider the influence of central bank policies and institutional flows. While the provided data doesn't explicitly detail recent central bank buying or ETF flows for silver, historical trends are informative. Central banks, particularly in emerging markets, have been significant net buyers of gold, and this often correlates with silver's underlying demand. If these institutions continue to accumulate precious metals as a hedge against inflation and geopolitical uncertainty, it provides a structural bid for silver that can absorb short-term technical weakness. Similarly, watching ETF flows can offer insights into institutional sentiment. An increase in silver ETF holdings typically signals growing investor confidence and can act as a tailwind for prices, whereas outflows might suggest a risk-off sentiment among larger market participants.
The relationship between real interest rates and silver prices is also critical. When real rates (nominal rates minus inflation) are low or negative, the opportunity cost of holding non-yielding assets like silver decreases, making it more attractive. Current inflation data, though mixed, has shown some signs of stickiness, which could keep real rates suppressed, providing a supportive backdrop for precious metals. Any shifts in central bank forward guidance regarding interest rate hikes or cuts will therefore be closely watched. For instance, if the Federal Reserve signals a more dovish stance due to concerns about economic growth, it could lower real yields and boost silver's appeal.
Final Thoughts: Patience and Precision in Silver Trading
The silver market at $80.93 presents a complex but potentially rewarding trading environment. The 4-hour chart offers a clear bullish signal, suggesting that the underlying trend is still upwards. However, the divergences and neutral signals on the shorter timeframes serve as a crucial reminder that markets rarely move in straight lines. The key levels identified - support at $4803.12 and resistance at $4893.08 - define the broader range, while the $4841.39-$4877.63 zone on the 1-hour chart represents the immediate battleground.
For traders, the strategy should revolve around risk management and waiting for clear confirmation. A break above the $4877.63 resistance, supported by increasing volume and positive daily indicators, could signal an entry for a long position targeting $4890.93 and potentially higher. Conversely, a decisive break below $4841.39, especially if accompanied by rising DXY or negative geopolitical news, might warrant a short position targeting the $4803 support. The neutral scenario, characterized by consolidation, offers opportunities for range-bound trading strategies, but requires careful execution and tight stop-losses. Ultimately, patience will be rewarded. The market is presenting a clear picture of the levels to watch; the discipline lies in waiting for the price action to confirm the desired setup.
| Indicator | Value | Signal | Interpretation |
|---|---|---|---|
| RSI (14) | 58.75 | Bullish | Neutral zone, upward bias |
| MACD Histogram | Positive | Bullish | Positive momentum |
| Stochastic (%K/%D) | 64.12 / 44.23 | Bullish | Buy signal on 4H |
| ADX | 20.46 | Trend Strong | Moderate uptrend on 4H |
| Bollinger Bands | Middle Band | Bullish | Price above middle band |
Frequently Asked Questions: XAGUSD Analysis
What happens if XAGUSD breaks below the $4803.12 support level?
A break below $4803.12 could trigger a bearish scenario, with potential targets at $4759.83 and $4737.57. This would likely be invalidated if price quickly recovers above $4841.39.
Should I buy XAGUSD at current levels of $80.93 given the mixed signals?
Caution is advised. While the 4-hour chart is bullish, daily Stochastic divergence suggests waiting for confirmation. A safer entry might be on a confirmed break above $4877.63 or a retest of $4803.12 support.
Is the RSI at 63.55 a buy signal for XAGUSD on the 4-hour chart?
An RSI of 63.55 on the 4-hour chart indicates bullish momentum but is not yet overbought. It supports the bullish trend but traders should look for confirmation from other indicators like Stochastic or MACD for a stronger entry signal.
How will the current DXY around 97.9 affect XAGUSD this week?
A weaker DXY generally supports silver prices. With the DXY around 97.9 and showing some downward pressure, it creates a favorable environment for XAGUSD to potentially test higher resistance levels, assuming other factors remain stable.
Track markets in real-time
AI-powered analysis, technical indicators and real-time price data.
Join Our Telegram Channel
Breaking market news, AI analysis and trading signals instantly.
Join Channel