

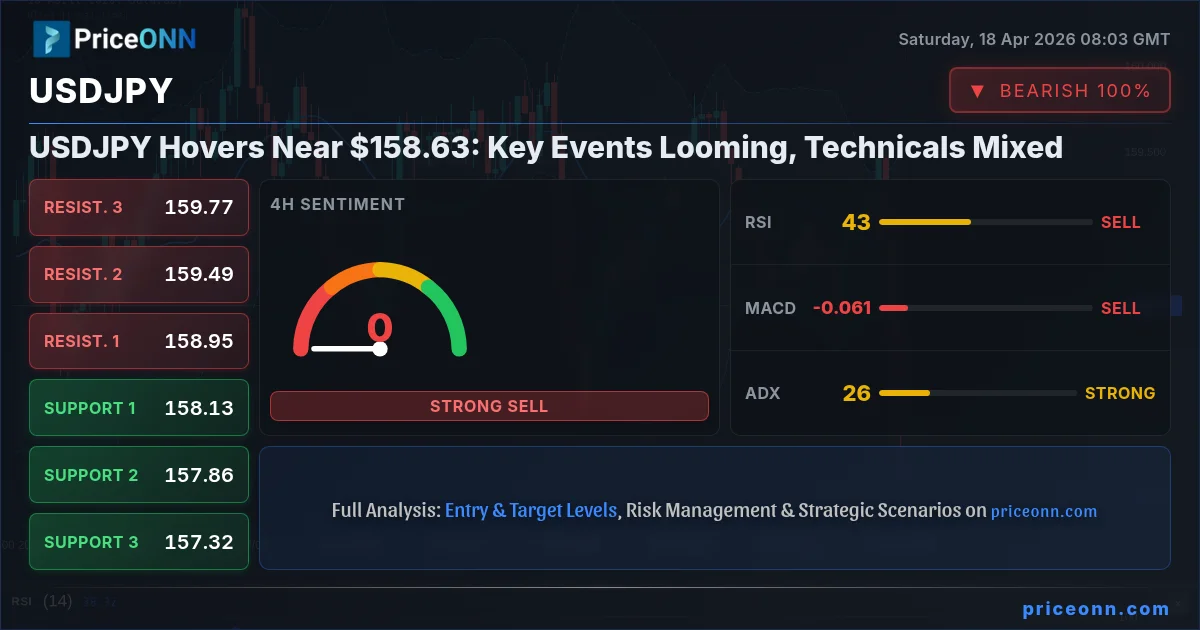
The USDJPY pair finds itself in a precarious position, consolidating around the critical $158.63 mark as the trading week draws to a close. This period of relative calm belies a market teetering on the edge, with a confluence of technical indicators flashing mixed signals and a looming calendar of economic events poised to inject significant volatility. Traders are left navigating a complex landscape, where the interplay between the Federal Reserve's monetary policy expectations, the Bank of Japan's stance, and broader geopolitical tensions continues to dictate the pair's trajectory. The current technical picture, characterized by indecision across multiple timeframes, suggests that the market is awaiting a catalyst to break the prevailing stalemate. Understanding the nuances of the current price action, the historical context of similar consolidations, and the potential impact of upcoming data releases is paramount for any serious market participant looking to position themselves effectively in the coming week.
- USDJPY is consolidating around $158.63, showing indecision across multiple timeframes.
- The 1-hour chart signals a potential buy with an ADX of 35.55, but the daily RSI at 48.98 indicates downward pressure.
- Key resistance is identified at $159.52, while critical support lies at $158.48.
- Mixed signals from indicators like RSI and Stochastic suggest traders should await clearer direction before significant commitments.
Navigating the Choppy Waters: USDJPY's Technical Landscape
The 1-Hour Perspective: A Tentative Uptick Amidst Weak Trends
On the shorter, 1-hour timeframe, USDJPY presents a somewhat more constructive, albeit cautious, technical picture. The current price hovers near $158.63, with immediate support identified at $158.22 and further down at $158.01. Resistance looms at $158.55, $158.66, and $158.87. The Average Directional Index (ADX) reading of 35.55 here is particularly noteworthy. An ADX value above 25 generally indicates a strong trend, and while the directionality isn't explicitly defined by the ADX alone, its robustness suggests that any move, once initiated, could carry significant momentum. However, the Relative Strength Index (RSI) at 46.66 is firmly in neutral territory, leaning slightly towards a bearish sentiment, indicating that while a trend might be building, the upward momentum isn't yet overwhelming. This is corroborated by the MACD, which is showing negative momentum, lurking below its signal line, hinting at potential selling pressure. The Stochastic oscillator, with its %K line at 50.2 and %D line at 27.5, crosses bullishly, suggesting a potential upward move is brewing, but the divergence between its upward signal and the MACD's bearish leanings highlights the current indecision. This short-term outlook suggests a market that is hesitant, potentially coiling for a move but lacking the conviction to commit fully. Traders operating on this timeframe might be looking for a clear break above the immediate resistance at $158.55, with confirmation from rising volume and a positive shift in MACD momentum, to consider a short-term long position targeting higher levels. Conversely, a failure to sustain this upward push and a slip below $158.22 could signal a continuation of the intraday weakness.
The Bollinger Bands on the 1-hour chart are currently positioned around the middle band, showing a slight downward inclination. This suggests that the price action is not yet strongly trending and might be experiencing sideways movement, or perhaps a gentle pullback within a broader, yet undefined, trend. The width of the bands is moderate, not indicating extreme volatility but also not suggesting a period of prolonged consolidation. The Stochastic oscillator’s crossover is a signal of potential buying interest emerging from oversold conditions, but the fact that it's not yet in extreme territory (below 20) means this signal is not a buy-the-dip confirmation. It’s more of an early warning that buyers might be stepping in. The overall 'General Signal' for the 1-hour timeframe is 'SAT' (Sell), with 6 sell signals, 2 buy signals, and 0 neutral. This broad consensus leans towards caution for the bulls on this particular timeframe, despite the Stochastic crossover. It’s a classic case of conflicting indicators where the shorter-term signals are not yet aligned for a strong directional bet. This environment often favors range-bound trading strategies or waiting for a more definitive breakout pattern to emerge.
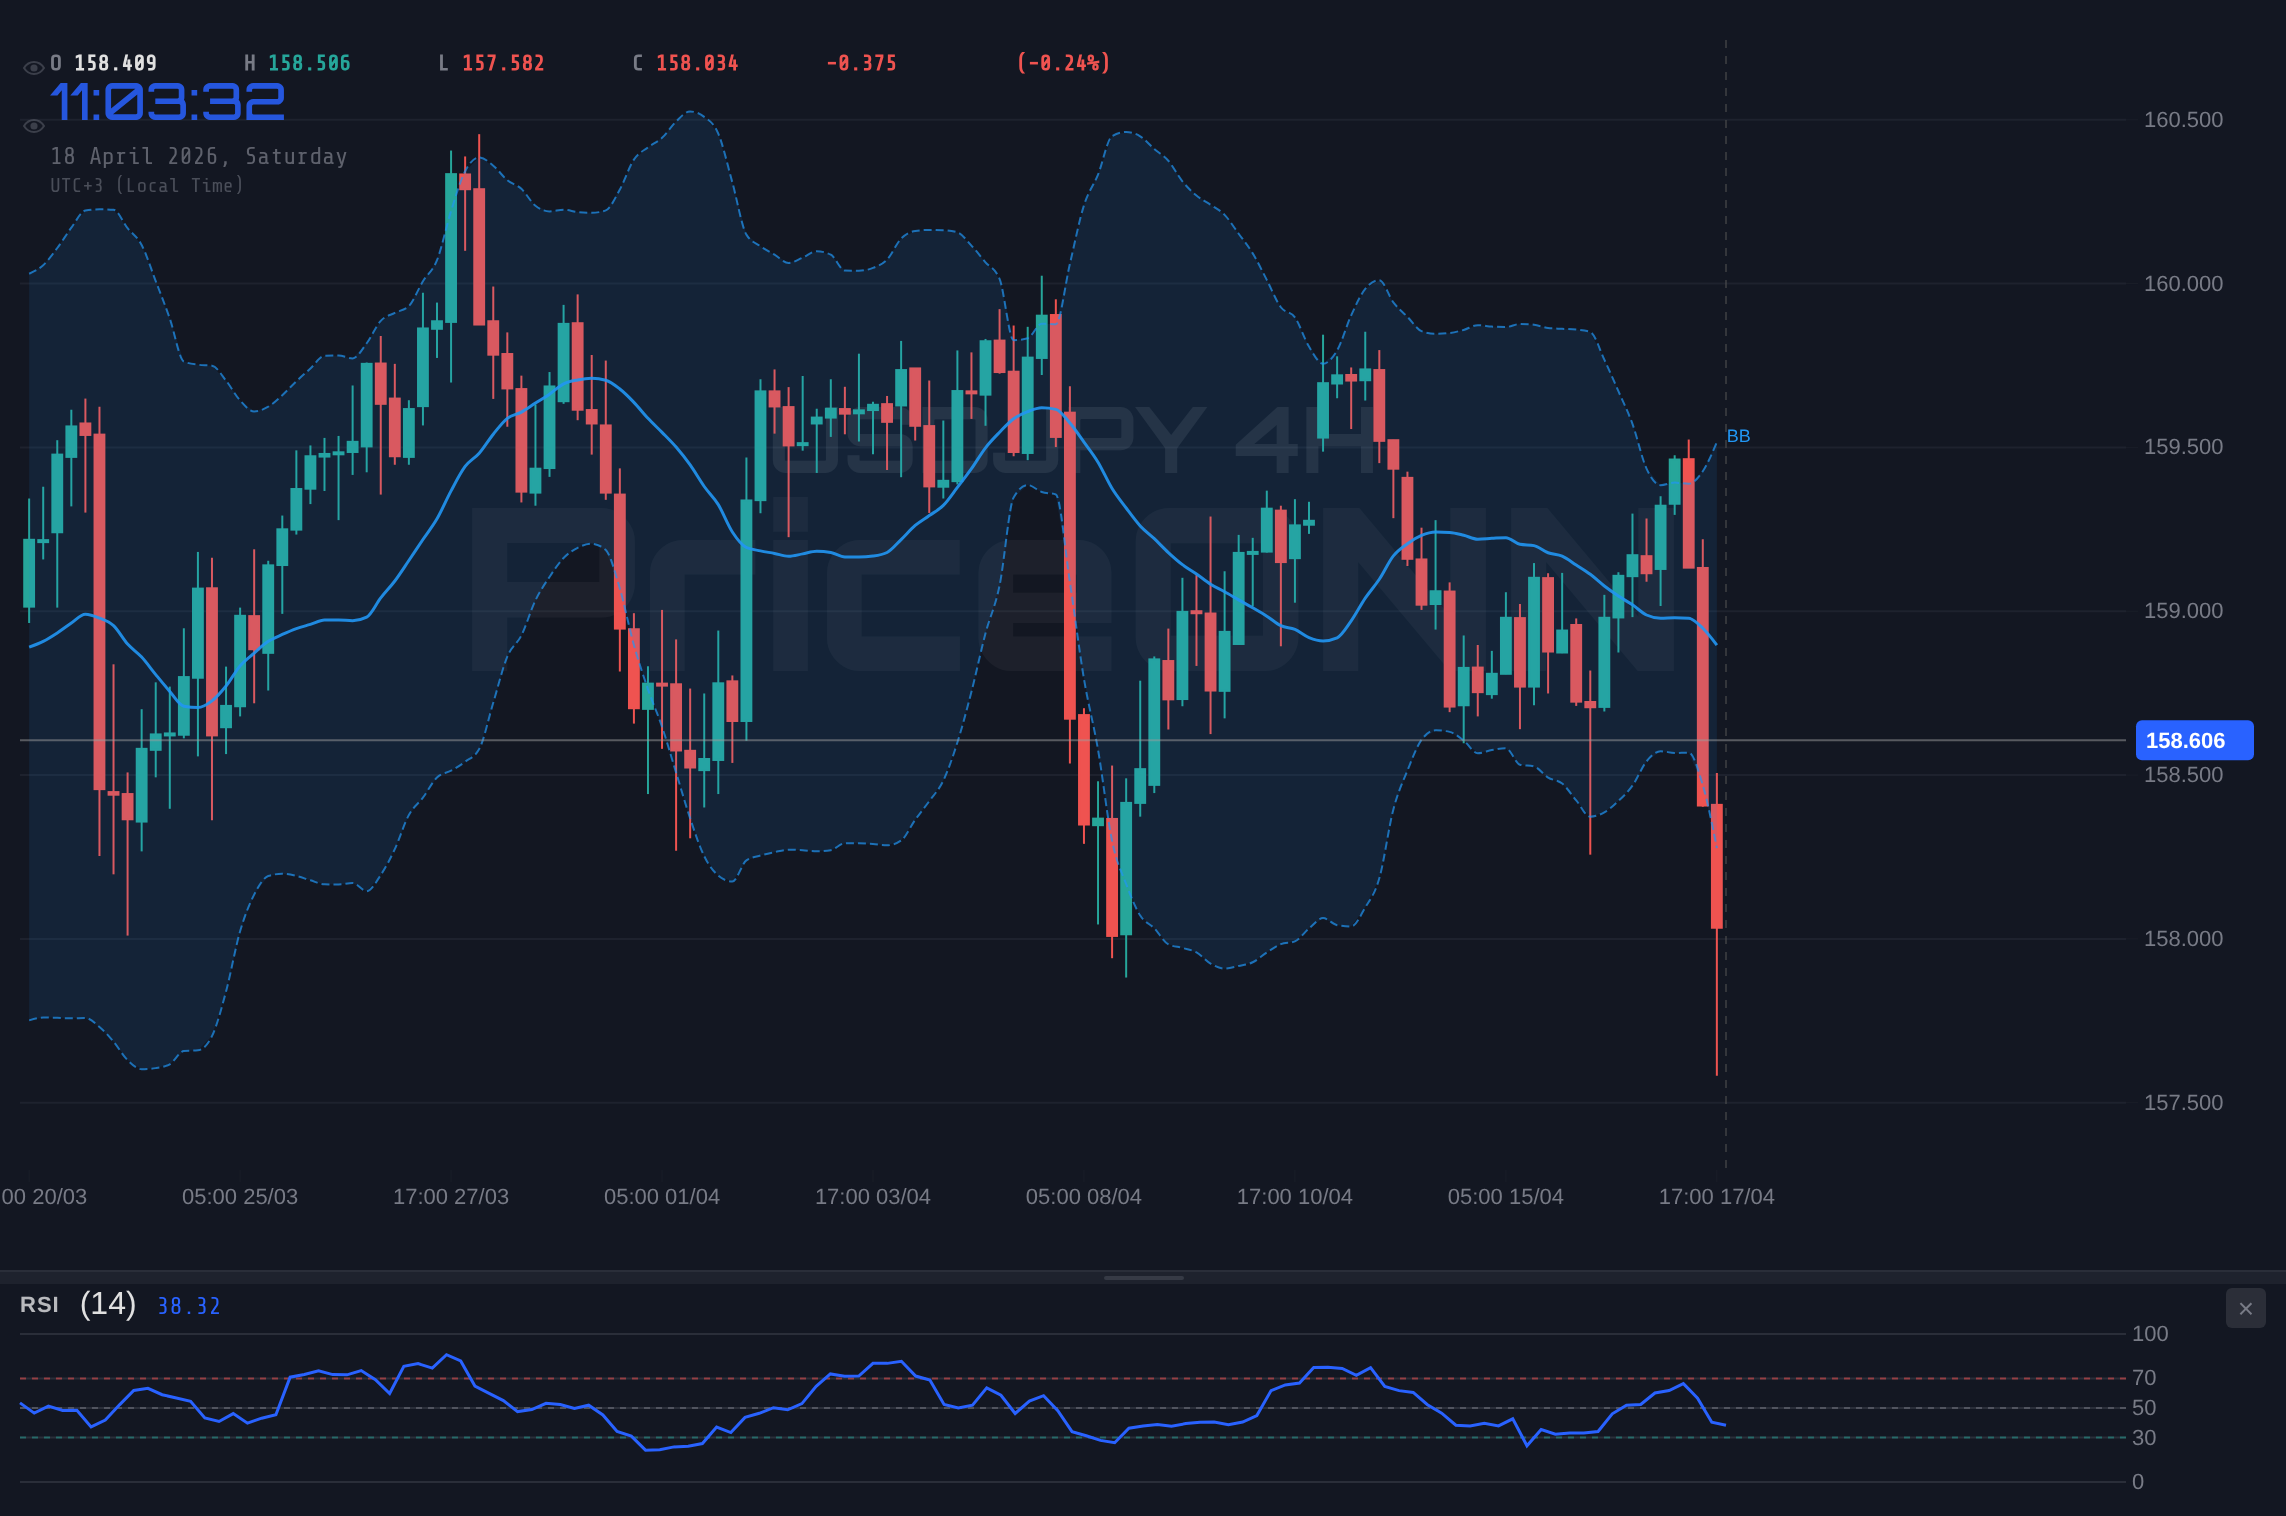
The 4-Hour Chart: A Stronger Trend, But Conflicting Signals Persist
Stepping back to the 4-hour timeframe, the picture becomes somewhat clearer, yet paradoxically, more complex. Here, the ADX climbs to 25.69, reinforcing the idea of a discernible trend being in play, though not necessarily a strong one yet. The support levels are more pronounced, situated at $158.13, $157.86, and $157.31. Resistance is firmly established above the current price, with key levels at $158.95, $159.49, and $159.77. The RSI stands at 42.75, indicating a bearish bias on this timeframe, suggesting that sellers are gaining a slight upper hand. This aligns with the MACD, which continues to display negative momentum, with the MACD line firmly below its signal line. This suggests that the recent price action, despite any intraday rallies, is still under pressure from sellers. The Bollinger Bands are showing a similar pattern to the 1-hour chart, with the price trading below the middle band, reinforcing the bearish sentiment. However, the Stochastic oscillator offers a stark contrast. With %K at 44.9 and %D at 77.36, it's showing a bullish signal, as %K has crossed above %D. This is a significant divergence from the MACD and RSI readings. It suggests that while the underlying momentum (MACD) and overbought/oversold conditions (RSI) are leaning bearish, the faster-moving Stochastic is picking up on buying pressure, possibly from short-term traders or a reaction to the lower support levels. The overall 'General Signal' here is 'SAT' (Sell), with a clean sweep of 8 sell signals and 0 buy signals. This strongly suggests that the dominant short-to-medium term sentiment on the 4-hour chart is bearish, despite the conflicting Stochastic signal. This conflicting information is precisely what creates trading opportunities for those who can interpret it correctly – it signals a battleground where a decisive move is likely to occur soon.
The presence of a strong ADX at 25.69 on the 4-hour chart, despite the bearish leanings of RSI and MACD, implies that a trend is developing, or at least attempting to develop. The fact that the Stochastic is showing a bullish crossover, even as the price remains below the middle Bollinger Band, could indicate a potential for a bounce towards the middle band around $158.95. However, the overwhelming sell signals from other indicators suggest that this bounce might be short-lived and could offer a better risk-reward ratio for short sellers if the price fails to break higher. The historical context of USDJPY often shows periods of sharp moves followed by consolidations, and this current setup could be indicative of the latter. Traders might be waiting for a clear break above $158.95 to confirm a bullish reversal, or a decisive drop below $158.13 to confirm the bearish trend continuation. The current environment is one of anticipation, where the market is gathering energy for its next significant move, and the conflicting signals are a testament to this transitional phase.
The Daily Chart: A Neutral Stance with Underlying Bearish Undertones
On the daily chart, the USDJPY pair exhibits a neutral trend with a potential for bearish undertones. The price is currently trading around $158.63, with significant support levels identified at $158.48, $157.85, and $157.44. Resistance is found at $159.52, $159.93, and $160.57. The RSI stands at 48.98, hovering just below the 50-level, which typically signifies a bearish bias on a daily scale. This suggests that while the pair isn't in deeply oversold or overbought territory, the sentiment leans slightly negative. The MACD indicator continues to paint a bearish picture, with negative momentum and the MACD line consistently below its signal line. This reinforces the idea that the dominant trend, when viewed over longer periods, is still favoring the downside, or at least exhibiting a lack of sustained bullish conviction. The Bollinger Bands are positioned around the middle band, indicating a period of consolidation or a pause in a larger trend. The price is currently testing the upper boundary of this consolidation range. The Stochastic oscillator presents a confusing signal here as well: %K is at 49.92 and %D is at 52.65. This proximity indicates a neutral stance, but the slight downward bias (%K
Historically, periods of consolidation around such key psychological levels in USDJPY have often preceded significant moves, driven by shifts in central bank policy expectations or major geopolitical events. The current neutral stance on the daily chart, combined with the bearish undertones from the RSI and MACD, creates a 'wait-and-see' environment. For long-term investors, this might be a period to observe price action around the key support at $158.48 and resistance at $159.52. A decisive break and hold above $159.52 could signal a new bullish phase, targeting higher levels. Conversely, a failure to hold $158.48 could initiate a sharper decline, potentially testing the $157.85 support. The lack of a strong trend on the daily chart means that short-term fluctuations could be exaggerated, making it crucial for traders to manage risk effectively and wait for confirmation before entering positions. The current price action suggests that the market is digesting recent information and waiting for the next major driver, which could be upcoming economic data from either side of the Pacific or shifts in global risk sentiment.
Macroeconomic Currents: The Fed, BoJ, and Inflationary Pressures
The persistent tug-of-war in USDJPY is intrinsically linked to the diverging monetary policy paths and inflation outlooks of the United States and Japan. In the US, the Federal Reserve remains cautiously hawkish, grappling with sticky inflation that refuses to retreat to its 2% target. Recent economic data, including the latest retail sales figures showing a significant upswing largely driven by a 26% surge in gasoline prices, indicates that consumer spending remains resilient, albeit influenced by rising costs. This resilience, while positive for economic growth, complicates the Fed's task of taming inflation without triggering a recession. Market participants are closely scrutinizing every piece of data for clues about the Fed's next move. While rate cuts were once anticipated early in the year, the persistent inflationary pressures and robust employment figures have pushed back these expectations. The market is now pricing in a higher probability of fewer rate cuts, or even a potential for a hike if inflation continues to surprise to the upside, a scenario that would typically support the US Dollar. The CME FedWatch tool, if updated with current probabilities, would likely reflect this shift in sentiment, showing a reduced likelihood of imminent rate cuts and a greater emphasis on maintaining restrictive policy for longer. This underlying strength in the dollar, fueled by higher-for-longer interest rate expectations, provides a fundamental tailwind for USDJPY, even amidst periods of technical consolidation.
On the other side of the Pacific, the Bank of Japan (BoJ) faces a different set of challenges. While inflation in Japan has shown signs of picking up, moving towards the BoJ's 2% target, it remains less entrenched than in the US. The recent jump in gasoline prices, while a global phenomenon, adds to inflationary pressures in Japan, potentially nudging the BoJ closer to further policy normalization. However, the Japanese economy is still navigating delicate recovery phases, and the BoJ has historically been cautious about tightening policy prematurely, fearing it could stifle growth. The market continues to watch for any hints from BoJ officials regarding the future path of monetary policy, particularly concerning negative interest rates and yield curve control. Any indication of a more aggressive stance on normalization could lead to a strengthening of the Japanese Yen, exerting downward pressure on USDJPY. The delicate balance between the Fed's resolve to fight inflation and the BoJ's cautious approach creates a complex dynamic. If US interest rates remain elevated while Japanese rates stay low, the interest rate differential would continue to favor the dollar, supporting USDJPY. However, any significant shift in the BoJ's policy, or a notable slowdown in US inflation, could alter this dynamic significantly. The interplay of these forces is crucial for understanding the medium-term outlook for the pair.
The recent surge in crude oil prices, exacerbated by geopolitical tensions such as the reopening of the Strait of Hormuz amidst a fragile ceasefire, adds another layer of complexity. Higher oil prices have a dual impact: they contribute to inflationary pressures globally, potentially reinforcing the Fed's hawkish stance, while also impacting commodity-exporting nations differently. For the US, higher energy costs can contribute to inflation but also boost domestic energy production. For Japan, a net energy importer, rising oil prices directly translate into higher import costs and increased inflationary pressure, potentially forcing the BoJ's hand. The 'Can US Consumers Withstand $80+ Oil as Gasoline Prices Surge 26%?' narrative is critical here. If US consumers show resilience, it supports the 'higher-for-longer' Fed narrative. Conversely, if the price shock proves too much, it could dampen demand and inflation expectations. Similarly, the question of 'Will US Retail Sales Signal Consumer Resilience Amidst Rising Gas Prices?' due to be released soon, will be a key data point. Strong sales would bolster the dollar, while weak sales could signal consumer strain and potentially lead to a Fed pivot. This complex web of inflation, interest rates, and energy prices creates a volatile environment for USDJPY, where fundamental drivers can shift rapidly.
Geopolitical Ripples and Risk Sentiment
Beyond the direct monetary policy divergences, geopolitical developments continue to cast a long shadow over currency markets, and USDJPY is no exception. The reopening of the Strait of Hormuz, announced by Iran amidst a fragile ceasefire, initially triggered a significant drop in crude oil prices. This event, reported by sources like CNBC and Reuters, initially suggested a de-escalation of tensions, which typically benefits riskier assets and weakens safe-haven currencies like the Japanese Yen. However, the market's reaction was complex. While oil prices initially plunged, the underlying geopolitical risks remain, and the 'fragile ceasefire' aspect implies that stability is far from guaranteed. The question 'Is Gold Poised for Further Gains as Strait of Hormuz Reopens Amidst Fragile Ceasefire?' highlights this duality – gold, a traditional safe-haven, saw a surge, indicating that underlying risk aversion persists despite the news. This suggests that while the immediate threat might have receded, the broader geopolitical landscape remains tense, influencing overall market sentiment.
The USDJPY pair often acts as a barometer for global risk sentiment. During periods of heightened uncertainty or 'risk-off' sentiment, investors tend to seek refuge in perceived safe havens. While the US Dollar is often considered a safe haven, the Japanese Yen has also historically played this role, particularly when global volatility increases. This is because Japan is a major creditor nation, and a repatriation of funds during times of global stress can strengthen the Yen. Conversely, during 'risk-on' periods, when investors are more willing to take on risk, capital tends to flow into higher-yielding assets and currencies associated with economic growth, often benefiting the US Dollar against the Yen. The correlation analysis becomes crucial here. A rising DXY (Dollar Index), currently trading around 97.9, typically puts pressure on USDJPY, as a stronger dollar generally means a stronger USD against most currencies, including the Yen. However, the relationship is not always linear. If the dollar's strength is driven by safe-haven demand rather than strong economic fundamentals, it can sometimes move in tandem with the Yen during extreme risk-off events. Conversely, if the dollar strengthens due to expectations of higher US interest rates, it usually leads to a weaker Yen. The current situation, with mixed signals from the DXY (down slightly today but showing strength on 4H), suggests that the dollar's direction is not yet firmly established. The performance of major equity indices like the S&P 500 (currently around 6572.87, showing a strong upward move) and Nasdaq 100 (around 26682.75, also strong) indicates a degree of risk appetite in the market, which would typically favor USDJPY. However, any sudden shift in geopolitical news or economic data could quickly alter this sentiment, leading to a flight to safety that could pressure USDJPY lower.
The ongoing discussions about trade relations, particularly between the US and China, also play a role. While not directly impacting USDJPY as much as, say, AUDUSD, lingering trade tensions can contribute to global economic uncertainty, indirectly affecting risk sentiment and thus the Yen's safe-haven appeal. The fact that the price is consolidating around $158.63 suggests that these macro and geopolitical factors are currently in a delicate balance, with neither the bulls nor the bears able to establish decisive control. The market is essentially waiting for a clearer signal from either economic data, central bank commentary, or a significant geopolitical event to break this stalemate. The question 'Will USDJPY Break 160 as Hormuz Tensions Escalate and BoJ Policy Looms?' from recent headlines, although slightly dated given the oil price reaction, perfectly encapsulates the market's underlying concerns about these intertwined factors. The potential for the BoJ to adjust its policy, coupled with the ever-present geopolitical risks, creates a backdrop where the Yen could strengthen unexpectedly, even if the dollar retains a fundamental advantage due to interest rate differentials.
Trading Scenarios: Mapping Potential Moves
Bearish Scenario: Testing the Lower Bounds
60% ProbabilityNeutral Scenario: Consolidation Around $158.63
25% ProbabilityBullish Scenario: Reclaiming Higher Ground
15% ProbabilityHistorical Context and Trader Perspectives
Understanding USDJPY's behavior requires looking beyond the immediate charts and considering its historical performance during periods of similar market conditions. Periods of consolidation around key psychological levels, such as the current $158-$160 range, are not uncommon for USDJPY. Historically, these consolidations often precede significant shifts, driven by major policy changes from either the Federal Reserve or the Bank of Japan, or by substantial geopolitical events. For instance, during periods of heightened global risk aversion in the past, the Yen has often strengthened as investors sought safe-haven assets, pushing USDJPY lower. Conversely, when the US has pursued aggressive monetary tightening, the interest rate differential has widened, leading to significant Yen weakness and pushing USDJPY higher. The current situation, with the Fed signaling a 'higher-for-longer' interest rate environment and the BoJ potentially on the cusp of policy normalization, presents a unique dichotomy. This historical context suggests that the current indecision might be a prelude to a more significant move, the direction of which will depend heavily on which central bank's policy stance ultimately dominates market sentiment.
For scalpers, the current environment around $158.63 presents opportunities in the short-term fluctuations. They might look to fade moves towards the immediate 1-hour resistance at $158.66, expecting a return to the $158.22 support, or conversely, buy dips near $158.22 if they see signs of buyer capitulation. The key is tight risk management and small position sizing, as the lack of clear trend on the 1-hour chart means quick reversals are possible. The ADX of 35.55 on the 1H chart, while indicating a trend, needs to be watched carefully; if it starts to fall rapidly, it signals the trend is weakening, making scalping riskier.
Swing traders, operating on the 4-hour and daily charts, would likely adopt a more patient approach. The mixed signals between the 4H MACD/RSI (bearish) and Stochastic (bullish) present a challenge. A swing trader might wait for a clearer signal, such as a break above $158.95 with conviction, confirmed by daily chart indicators turning bullish, to enter a long position targeting $159.52 or higher. Alternatively, they might wait for a breakdown below the $158.13 support, confirmed by a bearish close on the daily chart, to initiate a short position targeting $157.31. The neutral ADX on the daily chart (16.92) suggests that a strong directional trend hasn't yet established itself on this timeframe, making aggressive directional bets risky. They would be closely watching the reaction around the $158.48-$159.52 range as a potential pivot point for the next significant move.
Long-term investors, however, would be more focused on the fundamental drivers and the potential for sustained policy divergence. They might view the current consolidation as an opportunity to accumulate positions if they believe the interest rate differential between the US and Japan will continue to widen in favor of the dollar. For them, the key levels to watch are not just the immediate support and resistance, but broader ranges that have held historically. A sustained move above $160.00, for example, could signal a new long-term bullish phase, while a sustained drop below $155.00 might indicate a fundamental shift. They would be less concerned with short-term fluctuations and more focused on the overarching macroeconomic narrative – the Fed's inflation fight versus the BoJ's gradual normalization path. The question 'is aud projected to get stronger than yen over the next week' from emerging queries highlights the broader currency sentiment, and while not directly USDJPY, it indicates that traders are looking at relative currency strength, a key factor for long-term positioning.
Correlation Analysis: The Dollar, Equities, and Oil's Influence
The performance of USDJPY is intricately linked to broader market dynamics, and analyzing its correlation with other major assets provides crucial context. The US Dollar Index (DXY), currently around 97.9, serves as a primary benchmark. When the DXY strengthens, it generally implies a stronger US dollar against a basket of major currencies, which often translates into upward pressure on USDJPY, assuming the Yen is weakening against the dollar. However, the relationship isn't always straightforward. As noted, during periods of extreme global stress, the Yen can act as a safe haven, strengthening even as the dollar does, leading to a decoupling. Currently, with the DXY showing mixed signals across timeframes (bullish on 1H, bearish on 4H and 1D), its influence on USDJPY is somewhat muted, contributing to the indecision. A clear directional move in the DXY, either breaking above key resistance or falling below support, would likely provide a more definitive directional cue for USDJPY.
Equity markets, particularly the S&P 500 (around 6572.87) and Nasdaq 100 (around 26682.75), act as indicators of global risk appetite. Both indices are currently showing strong upward momentum, suggesting a 'risk-on' environment. In such conditions, investors are typically more inclined to move away from safe-haven assets like the Yen and favor currencies associated with growth and higher yields, like the US Dollar. This positive correlation between equities and USDJPY generally supports a bullish outlook for the pair. However, this relationship can break down. If the equity rally is perceived as unsustainable or driven by factors other than fundamental economic strength, it might not translate into consistent dollar strength against the Yen. Any sign of a significant pullback in major equity indices could quickly shift sentiment, leading to a flight to safety that would benefit the Yen and pressure USDJPY lower.
Crude oil prices, currently around $92.54 for Brent and $86.42 for WTI, play a critical role through their influence on inflation expectations and geopolitical risk. The recent sharp decline in oil prices, following the reopening of the Strait of Hormuz, initially suggested a de-escalation of Middle East tensions. This could, in theory, reduce inflationary pressures, potentially leading to a less hawkish stance from the Federal Reserve, which might weaken the dollar. However, the market's reaction was complex, with gold prices surging, indicating persistent underlying risk aversion. The narrative around 'Can US Consumers Withstand $80+ Oil?' remains pertinent. If oil prices stabilize or begin to rise again due to persistent geopolitical risks or supply concerns, it could reignite inflation fears, reinforcing the Fed's hawkish stance and supporting USDJPY. Conversely, sustained lower oil prices could ease inflation concerns, potentially leading to earlier Fed rate cuts and weakening the dollar. The current price action in oil suggests that the market is still digesting the implications of the Hormuz news and the broader geopolitical situation, making its influence on USDJPY somewhat unpredictable in the short term.
The Treasury yield curve, particularly US 10-year yields, also acts as a key correlated asset. Higher yields generally attract capital to the US, strengthening the dollar and supporting USDJPY. Conversely, falling yields can signal economic concerns or expectations of monetary easing, potentially weakening the dollar. While specific yield data is not provided, the general expectation of 'higher-for-longer' US interest rates implies that yields are likely elevated, providing a fundamental underpinning for dollar strength against the Yen. Any significant shift in yield expectations, driven by inflation data or Fed communication, would directly impact USDJPY. The correlation between these major asset classes – DXY, equities, oil, and bonds – paints a complex picture. While a 'risk-on' environment driven by strong equities and potentially stabilizing oil prices would normally favor USDJPY, the mixed signals from the DXY and the underlying geopolitical uncertainties mean that the pair remains sensitive to shifts in sentiment and data releases.
Economic Calendar Watchlist: Key Data Points Ahead
The upcoming week's economic calendar is laden with events that could significantly influence the USDJPY pair's direction. For the US, the focus will remain squarely on inflation and employment data. While the latest retail sales figures showed resilience, the core Personal Consumption Expenditures (PCE) price index, the Fed's preferred inflation gauge, will be closely watched. A reading above expectations could reinforce the 'higher-for-longer' narrative for Fed rates, supporting the dollar. Conversely, a softer reading might increase speculation of earlier rate cuts, potentially weakening the dollar. The unemployment rate and Non-Farm Payrolls (NFP) data, if scheduled, will also be critical. Strong job growth would suggest economic resilience, but if wage growth remains high, it could add to inflation concerns. The 'Will USDJPY Break 160 as Hormuz Tensions Escalate and BoJ Policy Looms?' question highlights the anticipation surrounding potential shifts in monetary policy. Any indication from the Fed that they are becoming more concerned about inflation, or conversely, that they are seeing signs of cooling, will be pivotal. The market's pricing of Fed fund futures and OIS will be a real-time indicator of these expectations.
In Japan, investors will be keenly awaiting any signals from the Bank of Japan regarding its future monetary policy. While major data releases like CPI or GDP figures are important, any commentary from BoJ officials regarding the exit from negative interest rates or adjustments to yield curve control would have a more immediate and significant impact. The question 'is aud projected to get stronger than yen over the next week' hints at the broader currency sentiment towards the Yen. If market participants anticipate a more hawkish shift from the BoJ, the Yen could strengthen across the board, putting downward pressure on USDJPY. The absence of major Japanese data releases in the immediate short term means that BoJ rhetoric will likely be the primary focus for Yen traders. The market's interpretation of this rhetoric, particularly in light of global inflation trends and the BoJ's own inflation targets, will be crucial. The interplay between US monetary policy expectations and any potential shift in Japanese policy creates a dynamic environment where USDJPY could experience significant volatility.
Furthermore, the ongoing developments related to oil prices and geopolitical stability will continue to be a background factor. Any renewed escalation of tensions in the Middle East could trigger a flight to safety, potentially benefiting the Yen. Conversely, a sustained period of calm and falling oil prices might reduce inflationary pressures and support a more dovish outlook from the Fed, which could weaken the dollar. The 'Why Did Crude Oil Plunge 10% as Iran Reopens Key Strait?' analysis suggests that the market is still trying to price in the implications of this event. The sustainability of lower oil prices will be a key watch point. In essence, the upcoming week for USDJPY will be a test of these competing forces: the fundamental advantage of higher US interest rates versus the potential for Yen strength driven by risk aversion or BoJ policy shifts. Traders will need to remain agile, closely monitoring data releases and central bank communications for any signs of a decisive shift in the underlying balance.
FAQ Section
What happens if USDJPY breaks decisively above the $159.52 resistance level?
A sustained break above $159.52, confirmed by daily chart indicators turning bullish, could signal the start of a new upward trend. This would likely target the $159.93 resistance, with a secondary target at the significant psychological level of $160.57. Such a move would imply strong dollar buying, possibly driven by renewed expectations of higher US interest rates or a significant shift in risk sentiment.
Should I consider shorting USDJPY at current levels around $158.63 given the mixed signals?
Shorting at current levels carries risk due to the conflicting signals. While the 4-hour MACD and RSI lean bearish, the 1-hour Stochastic shows a bullish crossover. A more prudent approach for short sellers might be to wait for a confirmed break below the $158.22 support, targeting $157.86, or to fade rallies towards the $158.95 resistance if the bearish scenario gains traction.
Is the RSI at 48.98 on the daily chart a strong sell signal for USDJPY?
An RSI of 48.98 on the daily chart is not a strong sell signal in itself; it indicates a bearish bias but remains in neutral territory. It suggests that sellers have a slight edge, but the trend is not yet decisively bearish. Confirmation from other indicators like a MACD crossover below the signal line and a close below the daily middle Bollinger Band would be needed to validate a stronger bearish outlook.
How will upcoming US inflation data impact USDJPY this week?
Higher-than-expected US inflation data, such as a strong PCE reading, could reinforce the 'higher-for-longer' Fed rate narrative, likely strengthening the dollar and pushing USDJPY higher towards $159.52. Conversely, softer inflation could fuel speculation of earlier Fed rate cuts, weakening the dollar and potentially sending USDJPY towards the $158.48 support.
Looking Ahead: Patience and Precision in a Volatile Market
The USDJPY pair is currently at a critical juncture, reflecting a broader market grappling with inflation concerns, divergent monetary policies, and geopolitical uncertainties. The $158.63 level represents a battleground where short-term technical signals conflict with longer-term fundamental drivers. For scalpers, the intraday price action around $158.22 and $158.66 offers potential short-term opportunities, provided risk is managed tightly. Swing traders are likely best served by waiting for a decisive break above $158.95 or a confirmed move below $158.13, using the daily chart for confirmation. Long-term investors should focus on the fundamental narrative of interest rate differentials and potential BoJ policy shifts, viewing current levels as a potential accumulation zone if the bullish dollar case holds. The upcoming economic data, particularly from the US, and any rhetoric from the Bank of Japan, will be key catalysts in determining whether USDJPY breaks out of its current range or continues its consolidation. As always, disciplined risk management and waiting for clear, high-probability setups will be crucial for navigating this complex market environment.
Technical Outlook Summary
| Indicator | Value | Signal | Interpretation |
|---|---|---|---|
| RSI (14) | 48.98 | Neutral | Slightly bearish bias on daily, but not extreme. |
| MACD Histogram | -0.491 | Bearish | Negative momentum persists, indicating selling pressure. |
| Stochastic | K:49.92, D:52.65 | Neutral | Lines are close, indicating indecision, slight bearish lean. |
| ADX | 16.92 | Neutral | Lack of strong trend on the daily chart, suggests consolidation. |
| Bollinger Bands | Middle Band | Watch | Price hovering around the middle band suggests range-bound action. |
Key Levels
Support Levels
Resistance Levels
Track markets in real-time
AI-powered analysis, technical indicators and real-time price data.
Join Our Telegram Channel
Breaking market news, AI analysis and trading signals instantly.
Join Channel