

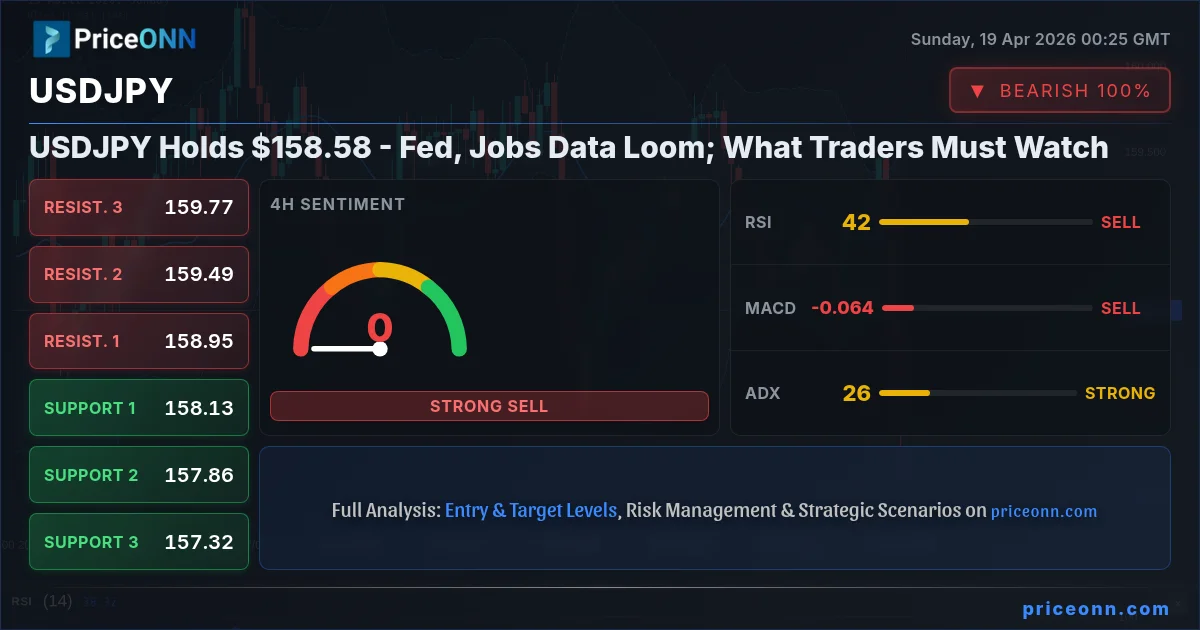
As the dust settles on another trading week, the USDJPY pair finds itself teetering precariously around the $158.58 mark. This level has proven to be a significant psychological and technical pivot point, with both bulls and bears testing its resolve throughout the past trading sessions. The market sentiment remains cautiously optimistic, yet tinged with an undercurrent of anticipation for the upcoming economic fireworks. The Federal Reserve's next policy meeting and crucial U.S. employment figures are on the horizon, promising to inject volatility and potentially dictate the short-to-medium term direction for this closely watched currency pair. Understanding the interplay between these fundamental drivers and the technical landscape is paramount for any trader aiming to navigate these waters effectively.
- USDJPY is consolidating around $158.58, a critical psychological and technical level.
- The upcoming week is dominated by key U.S. economic data: Federal Reserve interest rate decisions and Non-Farm Payrolls (NFP) figures.
- The Dollar Index (DXY) is currently trading at 97.9, showing a mixed but slightly weakening trend, which can influence USDJPY.
- Gold prices are at $4833.03, indicating a risk-on sentiment that could indirectly affect safe-haven demand for the Yen.
- Traders are watching for a decisive break above $159.00 resistance or a pullback towards the $158.50 support zone.
The recent price action in USDJPY, characterized by its consolidation around $158.58, paints a picture of market indecision. This is not surprising given the confluence of factors at play. On one hand, the U.S. dollar has shown some signs of weakness, evidenced by the Dollar Index (DXY) hovering around 97.9 and experiencing a slight daily decline. Historically, a weaker DXY often translates to pressure on USD-denominated pairs like USDJPY. However, the Bank of Japan's (BoJ) monetary policy stance, which remains persistently dovish compared to the Federal Reserve's tightening bias, provides a fundamental underpinning for the pair, preventing any significant downside moves. This tug-of-war between a potentially softening dollar and a structurally weaker yen is creating the current stalemate. For scalpers, this means watching for small intraday ranges and potential liquidity grabs around key levels like $158.50 and $159.00. Swing traders, on the other hand, will be looking for a clear breakout catalyst, likely from the upcoming U.S. data releases, to establish a directional bias.
Looking at the broader macroeconomic picture, the recent shifts in inflation and employment data in the U.S. are crucial. While inflation has shown some sticky components, the labor market has remained relatively robust, albeit with mixed signals. The upcoming Non-Farm Payrolls (NFP) report will be a significant data point. A stronger-than-expected NFP could reignite expectations of a hawkish Federal Reserve, potentially pushing the dollar higher against the yen. Conversely, a weaker report might fuel speculation of a Fed pivot or pause, which could lead to dollar weakness and a test of lower support levels for USDJPY. The market's reaction to these figures will be heavily influenced by current sentiment and positioning. For long-term investors, the divergence in monetary policy between the Fed and the BoJ remains the dominant theme. As long as the Fed is perceived to be on a path of higher interest rates for longer, the interest rate differential will continue to favor the dollar, creating a long-term bullish bias for USDJPY, even amidst short-term consolidation or pullbacks. This structural advantage is a key element to consider when assessing the pair's longer-term trajectory.
Navigating the Technical Landscape: What the Charts Are Saying
The 1-Hour Chart: Intraday Volatility and Key Levels
On the 1-hour timeframe, USDJPY is currently displaying a neutral trend with a moderate power percentage of 50%. This suggests a lack of strong directional conviction in the immediate intraday session. The RSI(14) reading of 45.57 indicates a neutral position, leaning towards oversold territory, but without a clear upward or downward trajectory. This is further supported by the MACD, which is showing negative momentum and is positioned below its signal line, hinting at some prevailing selling pressure. However, the Stochastic Oscillator offers a conflicting signal, with its %K line at 49.32 and %D line at 27.35, suggesting a potential bullish crossover and a move out of oversold conditions. The ADX at 35.77, however, points to a strong downward trend, which seems to contradict the Stochastic signal. This divergence highlights the choppy nature of the intraday market. The general signal leans towards 'SELL' (Al: 2, Sat: 6, Nötr: 0), reflecting the prevailing bearish momentum on this shorter timeframe. For scalpers, the immediate focus will be on the intraday support at $158.222 and resistance at $158.547. A break and hold above $158.547 could signal a short-term bounce, targeting $158.664. Conversely, a drop below $158.222 might see a move towards $158.014.
The 4-Hour Chart: A Stronger Bearish Lean
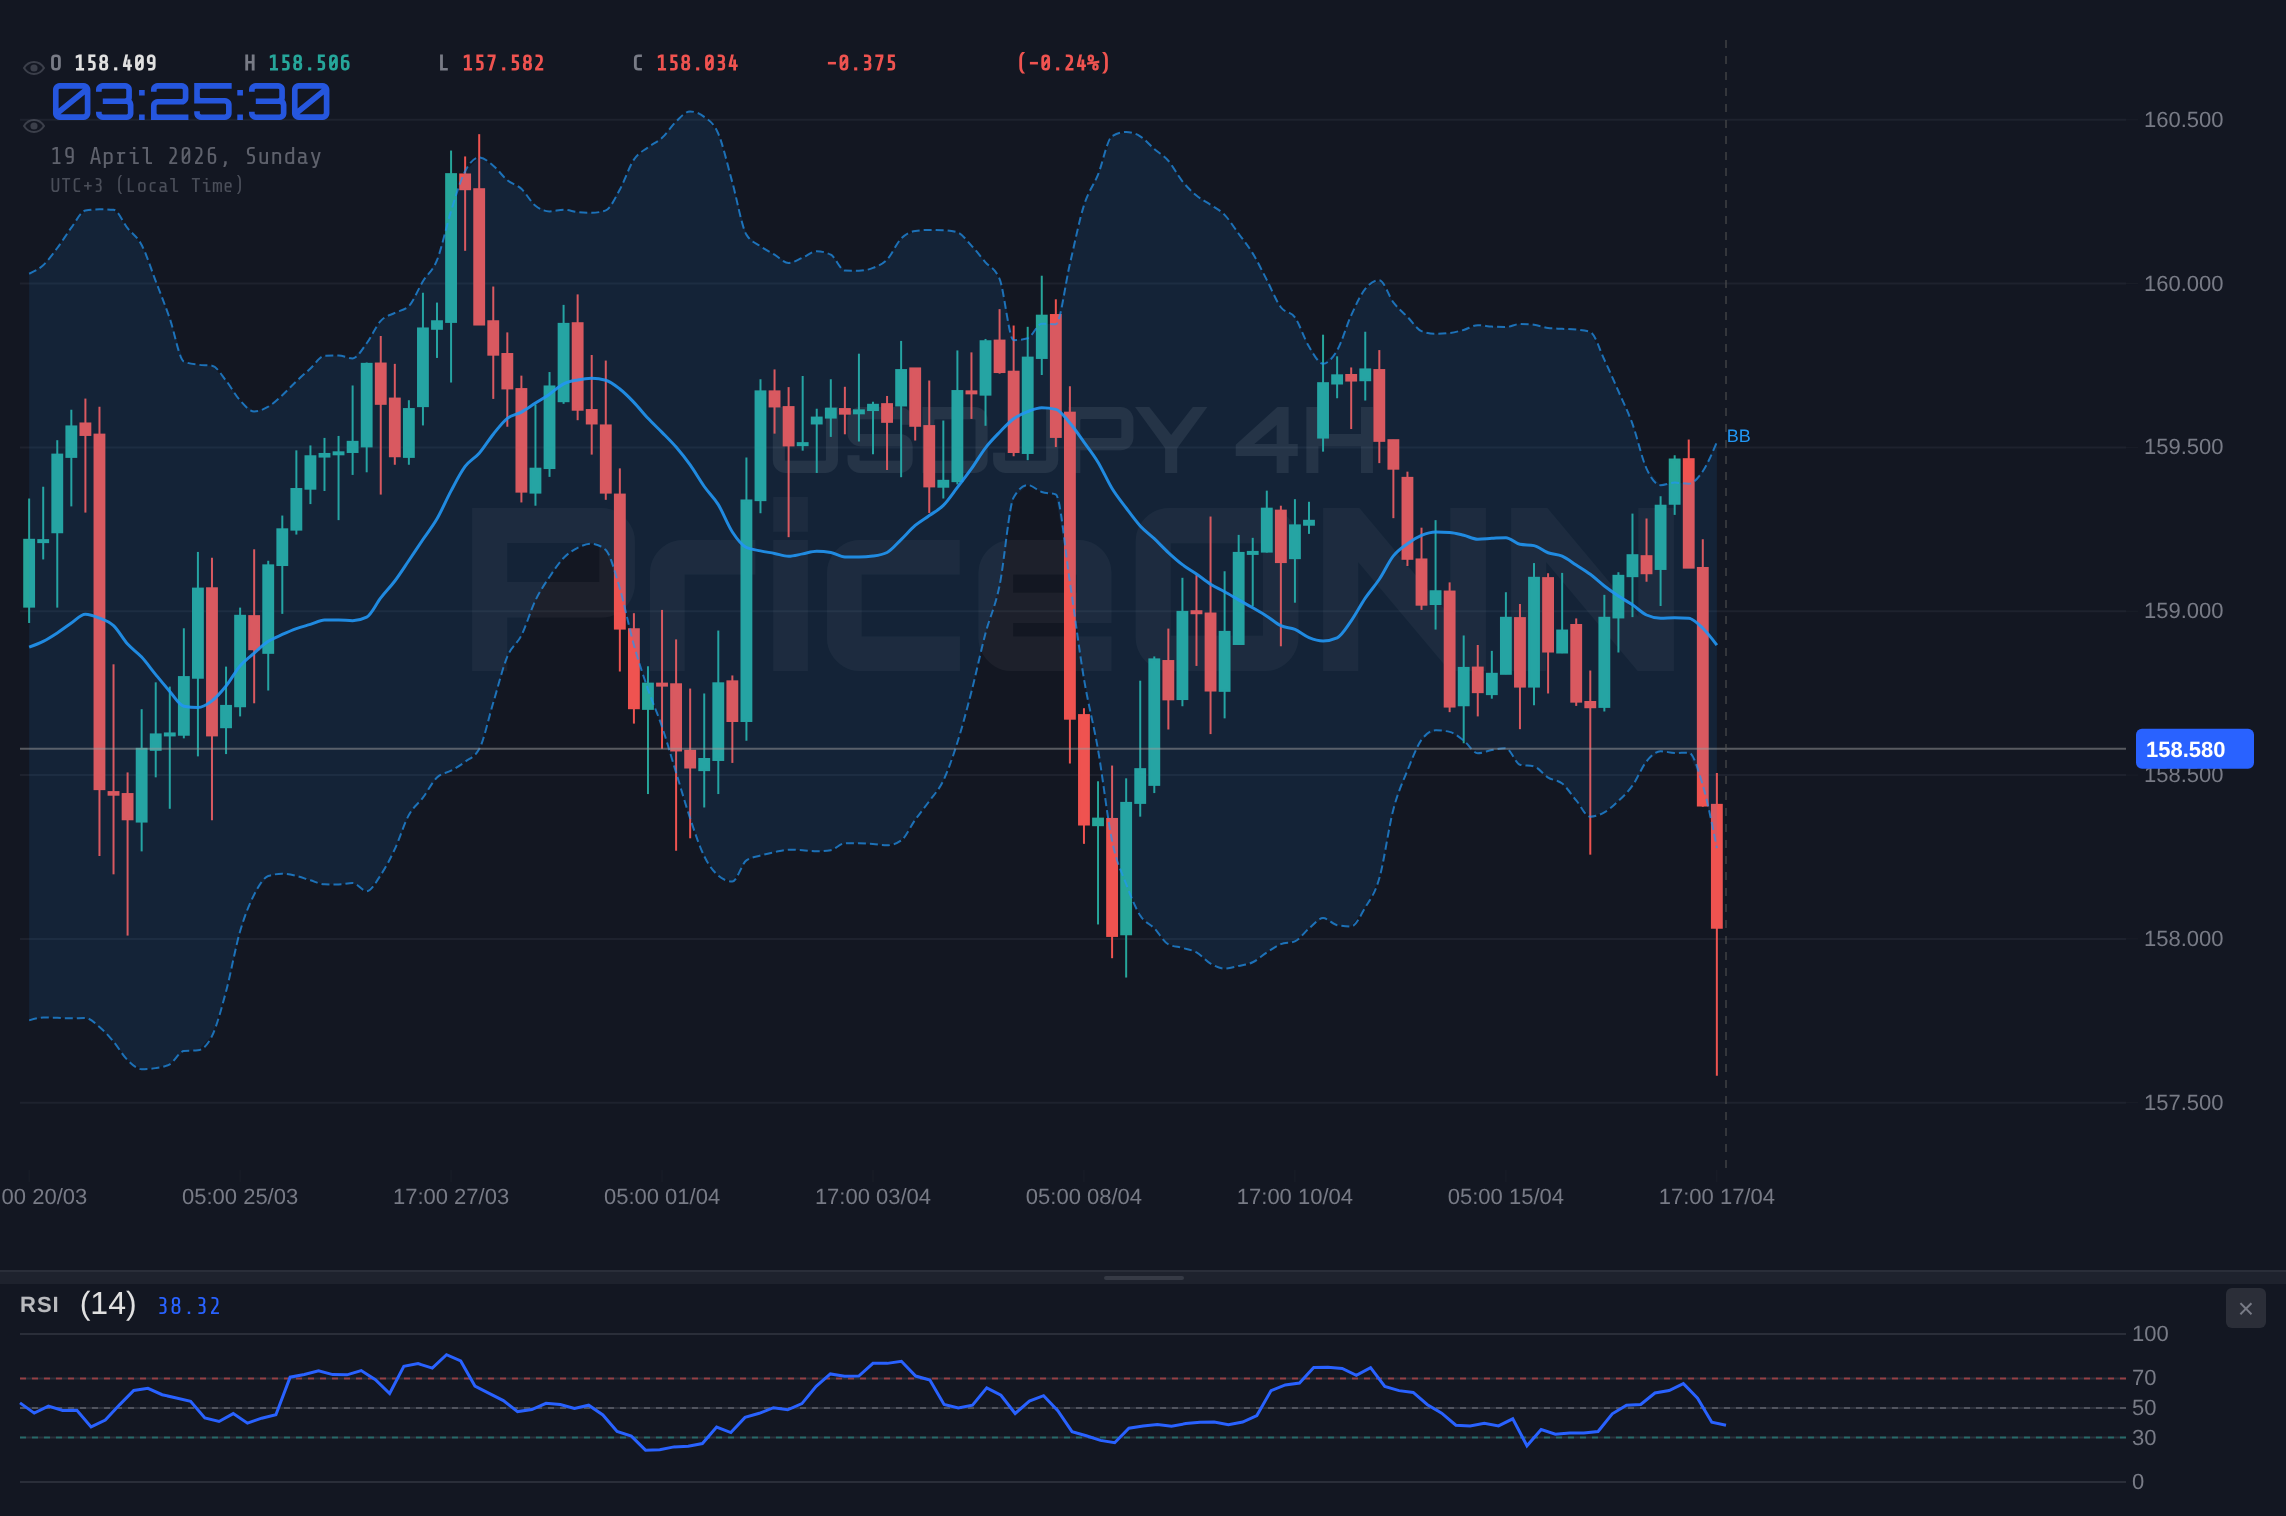
Stepping back to the 4-hour chart, the picture becomes slightly clearer, though still exhibiting some internal conflicts. The trend is officially neutral (50% power), but the technical indicators suggest a stronger bearish inclination. The RSI(14) at 41.88 is firmly in neutral territory, trending downwards, reinforcing the idea of prevailing selling pressure. The MACD remains negative and below its signal line, confirming the bearish momentum. The Bollinger Bands are positioned below the middle band, often indicating a potential break or continuation of a downtrend, though this can also signal oversold conditions if prices are near the lower band. The Stochastic Oscillator (%K=44.15, %D=77.23) shows a bearish signal with %K below %D, and it is not in oversold territory. The ADX value of 25.69 indicates a strong downtrend, reinforcing the bearish sentiment. The overall signal for this timeframe is a clear 'SELL' (Al: 0, Sat: 8, Nötr: 0). This suggests that while intraday fluctuations might occur, the medium-term trend on the 4-hour chart is leaning towards the downside. Key support levels to watch on this timeframe are $158.133, $157.860, and $157.316. Resistance is seen at $158.950, $159.494, and $159.767. For swing traders, a break below $158.133 could be the trigger for a short position, aiming for lower targets.
The Daily Chart: Long-Term View and Conflicting Signals
On the daily chart, USDJPY presents a more complex and somewhat contradictory outlook. The trend is identified as 'Uplifting' (83% power), which initially seems bullish. However, the current price action and many indicators suggest otherwise in the short-to-medium term. The RSI(14) is at 48.67, sitting in neutral territory and trending downwards, indicating a lack of bullish momentum and potential for further downside. The MACD is negative and below its signal line, a classic bearish signal suggesting that selling pressure is dominant. The Bollinger Bands are also below the middle band, reinforcing the bearish bias. The Stochastic Oscillator (%K=49.33, %D=52.55) shows a bearish signal, with %K below %D, and is hovering near the midpoint, not indicating oversold conditions. The ADX at 16.92 suggests a weak trend, which often precedes a significant move, but the other indicators lean bearish. The overall signal here is 'SELL' (Al: 1, Sat: 6, Nötr: 0), which contrasts sharply with the 'Uplifting' trend classification. This discrepancy might indicate that the long-term uptrend is still intact structurally, but the current momentum is bearish. This is a crucial distinction for traders. For example, a long-term investor might see this as a dip within a larger uptrend, a potential buying opportunity if key daily supports hold. However, for short-to-medium term traders, the prevailing signals suggest caution and a focus on potential downside targets. The daily support levels are $158.483, $157.849, and $157.442, while resistance is eyed at $159.524, $159.931, and $160.565. The failure to hold $158.50 could accelerate the move towards $158.133.
Fundamental Drivers: The Fed, Jobs, and the Yen's Fate
The most significant fundamental drivers for USDJPY in the coming week will undoubtedly be the U.S. economic calendar. The Federal Reserve's interest rate decision and accompanying statement are paramount. While a rate hike is highly improbable at this stage, the market will be dissecting the Fed's commentary for clues about future policy direction. Any hint of a more hawkish stance – perhaps due to persistent inflation or a strong labor market – could bolster the dollar. Conversely, signals of a more dovish approach, or even a pause in tightening, might weaken the dollar. This is where the concept of interest rate differentials becomes critical. The wider the gap between U.S. and Japanese interest rates, the more attractive the dollar becomes relative to the yen, all else being equal. The current market pricing, as reflected in Fed Fund Futures, will be closely scrutinized for shifts in expectations. If the Fed signals a higher-for-longer rate environment, it could provide a significant tailwind for USDJPY.
Complementing the Fed's decision will be the U.S. Non-Farm Payrolls (NFP) report. This is a cornerstone of U.S. employment data and a key indicator of the health of the world's largest economy. A robust NFP print, significantly exceeding forecasts, would reinforce the case for a hawkish Fed and likely send USDJPY higher. For instance, if the actual NFP figure comes in at 250,000 or more, significantly beating a forecast of, say, 180,000, we could see a sharp upward reaction. Conversely, an NFP reading that falls short of expectations, or even shows job losses, would likely trigger dollar selling and put downward pressure on USDJPY. Traders will also be paying close attention to average hourly earnings for inflation clues and the unemployment rate itself. The market's reaction will depend not just on the headline number but also on its components and how they align with the Fed's inflation targets. The interplay between these data points and the Fed's reaction function is what will truly drive price action.
Beyond the immediate U.S. data, we must consider the Bank of Japan's (BoJ) policy. While the BoJ has recently made a historic shift away from negative interest rates, its overall policy remains exceptionally accommodative compared to global peers. Governor Ueda has emphasized a data-dependent approach and has not signaled an aggressive rate-hiking cycle. This continued divergence in monetary policy is a fundamental pillar supporting USDJPY. Even if the Fed pauses or signals a less aggressive path, the BoJ is unlikely to follow suit in the short term. This structural difference means that even if the dollar weakens slightly due to Fed expectations, the yen's inherent weakness driven by BoJ policy could cushion the fall or even lead to further appreciation of USDJPY. The market will be listening intently for any subtle shifts in BoJ rhetoric, but for now, the policy divergence remains a key factor favoring the dollar's strength against the yen over the longer term.
Correlations and Market Sentiment: The Bigger Picture
Understanding USDJPY's movement requires looking beyond the direct currency pair and examining its correlations with other major markets. The Dollar Index (DXY) is perhaps the most critical. Currently trading at 97.9, the DXY has shown a slight downward bias recently. A sustained move lower in DXY, perhaps below 97.50, would typically exert downward pressure on USDJPY. However, the strength of this correlation can vary. If the dollar's weakness is driven by global risk aversion (which might paradoxically strengthen the yen as a safe haven), then USDJPY could fall even if DXY is also falling. Conversely, if the dollar weakens due to U.S. specific factors (like weaker-than-expected data or a dovish Fed signal), the correlation with USDJPY is usually more direct. The current ADX readings on the daily charts for DXY (26.2, strong downtrend) suggest a potentially weakening dollar trend, which warrants close monitoring for USDJPY's implications.
Equity markets, particularly the S&P 500 (currently at 6572.87) and Nasdaq 100 (at 26681.85), offer insights into global risk appetite. Both indices are showing strength, with the S&P 500 up 0.74% and Nasdaq up 1.44% on the day. Strong equity markets often correlate with increased risk appetite, which can be bearish for safe-haven assets like the Japanese Yen. If equities continue to rally, it could provide indirect support for USDJPY, encouraging traders to move away from the yen and towards higher-yielding or riskier assets. Conversely, a sharp sell-off in equities, perhaps triggered by disappointing economic data or geopolitical tensions, could lead to a flight to safety, benefiting the yen and potentially causing USDJPY to fall. The current daily ADX for S&P 500 (47.51, strong downtrend) and Nasdaq 100 (29.85, strong uptrend) show conflicting trends within the equity space, adding another layer of complexity to risk sentiment analysis.
The price of gold (XAUUSD at $4833.03) and oil (Brent at $92.57, WTI at $86.44) also provide valuable context. Gold often acts as a safe-haven asset, and its price movements can be inversely correlated with the dollar and risk appetite. The current rise in gold prices suggests a degree of underlying uncertainty or perhaps inflation concerns, which could be supportive of the yen. However, the strength of this correlation is not always consistent. Oil prices, currently experiencing a significant daily drop (-6.9% for Brent, -6.68% for WTI), are often seen as an inflation indicator. A sharp fall in oil prices could temper inflation expectations, potentially influencing Fed policy and, consequently, the dollar's trajectory. The current bearish trend in oil, with daily ADX values of 34.16 for Brent and 38.29 for WTI, suggests significant selling pressure in the energy markets, which could have ripple effects across global inflation outlooks and central bank policies.
What Different Trader Types Should Watch
For scalpers operating on the 1-hour timeframe, the key is to focus on intraday ranges and volatility. The current neutral trend and conflicting signals on this chart suggest choppy conditions. Scalpers should be looking for clear breaks of immediate support at $158.222 or resistance at $158.547. A successful hold above $158.547 could offer a quick scalp opportunity targeting $158.664, while a break below $158.222 might target $158.014. Volume analysis and order flow can be crucial here, as these small moves are often driven by short-term liquidity grabs. Patience is vital; waiting for a clear setup rather than chasing fleeting price movements will be key to success in this environment.
Swing traders, focusing on the 4-hour and daily charts, will be looking for more significant directional moves. The bearish signals on the 4-hour chart (ADX 25.69, strong downtrend) and the 'SELL' signal suggest that a short position might be considered on a break below the $158.133 support level. The target would then be the next significant support at $157.860. However, the conflicting daily chart signals, with its 'Uplifting' trend classification but bearish short-term indicators, introduce caution. A more conservative approach for swing traders might be to wait for the major U.S. data releases next week. A clear break above the daily resistance at $159.524, coupled with a bullish signal from the Fed announcement, could signal a resumption of the longer-term uptrend, with targets towards $160.00. Conversely, a failure to hold $158.50 could accelerate the move lower.
Long-term investors will likely view the current consolidation around $158.58 as a pause within a larger structural uptrend, primarily driven by the interest rate differential between the U.S. and Japan. The BoJ's continued accommodative stance, even with the recent rate hike, contrasts sharply with the Fed's potential for further tightening or a prolonged period of higher rates. This fundamental divergence suggests that, over the long haul, the dollar is likely to remain strong against the yen. Investors might see dips towards the daily support levels, such as $158.133 or even $157.849, as opportunities to accumulate positions, anticipating a eventual move towards the $160.00 psychological level and beyond. However, they must remain aware of potential geopolitical risks or sudden shifts in central bank policy that could alter this long-term outlook.
Historical Context: Patterns of Consolidation and Breakout
Looking back at the historical performance of USDJPY, periods of consolidation around significant psychological levels like $158.00 or $160.00 are not uncommon. These phases often precede major directional moves, driven by significant economic events or shifts in monetary policy expectations. For instance, during previous periods of Fed tightening cycles, USDJPY has often entered consolidation phases before breaking out to new highs, fueled by widening interest rate differentials. Similarly, periods of global risk aversion have seen USDJPY pull back as the yen found some safe-haven demand, but these moves were often temporary as long as the underlying policy divergence persisted. The current setup, with USDJPY hovering around $158.58, echoes some of these past patterns. The key difference now is the BoJ's exit from negative rates, which adds a new layer of complexity. While still dovish, this policy shift means the yen might find slightly more resilience than in previous cycles. However, the Fed's actions remain the dominant force. Traders who studied the 2015-2016 Fed tightening cycle, for example, might recall similar ranges before a decisive upward trend emerged, driven by policy divergence and dollar strength.
The current technical readings, such as the RSI hovering in the mid-range (around 48.67 on the daily) and ADX values indicating moderate to strong trends depending on the timeframe (16.92 daily, 25.69 4H, 35.77 1H), suggest that the market is building energy for a move. Historically, when ADX values are in this range and RSI is not in extreme overbought or oversold territory, it often precedes a significant breakout. The conflicting signals between timeframes also highlight a market at a crossroads. The daily chart's 'Uplifting' trend classification, despite current bearish indicators, suggests that the underlying structure might be more resilient than the short-term signals imply. This is a classic scenario where fundamental catalysts, like the upcoming Fed announcement and NFP data, are needed to provide the impetus for a decisive move. Traders who historically capitalized on such setups often waited for confirmation, either a decisive break of key resistance ($159.524 on the daily) or a test and hold of significant support ($158.133 on the daily), before committing to a trade.
Furthermore, the influence of geopolitical events cannot be understated. While not the primary driver currently, events like the tensions surrounding the Strait of Hormuz, which have impacted oil prices (Brent down 6.9%, WTI down 6.68%), can indirectly affect currency markets. Heightened geopolitical risks can sometimes lead to a flight to perceived safe-haven currencies, including the Japanese Yen. However, the current market reaction, with gold prices rising to $4833.03, suggests that safe-haven demand is present but not overwhelming. The key is to monitor how these broader market sentiments interact with the specific USDJPY fundamental drivers. If geopolitical fears escalate significantly, it could temporarily override the interest rate differential theme, leading to Yen strength and a move lower in USDJPY, even if the Fed remains hawkish. Historically, such safe-haven flows tend to be temporary unless they trigger a broader economic crisis, which could then prompt a more significant policy response from the BoJ.
Upcoming Economic Events and Their Potential Impact
The economic calendar for the upcoming week is dense with high-impact events, primarily centered around the United States. The Federal Reserve's interest rate decision and policy statement are scheduled for Wednesday. While the market widely expects rates to remain unchanged, the accompanying statement and press conference will be scrutinized for forward guidance. Any indication of a shift in the Fed's inflation outlook or its stance on future rate hikes could trigger significant market volatility. For USDJPY, a more hawkish tone from the Fed would likely push the pair higher, targeting resistance levels above $159.00. Conversely, a more dovish or cautious tone could lead to dollar weakness and a test of the $158.50 support zone. The market's interpretation of the Fed's commentary will be crucial.
Following the Fed, the U.S. Non-Farm Payrolls (NFP) report is due on Friday. This is a critical employment data release that will provide a snapshot of the U.S. labor market's health. The forecast is for 207,000 jobs added, a decrease from the previous 218,000. If the actual number significantly outperforms this forecast, it would reinforce the bullish case for the dollar and USDJPY. For example, an NFP print above 250,000 could see USDJPY surge towards $159.524 and potentially higher. However, if the NFP falls short of expectations, perhaps below 150,000, it could trigger dollar selling and push USDJPY lower, testing the $158.133 support. The market will also be watching Average Hourly Earnings for inflation signals and the Unemployment Rate. A rising unemployment rate or stagnant wage growth could further dampen dollar strength.
Other U.S. data points to watch include Retail Sales, which are crucial for gauging consumer spending resilience amid inflation concerns. The forecast for Retail Sales is -1% (previous 0.6%), suggesting a potential contraction in consumer spending. A significantly weaker-than-expected report could add to dollar weakness. Additionally, PMI data for manufacturing and services sectors will offer insights into economic activity. For Japan, while no major high-impact events are scheduled this week that directly influence the yen's immediate direction, any subtle shifts in rhetoric from BoJ officials regarding future policy normalization could still have an impact, especially if they contrast sharply with Fed messaging. The overall narrative will likely be dominated by U.S. data, but any unexpected commentary from Japan could add another layer of volatility.
Bearish Scenario: Yen Strength Emerges
65% ProbabilityNeutral Scenario: Consolidation Continues
25% ProbabilityBullish Scenario: Dollar Dominance Returns
10% ProbabilityFrequently Asked Questions: USDJPY Analysis
What happens if USDJPY breaks below the $158.50 support level this week?
A break and sustained hold below $158.50 would invalidate the current neutral stance and likely trigger a move towards the next significant support at $158.133. This scenario becomes more probable if U.S. economic data disappoints or if the Federal Reserve adopts a more dovish tone than anticipated.
Should I consider buying USDJPY at current levels around $158.58 given the mixed signals?
Buying at current levels carries significant risk due to conflicting signals across timeframes. A more prudent approach would be to wait for confirmation, such as a clear break above the $159.00 resistance, ideally supported by hawkish Fed commentary, or a test and hold of the $158.133 support level, especially if U.S. data is weak.
Is the RSI at 48.67 on the daily chart a sell signal for USDJPY right now?
An RSI reading of 48.67 on the daily chart is in neutral territory, but its downward trend suggests weakening bullish momentum. While not a direct sell signal on its own, it reinforces the bearish sentiment seen in other indicators like the MACD and Bollinger Bands on shorter timeframes, indicating caution for buyers.
How will the upcoming Fed decision and NFP data affect USDJPY this week?
A hawkish Fed and strong NFP data could push USDJPY towards $159.524 and potentially higher, reinforcing the dollar's strength. Conversely, dovish Fed signals or weak NFP data could lead to dollar weakness, driving USDJPY down to test support levels near $158.133.
Technical Outlook Summary
| Indicator | Value | Signal | Interpretation |
|---|---|---|---|
| RSI (14) | 48.67 | Neutral | Downward trend, lacks bullish momentum. |
| MACD Histogram | -0.44 | Bearish | Negative momentum, below signal line. |
| Stochastic | K:49.33, D:52.55 | Bearish | %K below %D, bearish crossover. |
| ADX | 16.92 | Weak Trend | Suggests consolidation or pre-breakout phase. |
| Bollinger Bands | Middle Band | Below | Price trading below middle band, bearish bias. |
Track markets in real-time
AI-powered analysis, technical indicators and real-time price data.
Join Our Telegram Channel
Breaking market news, AI analysis and trading signals instantly.
Join Channel