

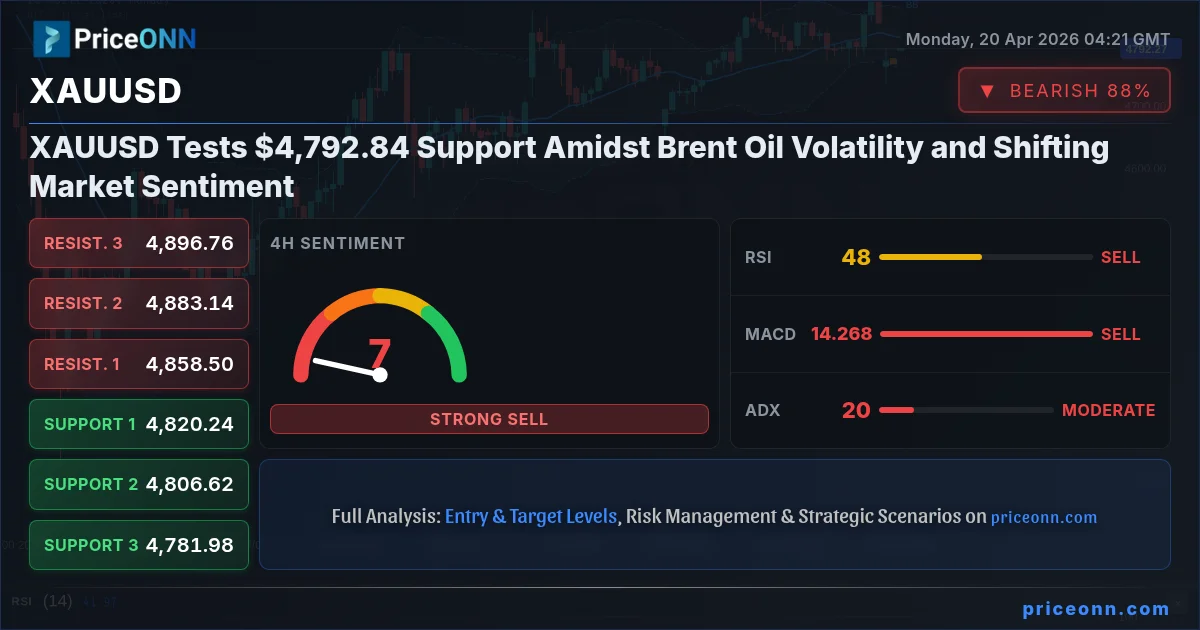
Gold prices are currently navigating a challenging landscape, with the primary focus on XAUUSD testing the crucial support level at $4,792.84. This movement occurs against a backdrop of significant volatility in Brent crude oil, currently trading around $96.53, and broader market shifts that demand careful analysis. As a seasoned analyst with over three decades of experience, I see this period as a critical juncture, demanding a deep dive into the interplay of technical signals, fundamental drivers, and geopolitical undercurrents that are shaping the precious metal's trajectory. The market's reaction to these forces will determine whether gold can hold its ground or face further downside pressure.
- XAUUSD is currently testing a critical support level at $4,792.84, with the 1H and 4H timeframes showing a neutral to bearish bias.
- Brent crude oil is exhibiting significant upward volatility, trading at $96.53, which historically can influence inflation expectations and safe-haven demand for gold.
- The Dollar Index (DXY) is showing mixed signals across timeframes, trading near 98, adding complexity to gold's price action.
- On the 1D timeframe, XAUUSD shows a 'BUY' signal with RSI at 51.27, indicating potential for a rebound despite shorter-term weakness.
The immediate technical picture for gold presents a complex mosaic of signals, particularly when viewed across different timeframes. On the 1-hour chart, XAUUSD is showing a neutral trend with a strength of 50%, underscored by a 'SELL' signal derived from a confluence of indicators. The RSI(14) at 44.9 indicates a slight bearish inclination, while the MACD is displaying negative momentum below its signal line. Bollinger Bands are also trading below the middle band, suggesting downward pressure. However, the Stochastic oscillator on this timeframe presents a contrasting view, with %K (46.59) above %D (32.97), hinting at a potential upward move. The ADX at 27.05 points to a strong downtrend, adding to the short-term bearish sentiment. This mixed bag of signals on the intraday charts suggests caution for short-term traders.
Shifting to the 4-hour timeframe, the trend indicator flips to 'Uptrend' with a robust 90% strength, yet the overall signal remains 'SELL'. This divergence is noteworthy. The RSI(14) at 48.51 continues to lean towards neutral but with a downward tendency. The MACD remains in negative territory, and Bollinger Bands are below the middle band, reinforcing the bearish outlook on this timeframe. The Stochastic oscillator here shows %K (57.61) slightly below %D (58.39), signaling a potential dip. The ADX at 20.42 indicates a moderately strong downtrend. Despite the uptrend signal from the trend strength, the confluence of other indicators points towards potential selling pressure in the medium term, especially as price hovers around the critical $4,792.84 mark.
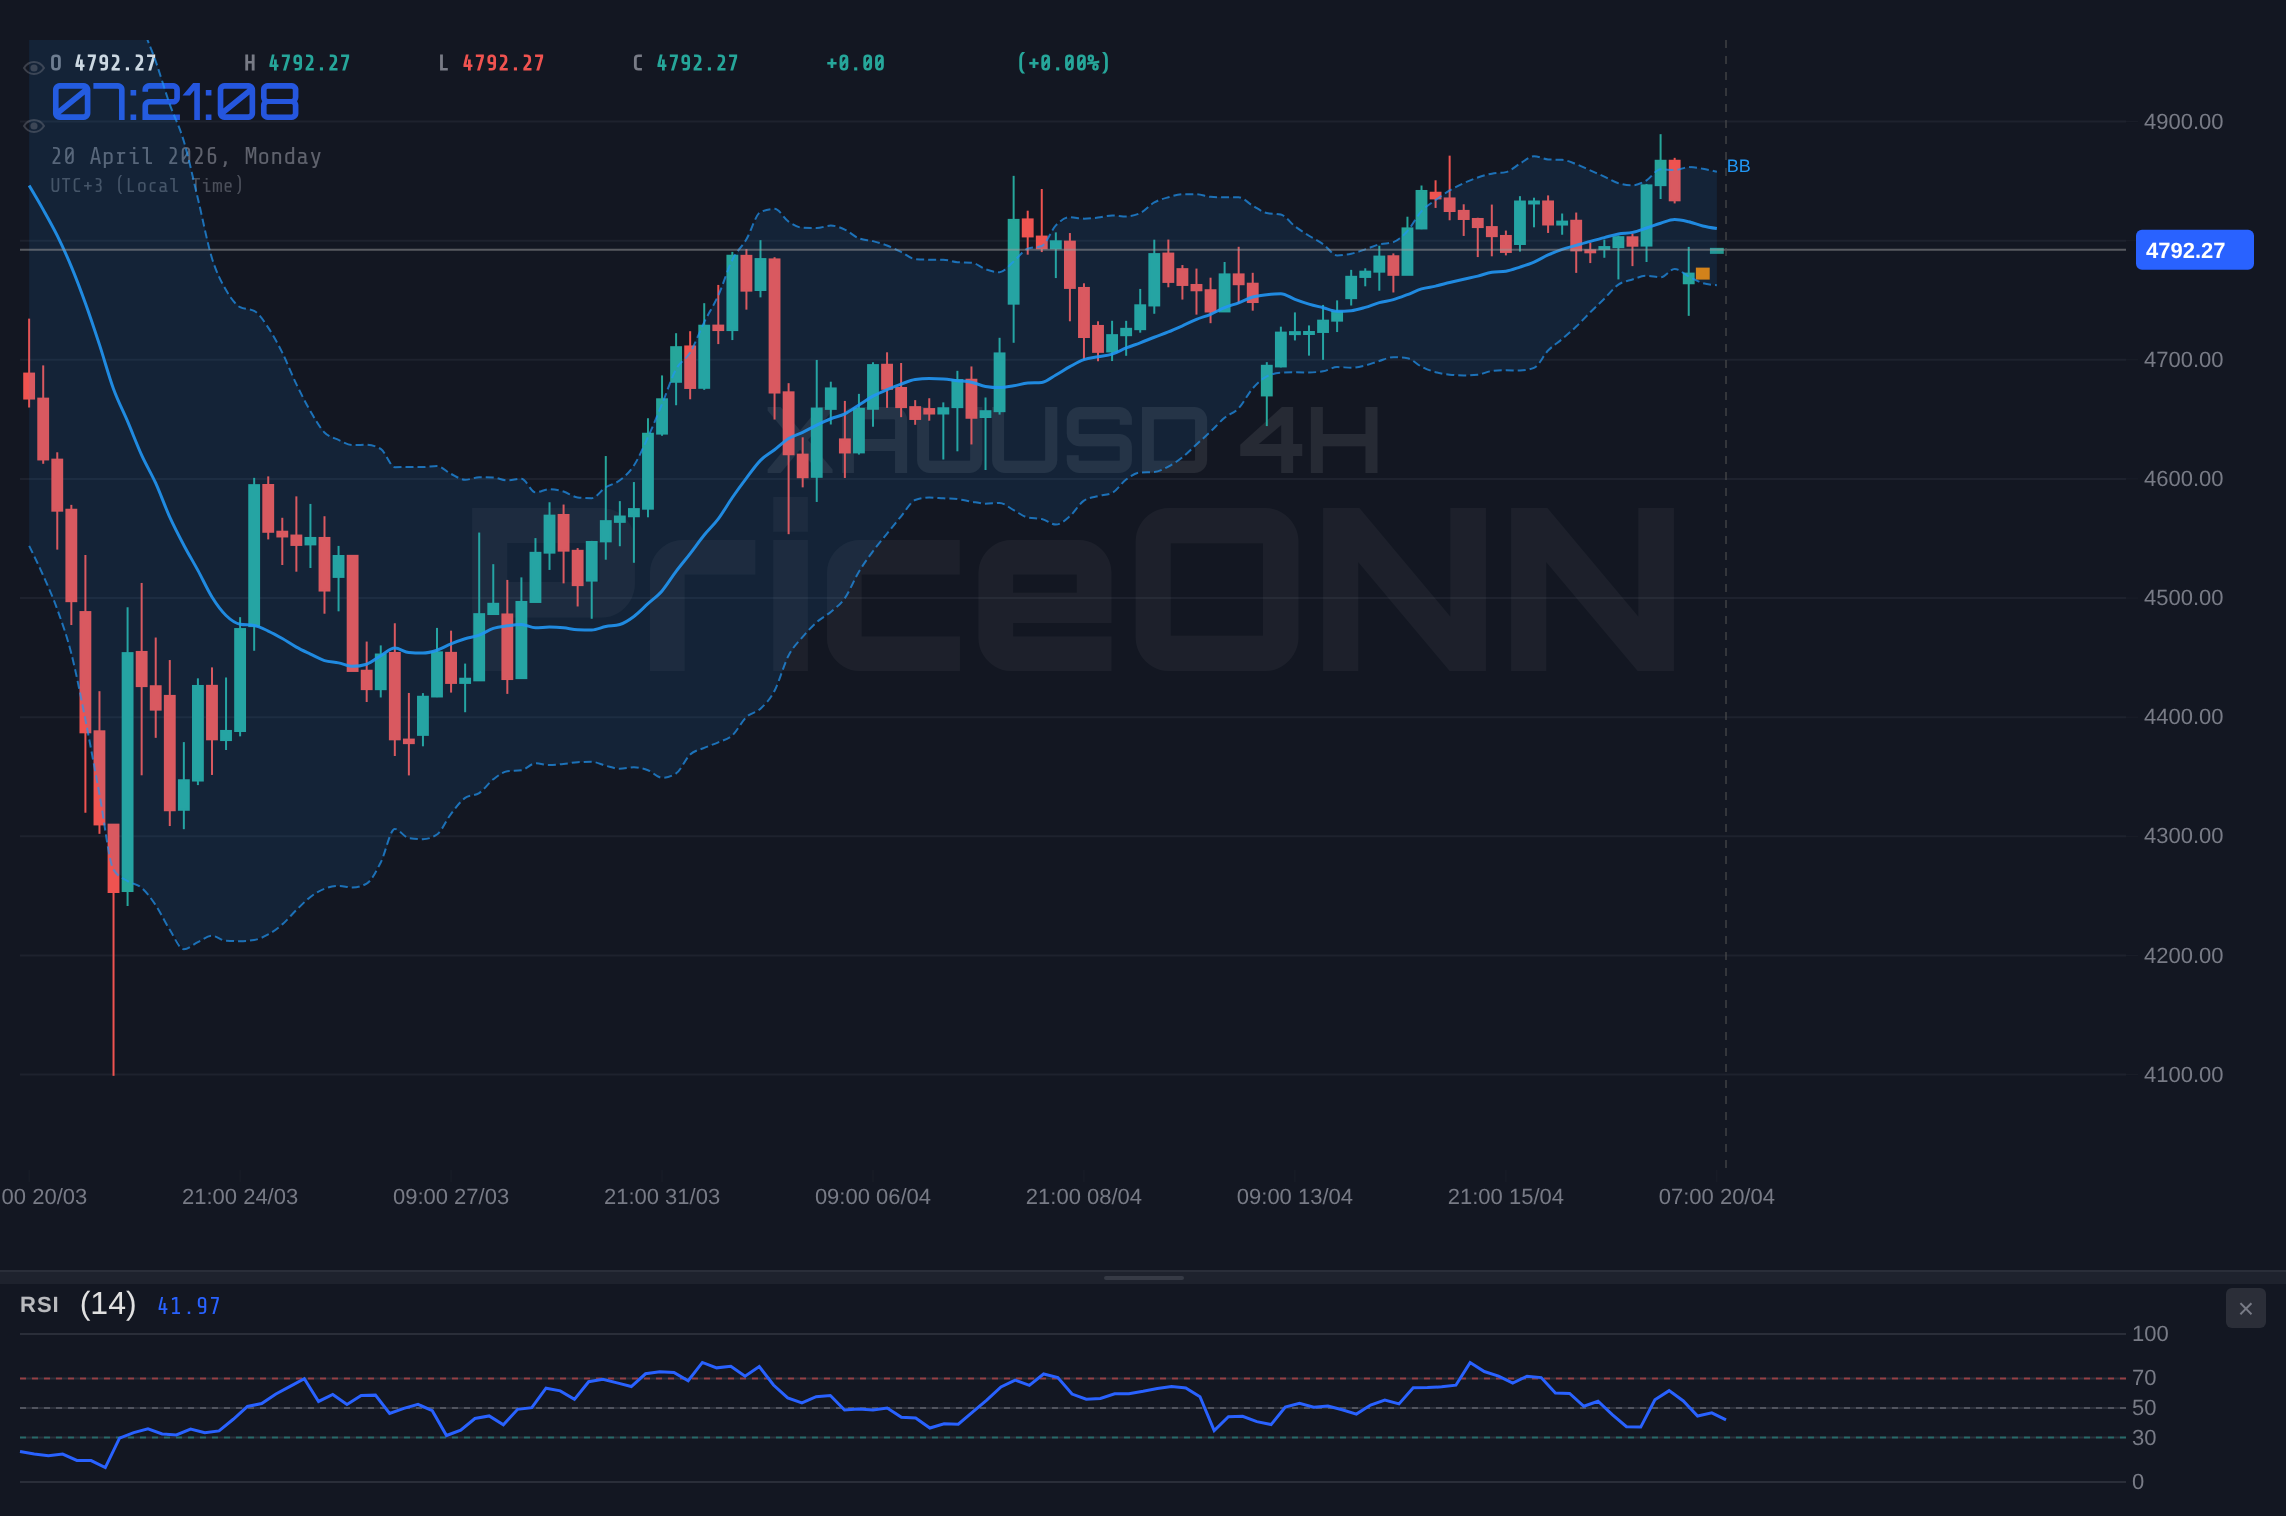
The daily chart, however, offers a glimmer of hope for gold bulls. Here, the trend is clearly defined as 'Downtrend' with 86% strength, but the overall signal flips to 'BUY'. This is a significant observation; it suggests that the longer-term perspective might be more constructive, even as intraday and 4-hour charts signal caution. The RSI(14) at 51.27 is sitting comfortably in the neutral zone, showing a slight upward tendency. Crucially, the MACD is exhibiting positive momentum, trading above its signal line, and the Bollinger Bands are situated above the middle band, indicating an upward bias. The Stochastic oscillator, with %K at 70.34 and %D at 76.83, shows %K below %D, which is a bearish signal in this specific configuration, but the overall daily momentum is positive. The ADX at 21.26 confirms a moderately strong downtrend, which, paradoxically, can set the stage for a reversal if key resistance levels are breached.
Navigating the $4,792.84 Crucible
The current price of $4,792.84 for XAUUSD is not just another number; it represents a critical battleground where short-term bearish pressures contend with longer-term bullish underpinnings. The support levels identified on the 1-hour chart at 4790.35, 4783.70, and 4774.48 are the immediate lines of defense. A decisive break below these could trigger further selling, potentially testing the 4-hour support at 4820.24 (although this is above the current price, it represents a significant psychological level that has now become resistance) and then the more substantial support at 4781.98. On the flip side, resistance on the 1-hour chart lies at 4806.22, 4815.44, and 4822.09. A sustained move above these levels, particularly the 4806.22 mark, would be the first sign of bulls regaining control and could pave the way for testing the 4-hour resistance zone around 4858.50.
The daily chart's support levels at 4771.08, 4708.31, and 4649.15 represent much deeper floors. A failure to hold the immediate $4,792.84 area could see prices gravitate towards these lower bounds. Conversely, the daily resistance levels at 4893.01, 4952.17, and 5014.94 are the targets for a potential reversal scenario. The fact that the daily MACD is positive and RSI shows a slight upward drift suggests that underlying strength might be building, awaiting a catalyst to break through the current bearish sentiment that dominates the shorter timeframes. This structural divergence is key for any strategic outlook.
The Oil-Gold Correlation: A Volatile Dance
The significant spike in Brent crude oil prices, pushing towards $96.53, cannot be ignored when analyzing gold's movements. Historically, rising oil prices often correlate with increasing inflation expectations. As a safe-haven asset and a hedge against inflation, gold typically benefits from such an environment. However, the relationship is not always straightforward. This week, we've seen oil prices surge amid geopolitical tensions, particularly concerning the Strait of Hormuz, as reported by sources like Reuters. While this could normally spur demand for gold as a safe haven, the immediate price action shows gold under pressure. This suggests that other factors, perhaps concerning broader market risk appetite or specific central bank actions, are currently overriding the typical inflation hedge narrative.
The geopolitical narrative around the Strait of Hormuz, with reports of its temporary reopening followed by renewed tensions, adds a layer of complexity. While the initial easing of tensions might have initially weighed on gold, the resurfacing of concerns, as highlighted by some forex news outlets, could theoretically reignite safe-haven demand. Yet, XAUUSD is currently trading lower. This disconnect implies that market participants might be less sensitive to these particular geopolitical risks, or that the dominant force currently is a strengthening dollar or a rotation out of risk assets that isn't yet translating into robust gold buying. Understanding this dynamic is crucial; the market is not always behaving as textbooks suggest, and we must follow the price action and the confluence of data.
Macroeconomic Crosscurrents: DXY, Rates, and Risk Appetite
The Dollar Index (DXY), a critical barometer for gold's performance, is currently trading around 98.00, showing mixed signals across different timeframes. On the 1-hour chart, DXY shows a 'BUY' signal with a neutral trend, RSI at 60.96, and positive MACD momentum, suggesting a strengthening dollar. The 4-hour chart also leans bullish, despite a strong downtrend indicated by the ADX. Conversely, the daily chart presents a bearish outlook for the dollar, with RSI at 42.36 and negative MACD momentum. This ambiguity in the DXY adds another layer of uncertainty for gold. A stronger dollar typically exerts downward pressure on gold by making it more expensive for holders of other currencies, and vice-versa. The current mixed signals mean the dollar's influence on gold is not a straightforward one-way street at this precise moment.
The broader market sentiment, often gauged by equity indices like the S&P 500 and Nasdaq 100, also plays a pivotal role. The S&P 500 is showing a strong 'BUY' signal on the 1-hour and 4-hour charts, with prices rising and ADX indicating a strong uptrend. However, the 1-day chart presents a bearish signal, with RSI at 45.35 and negative MACD momentum, suggesting potential weakness ahead. The Nasdaq 100, while showing a 'BUY' signal on the 1-hour and 1-day charts, exhibits overbought conditions on its 4-hour and 1-day charts (RSI 72.8 and 71.82 respectively), indicating a potential for a pullback. This mixed picture in equities suggests that risk appetite is not uniformly robust. Typically, a decline in risk appetite would boost safe-haven assets like gold. The current downward pressure on gold, despite potential signs of risk aversion in some equity indicators, highlights the complexity of market dynamics and the need to prioritize price action and concrete data over generalized correlations.
Central bank policies and interest rate expectations remain a constant undercurrent. While specific upcoming economic data releases like US Retail Sales, Fed Fund Futures, and PMI figures are on the horizon, their immediate impact is yet to be felt. However, the market is always pricing in future policy shifts. If inflation data continues to show resilience, central banks might be compelled to maintain a hawkish stance or even consider further tightening, which would generally be bearish for gold by increasing the opportunity cost of holding non-yielding assets. Conversely, any sign of easing inflation or economic slowdown could prompt rate cut expectations, which would typically be supportive of gold prices. The current data does not provide clear signals on these fronts, leaving gold vulnerable to short-term fluctuations driven by technical factors and immediate geopolitical headlines.
Scenario Analysis: What Lies Ahead for XAUUSD?
Given the conflicting signals across timeframes and the current price action around $4,792.84, a multi-scenario approach is warranted. The prevailing sentiment on shorter timeframes leans bearish, but the longer-term daily chart offers a counter-narrative. This suggests a period of consolidation or a potential turning point could be near.
Bearish Scenario: Testing Deeper Supports
65% ProbabilityNeutral Scenario: Consolidation Around $4,792.84
25% ProbabilityBullish Scenario: Reversal and Upside Momentum
10% ProbabilityThe technical indicators paint a picture of indecision, with shorter-term bearish signals clashing with a potentially more constructive daily outlook. The RSI on the 1-hour chart at 44.9 suggests room to fall, but the daily RSI at 51.27 indicates a more balanced field. MACD on the daily chart showing positive momentum is a key factor that bulls will be watching. The Stochastic on the 1-hour chart is showing a potential buy signal (%K > %D), which could be an early indicator of a shift, though it contradicts the overall bearish sentiment from other indicators on that timeframe. The ADX values across timeframes (27.05 on 1H, 20.42 on 4H, 21.26 on 1D) suggest that while a downtrend might be present, its strength varies, and the daily trend, despite being technically classified as downtrending, shows signs of losing steam.
Considering the broader market context, the volatility in Brent crude oil near $96.53 is a significant factor. If oil prices continue to climb due to escalating geopolitical tensions, particularly around the Strait of Hormuz, this could eventually translate into higher inflation expectations. Such a scenario would typically support gold as an inflation hedge. However, the current price action in gold, testing $4,792.84, suggests that this inflation narrative is not yet fully dominating market sentiment. The strengthening dollar, indicated by the DXY hovering around 98, is likely exerting counteracting pressure. Investors must remain vigilant, balancing the potential safe-haven demand driven by oil volatility against the headwinds from a potentially firming dollar and mixed equity market signals.
The upcoming economic calendar, with key US data releases on retail sales and manufacturing PMIs, will be critical in shaping the next moves. Stronger-than-expected data could bolster the dollar and put further pressure on gold, while weaker data might revive safe-haven demand. The market's interpretation of these figures, in conjunction with any further developments in the geopolitical sphere, will determine whether gold can break its current bearish momentum or succumb to selling pressure. For now, the $4,792.84 level remains the pivotal point. A sustained hold here, coupled with positive daily chart signals, could set the stage for a recovery. However, a decisive break below could signal a deeper correction, targeting the lower daily support levels.
Frequently Asked Questions: XAUUSD Analysis
What happens if XAUUSD breaks below the $4,790.35 support level?
If XAUUSD closes decisively below $4,790.35 on the 1-hour chart, it would invalidate the immediate bullish outlook and likely trigger further downside. This could lead to tests of the $4,783.70 and $4,774.48 support levels, aligning with the bearish scenario.
Should I consider buying XAUUSD at current levels around $4,792.84 given the mixed signals?
Buying at current levels requires careful risk management due to conflicting short-term signals. A more prudent approach might be to wait for confirmation, such as a close above $4,806.22, or a clear break of support accompanied by strong volume, indicating a higher probability trade setup.
Is the RSI at 44.9 on the 1H chart a bearish signal for XAUUSD?
An RSI reading of 44.9 on the 1-hour chart suggests a slight bearish tendency, indicating that momentum is leaning towards sellers. However, it is not yet in oversold territory, so it doesn't automatically signal a buy; confirmation from other indicators or price action is needed.
How will upcoming US Retail Sales data affect XAUUSD this week?
Stronger-than-expected US Retail Sales could boost the dollar and potentially pressure gold prices lower by increasing the attractiveness of dollar-denominated assets. Conversely, weaker data might fuel safe-haven demand for gold, supporting its price.
The path forward for gold hinges on its ability to hold the $4,792.84 level. While shorter-term technicals suggest caution, the longer-term daily chart indicators hint at underlying resilience. The interplay between oil market volatility, dollar strength, and upcoming economic data will be crucial. Traders should maintain a disciplined approach, respecting the key support and resistance levels identified. Patience and a focus on confirmed setups, rather than chasing every short-term fluctuation, will be key to navigating this complex market environment. The market is cyclical, and while current conditions present challenges, opportunities often arise from volatility for those who are prepared.
Technical Outlook Summary
| Indicator | Value | Signal | Interpretation |
|---|---|---|---|
| RSI (14) | 44.9 (1H) / 48.51 (4H) / 51.27 (1D) | Bearish (1H) / Neutral (4H) / Neutral (1D) | Mixed, leaning bearish intraday, neutral to slightly bullish long-term. |
| MACD | Negative (1H/4H) / Positive (1D) | Bearish (1H/4H) / Bullish (1D) | Short-term momentum is down, but daily momentum shows positive signs. |
| Stochastic | K=46.59, D=32.97 (1H) / K=57.61, D=58.39 (4H) / K=70.34, D=76.83 (1D) | Bullish (1H) / Bearish (4H) / Bearish (1D) | Conflicting signals suggest caution; 1H buy signal may be short-lived. |
| ADX | 27.05 (1H) / 20.42 (4H) / 21.26 (1D) | Strong Downtrend / Moderate Downtrend / Moderate Downtrend | Trend strength varies, indicating potential for consolidation or reversal. |
| Bollinger | Middle Band Below (1H/4H) / Above (1D) | Bearish Bias / Bullish Bias | Intraday weakness contrasts with daily bullish inclination. |
Key Levels
Support Levels
Resistance Levels
Track markets in real-time
AI-powered analysis, technical indicators and real-time price data.
Join Our Telegram Channel
Breaking market news, AI analysis and trading signals instantly.
Join Channel