

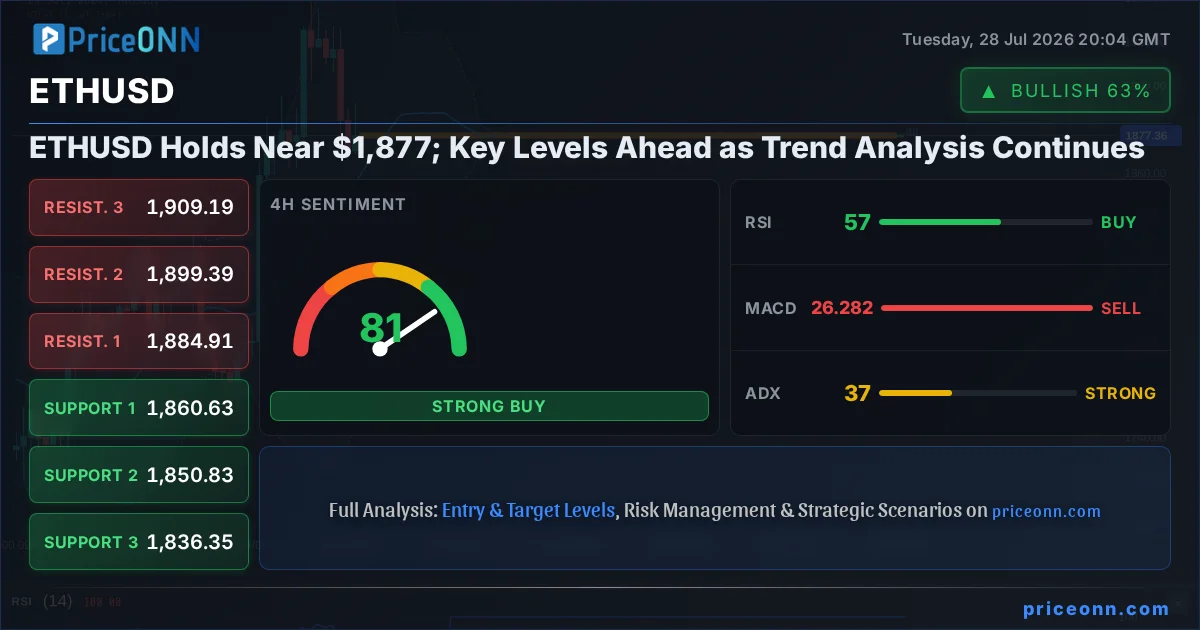
This is where things get interesting. ETHUSD is currently navigating a critical juncture around the $1,877.38 mark, a price point that has seen considerable attention over the past few sessions. After a notable dip, the digital asset is attempting to find its footing, but the path forward is anything but clear. The market sentiment is mixed, with conflicting signals from various technical indicators suggesting a period of consolidation or a potential shift in momentum. Having closely monitored ETHUSD through various market cycles, I see a familiar setup unfolding, one that demands a data-driven approach and a keen eye on risk management. The question on everyone's mind is whether this current price action is a precursor to a significant move or just another bout of choppy trading.
- RSI at 39.48 on the 1H chart signals bearish pressure, with a slight upward lean on higher timeframes.
- Critical support sits at $1,844.84, tested multiple times this week, while resistance looms at $1,915.34.
- The MACD histogram on the 1H chart shows negative momentum, indicating selling pressure is currently dominant.
- The DXY index at 100.70 is rising, potentially correlating with downward pressure on ETHUSD, while SP500's 6572.87 level suggests a mixed risk appetite.
The current technical landscape for ETHUSD presents a complex picture, demanding a multi-timeframe analysis to decipher potential future movements. On the 1-hour chart, ETHUSD is hovering around $1,877.38, exhibiting a neutral trend with a moderate 50% strength. However, the immediate signals lean bearish, with a 'SAT' (Sell) recommendation derived from a mix of indicators. The RSI(14) at 39.48 is firmly in neutral territory but trending downwards, suggesting that while not yet oversold, the bears have a slight edge. The MACD is below its signal line, reinforcing this negative momentum. Bollinger Bands are also showing a downward inclination, with the price trading below the middle band, indicating bearish pressure in the short term. Stochastic, however, offers a conflicting signal, with %K at 43.33 and %D at 59.32, showing a potential for an upward correction, a classic sign of divergence that traders must watch closely.
Adding to the complexity, the ADX at 29.09 indicates a strong downtrend on the 1-hour timeframe. This suggests that any upward movements might be short-lived corrections within a larger bearish structure. The overall signal for the 1-hour timeframe leans towards selling, with 6 'Sell' recommendations versus 2 'Buy' and 0 'Neutral'. This short-term bearish outlook is a crucial piece of the puzzle, especially for scalpers and short-term traders who rely on immediate price action. It paints a picture of cautious sentiment, where immediate opportunities might lie in shorting rallies rather than chasing upside moves, at least until more robust bullish confirmation emerges. The stark contrast between the Stochastic's bullish lean and the overall bearish sentiment from other indicators is a red flag, highlighting the choppiness that can trap unwary traders.
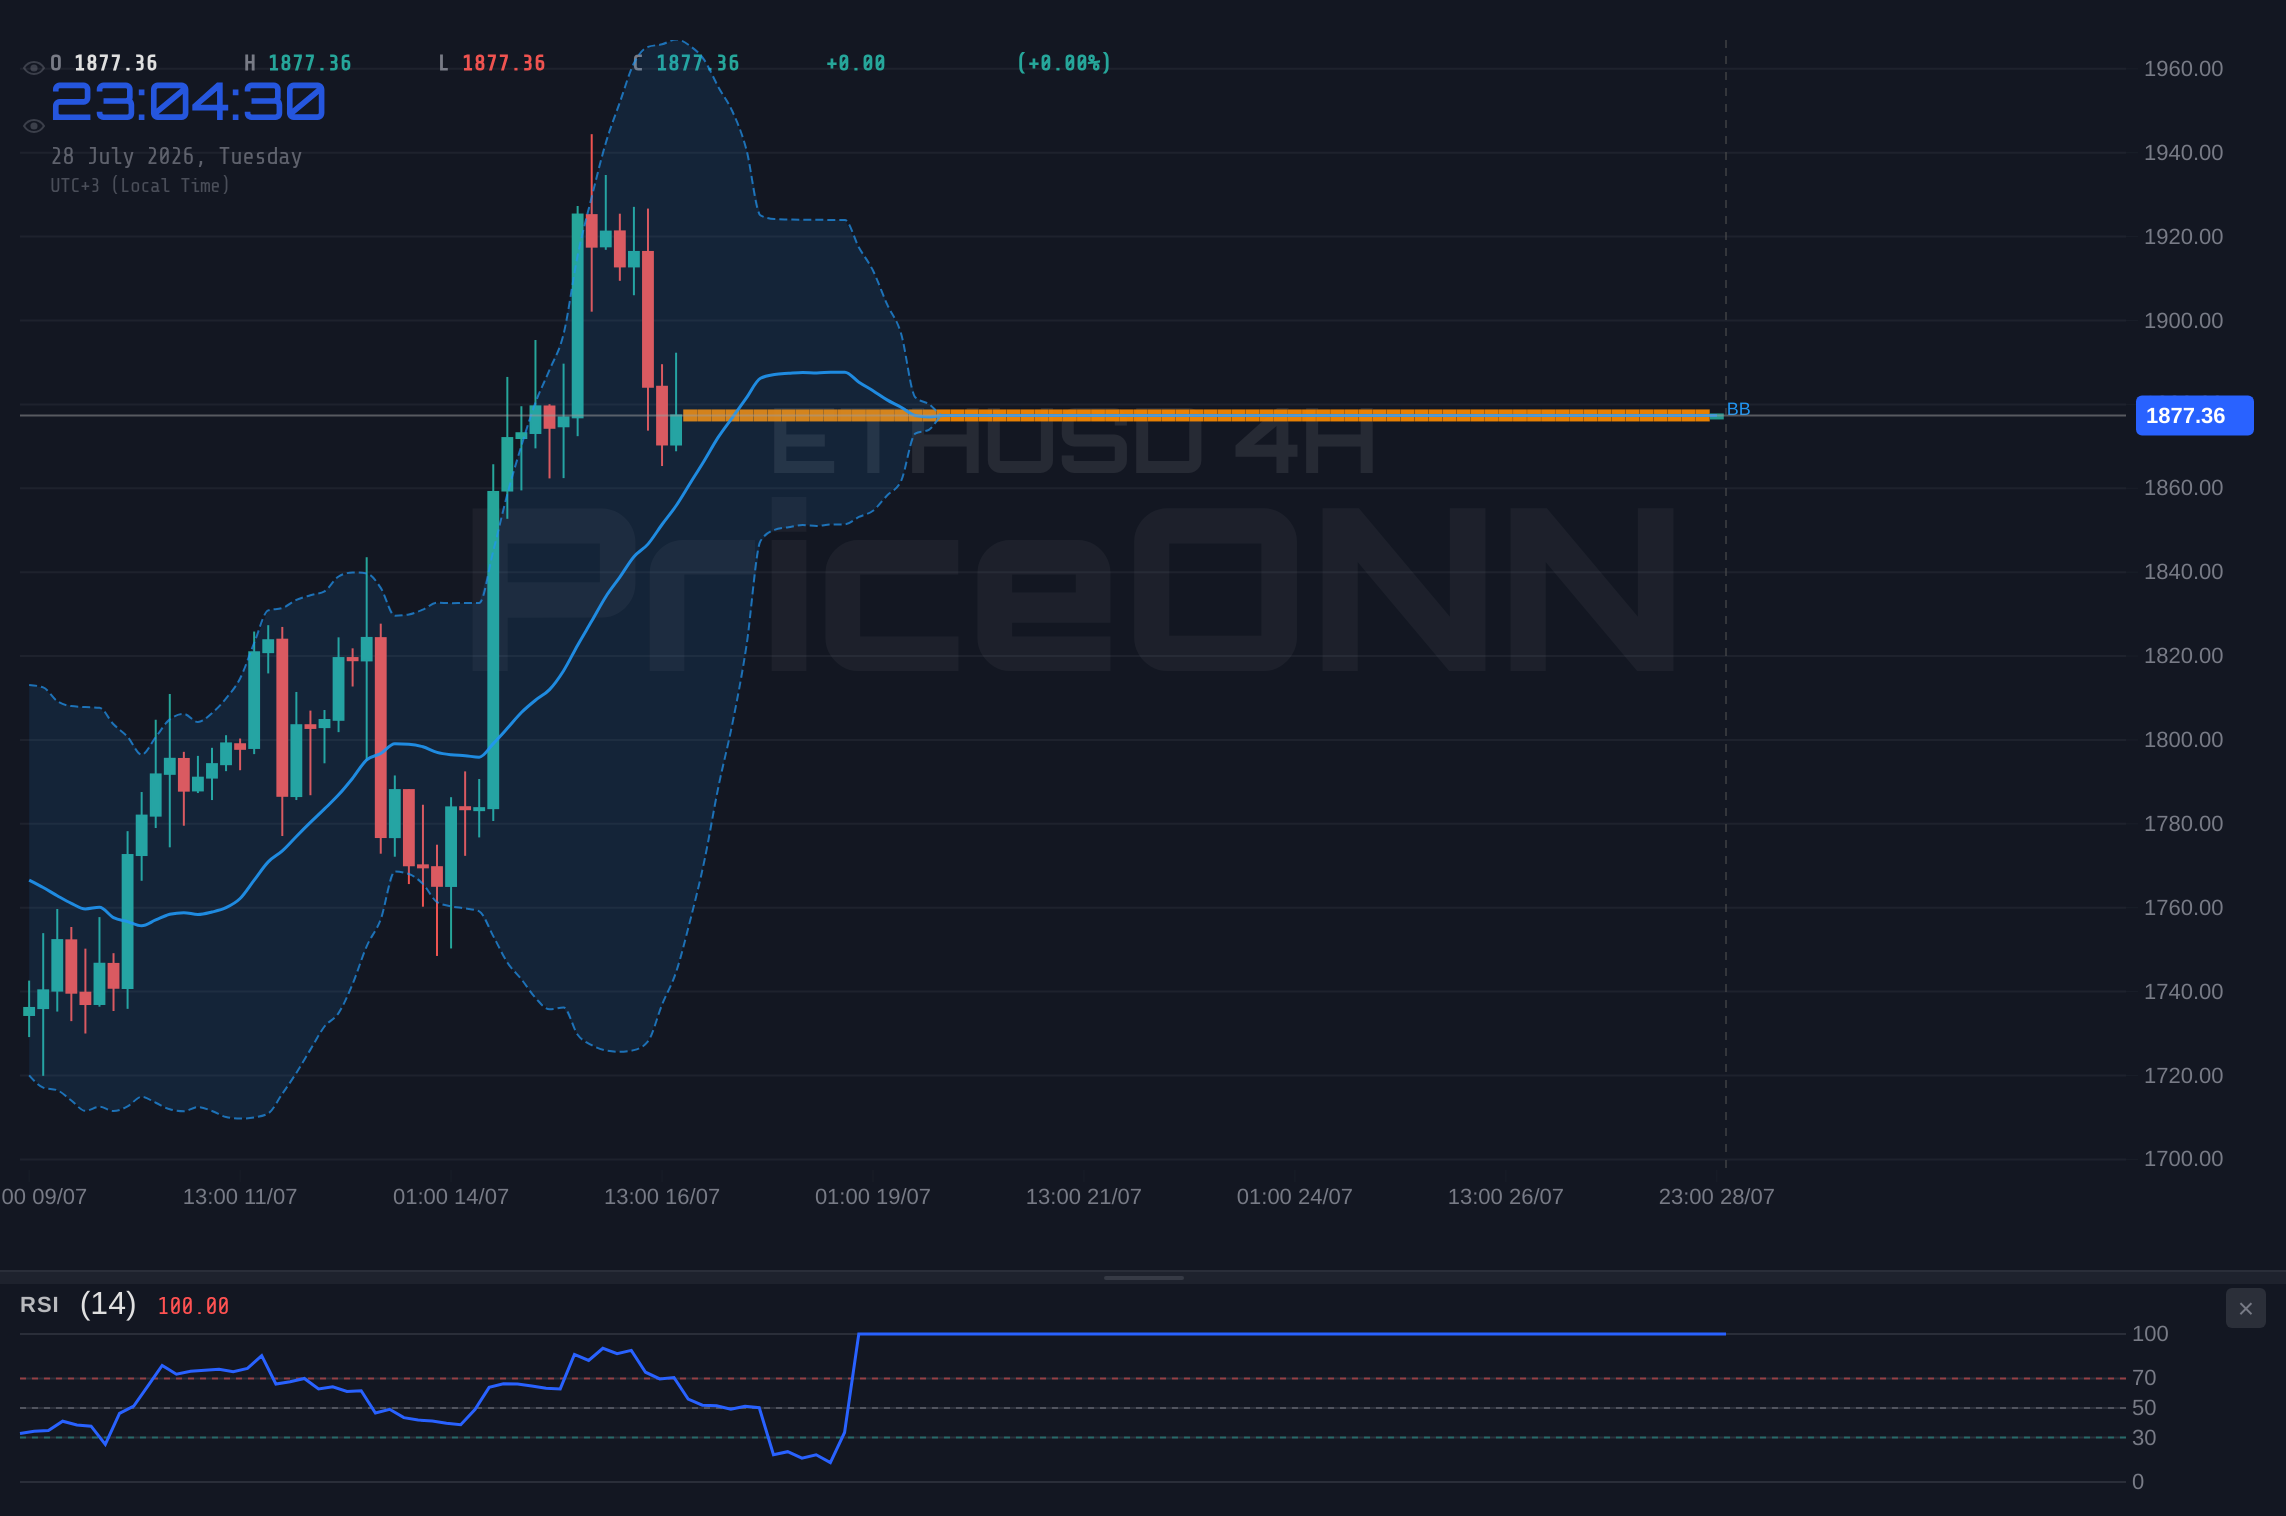
Navigating the Mid-Term: 4-Hour Chart Insights
Shifting our focus to the 4-hour timeframe, the narrative for ETHUSD begins to shift, albeit subtly. Here, the trend is identified as 'Yükseliş' (Bullish) with a significant strength of 94%. This presents a stark contrast to the 1-hour chart and suggests that the longer-term picture might be more optimistic. The support levels are clearly defined at $1,860.63, $1,850.83, and $1,836.35, providing clear zones where buying interest might emerge. Resistance is noted at $1,884.91, $1,899.39, and $1,909.19, forming immediate targets for any potential upward movement. The RSI(14) at 56.88 is comfortably in neutral territory and trending upwards, supporting the bullish outlook.
However, the MACD on the 4-hour chart is currently showing negative momentum, with the MACD line below its signal line. This is a discordant note in the otherwise bullish symphony, indicating that the immediate selling pressure seen on the hourly chart might still be exerting influence. The Bollinger Bands are positioned above the middle band, which aligns with the bullish trend. Stochastic, though, is showing a bearish signal with %K at 18.24 and %D at 57.76, indicating an oversold condition that could precede a bounce. This conflict between the overall trend and specific indicator readings is what defines a healthy market dynamic, offering opportunities for those who can navigate the nuances. The ADX at 37.06 confirms a strong uptrend, reinforcing the bullish bias of this timeframe. The overall signal here is 'AL' (Buy), with 5 'Buy' recommendations against 3 'Sell' and 0 'Neutral', suggesting that while short-term headwinds exist, the medium-term trend remains upward.
The Daily Perspective: Long-Term Trend and Macro Correlations
Examining the daily chart for ETHUSD reveals a more established bullish trend, with a strength of 86%. This longer-term perspective is crucial for understanding the broader market sentiment and the potential for sustained price appreciation. The identified support levels at $1,874.22, $1,827.25, and $1,792.15 are significant, representing areas where substantial buying pressure has historically surfaced. Conversely, resistance is stacked up at $1,956.29, $1,991.39, and $1,909.19, acting as potential ceilings for any significant rally. The RSI(14) reading of 59.95 is in the upper half of the neutral zone and trending upwards, suggesting ample room for further gains before reaching overbought territory.
The MACD on the daily chart is displaying positive momentum, with the MACD line above its signal line, further bolstering the bullish case. The Bollinger Bands are also above the middle band, reinforcing the prevailing uptrend. Stochastic is showing a strong bullish signal, with %K at 84.55 and %D at 79.73, indicating that the market is in overbought territory. This is a key observation; while it confirms the strength of the uptrend, it also raises a flag for potential pullbacks or consolidations as profit-taking might occur. The ADX at 22.66 indicates a moderately strong uptrend, which is healthy for sustained price movement. The overall signal for the daily timeframe is 'AL' (Buy), with 7 'Buy' recommendations against 1 'Sell'. This strong daily trend, despite potential short-term fluctuations, suggests that the underlying sentiment remains bullish for ETHUSD.
Correlating these movements with broader market indicators provides essential context. The DXY, or Dollar Index, is currently at 100.70 and showing a rising trend on the 1-hour chart, which typically exerts downward pressure on risk assets like ETHUSD. However, on the daily timeframe, the DXY is neutral, suggesting its influence might be more localized to shorter timeframes. The SP500 is trading at 6572.87, showing a strong upward trend on the 1-hour and 4-hour charts, but a bearish signal on the daily. This mixed picture in equities suggests that risk appetite is not uniformly strong across all timeframes, which could translate into volatility for cryptocurrencies. The Nasdaq100, trading at 29164.86, is showing a predominantly bearish trend across all timeframes, which is a more concerning sign for risk assets. This divergence between SP500 and Nasdaq, coupled with a rising DXY on shorter timeframes, adds a layer of caution to the bullish outlook derived from ETHUSD's own daily chart. It implies that external macro factors are creating headwinds that could potentially derail the crypto asset's upward trajectory, especially in the short to medium term.
Navigating the Volatility: Key Levels and Trader Psychology
The immediate price action around $1,877.38 is critical. On the 1-hour chart, the support at $1,844.84 has been tested, and a close below this level could signal a more significant downturn, potentially targeting the next support at $1,827.25 on the daily chart. Conversely, breaking through the immediate resistance at $1,891.84 on the 1-hour chart would be the first step towards validating the bullish sentiment seen on higher timeframes. If ETHUSD can decisively clear $1,909.19, it would set the stage for a more substantial rally towards the daily resistance at $1,956.29. The psychological aspect is also significant; a sustained hold above $1,877.38 could build confidence, while a sharp drop below it might trigger panic selling.
This interplay between technical levels and trader psychology is where opportunities and risks are most pronounced. The fact that the daily RSI is still below 60, despite the bullish trend, suggests that there is still room for growth before the market becomes overheated. However, the overbought Stochastic on the daily chart (K=84.55, D=79.73) warrants caution. This divergence, where price is trending up but momentum indicators are showing signs of topping out, often precedes a period of consolidation or a sharp correction. Traders must be mindful of this potential for a reversal. The ADX values across timeframes also tell a story: strong on the 1-hour and 4-hour, but weaker on the daily. This suggests that while short-term trends are well-defined, the long-term conviction might be wavering, or perhaps building towards a larger move.
Scenario Analysis: Mapping Potential Paths for ETHUSD
Given the conflicting signals and the current market positioning, it's prudent to map out potential scenarios. The prevailing trend on the daily chart is bullish, supported by strong MACD and RSI readings, but short-term indicators and external macro factors introduce significant uncertainty. This is where probabilities become our best guide.
Bearish Scenario: Short-Term Pressure Mounts
65% ProbabilityNeutral Scenario: Consolidation Around $1,877
25% ProbabilityBullish Scenario: Daily Trend Reasserts Itself
10% ProbabilityThe bearish scenario holds the highest probability due to the short-term downward pressure, conflicting indicator signals on higher timeframes, and potential macro headwinds like a rising DXY and bearish Nasdaq. A break below the $1,844.84 support level would likely trigger further selling, exacerbated by the strong ADX on the 1-hour chart. The neutral scenario anticipates a period of sideways movement as the market digests the conflicting signals and waits for clearer direction, potentially driven by upcoming economic data or news events. The bullish scenario, while having the lowest probability currently, remains a possibility if the daily trend strength can overcome short-term selling pressure and external macro concerns. This would require a decisive break above key hourly and 4-hour resistance levels.
The Role of External Factors: DXY, Equities, and Oil
The correlation analysis is crucial here. The DXY's rise to 100.70 on the 1-hour chart is a significant factor. Historically, a stronger dollar often correlates with lower prices for risk assets like ETHUSD. This puts immediate pressure on the cryptocurrency. However, the DXY's neutral stance on the daily chart suggests this effect might be temporary or confined to shorter trading sessions. The equity markets present a mixed bag. The SP500's upward momentum on shorter timeframes could offer some support, but the bearish trend on the daily chart, coupled with the Nasdaq100's pronounced weakness across all timeframes, signals a broader risk-off sentiment in the tech sector. This risk-off environment is generally unfavorable for cryptocurrencies, which are often seen as higher-risk assets. Even oil prices, trading at $83.79 for Brent and $79.59 for WTI, are showing a slight downtrend, which could imply easing inflation concerns, but the geopolitical context surrounding energy markets remains a wildcard that could quickly shift sentiment and impact broader market risk appetite.
The recent news flow, particularly the report about Nvidia's drop triggering a broad Asian tech selloff due to financing fears, underscores the sensitivity of tech-related assets and, by extension, cryptocurrencies to financial system stability and investor confidence. While not directly about ETHUSD, this sentiment can easily spill over. Similarly, the tightening monetary policy in Singapore due to rising oil prices, though localized, hints at the persistent inflation risks globally that central banks are trying to manage. This ongoing battle between inflation and monetary tightening is a backdrop against which all risk assets, including ETHUSD, must perform. The Federal Reserve's stance, implied by the DXY's movements and the broader market's reaction to economic data like consumer confidence, remains a key determinant of risk appetite.
Expert View: What We're Watching Next
From my perspective as a market analyst who has navigated multiple cycles, the current ETHUSD setup is one of caution mixed with strategic opportunity. The daily trend remains bullish, which is encouraging for longer-term holders. However, the short-term bearish signals, conflicting indicators, and the broader macro environment - characterized by a strong dollar and weak tech stocks - demand respect. This is not a time for aggressive long positions without clear confirmation. Instead, it's a period for careful observation and risk management. Traders should be looking for clear breaks of key levels: a decisive close above $1,891.84 could signal a resumption of the bullish trend, while a fall below $1,844.84 might indicate a deeper correction. The $1,877.38 level itself acts as a psychological pivot. Holding it could maintain short-term optimism, but breaking it could accelerate selling pressure.
The key takeaway is that while the long-term ETHUSD trend is positive, the short-term technicals and macro correlations suggest a high probability of further choppiness or a downside move before any significant upward continuation. Patience will be rewarded. Waiting for clearer signals, such as a confirmed breakout above resistance with increasing volume or a bounce from strong support levels with bullish divergence, is paramount. For those looking to enter positions, scaling in cautiously or waiting for a confirmed trend shift would be prudent strategies. The market is always giving a second chance, and forcing a trade in uncertain conditions often leads to unnecessary losses. Focus on risk management, and let the price action guide your decisions.
Frequently Asked Questions: ETHUSD Analysis
What happens if ETHUSD breaks below the $1,844.84 support level?
If ETHUSD closes decisively below the $1,844.84 support level on the 1-hour chart, it would invalidate the immediate bullish bias and likely trigger further selling pressure. This could lead to a test of the next daily support at $1,827.25, especially if broader market sentiment remains risk-off.
Should I buy ETHUSD at current levels of $1,877.38 given the mixed signals?
Buying at $1,877.38 carries significant risk due to conflicting short-term bearish indicators and macro headwinds. A more prudent approach would be to wait for confirmation, such as a clear break above $1,891.84 resistance with increasing volume, or a strong bounce from the $1,844.84 support level accompanied by bullish divergence.
Is the RSI at 39.48 a sell signal for ETHUSD right now?
An RSI of 39.48 on the 1-hour chart is in neutral territory but trending downwards, indicating bearish pressure rather than an immediate sell signal. While it suggests caution, it's not a definitive sell signal on its own. Confirmation from other indicators like MACD and price action breaking below key support would be needed for a strong bearish conviction.
How will the rising DXY at 100.70 affect ETHUSD this week?
A rising DXY, especially on shorter timeframes, typically exerts downward pressure on risk assets like ETHUSD. This correlation suggests that current dollar strength could contribute to short-term weakness or consolidation in ETHUSD, potentially hindering upward momentum until the dollar's trend changes or ETHUSD shows significant decoupling.
Track markets in real-time
AI-powered analysis, technical indicators and real-time price data.
Join Our Telegram Channel
Breaking market news, AI analysis and trading signals instantly.
Join Channel