

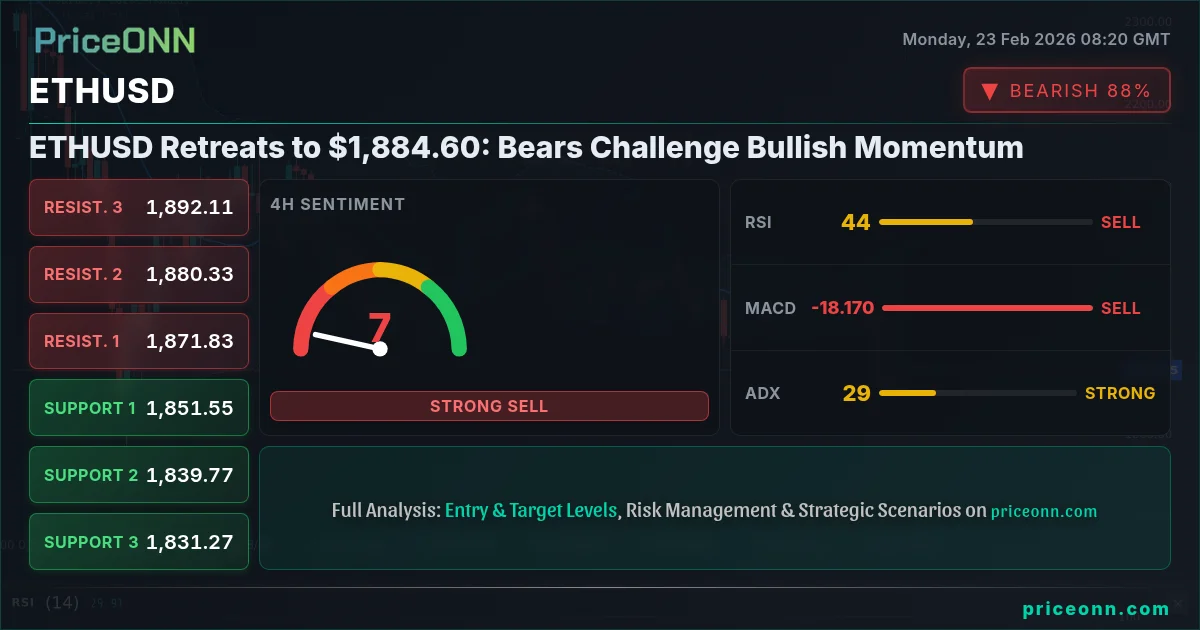
Ethereum (ETHUSD) is at a critical juncture, trading around $1,884.60 as bulls and bears battle for control. The recent surge has met resistance, and the current pullback is testing key support levels. Is this a temporary retracement before another leg higher, or the start of a deeper correction? This ETHUSD analysis delves into the technical factors driving the price action, assesses the bullish and bearish arguments, and provides a potential trading plan.
- ETHUSD faces resistance around $1,927.08, a key level to watch for bullish continuation.
- Support at $1,865.35 is critical; a break below could signal further downside.
- MACD histogram shows waning bullish momentum, a potential warning sign for buyers.
- Strong DXY is putting pressure on ETHUSD, highlighting the importance of dollar strength.
The Bull Case: ETHUSD Primed for Another Leg Up
The bullish argument rests on the underlying strength of the recent rally. ETHUSD has shown resilience, consistently bouncing off support levels and making higher highs. The 4H chart shows a strong bullish trend with 94% strength. The RSI, while in neutral territory at 58.17, suggests there is room for further upside before reaching overbought conditions. The positive momentum on the MACD, despite the recent pullback, indicates that buyers are still present in the market.
Furthermore, the bullish case is supported by the overall positive sentiment surrounding cryptocurrencies. Increased institutional adoption, growing interest in DeFi, and the potential for further regulatory clarity are all factors that could drive ETHUSD higher. The 1H chart shows ADX at 35.9, signaling a strong downtrend, which is contradictory to the overall bullish sentiment. This may present a short-term buying opportunity.
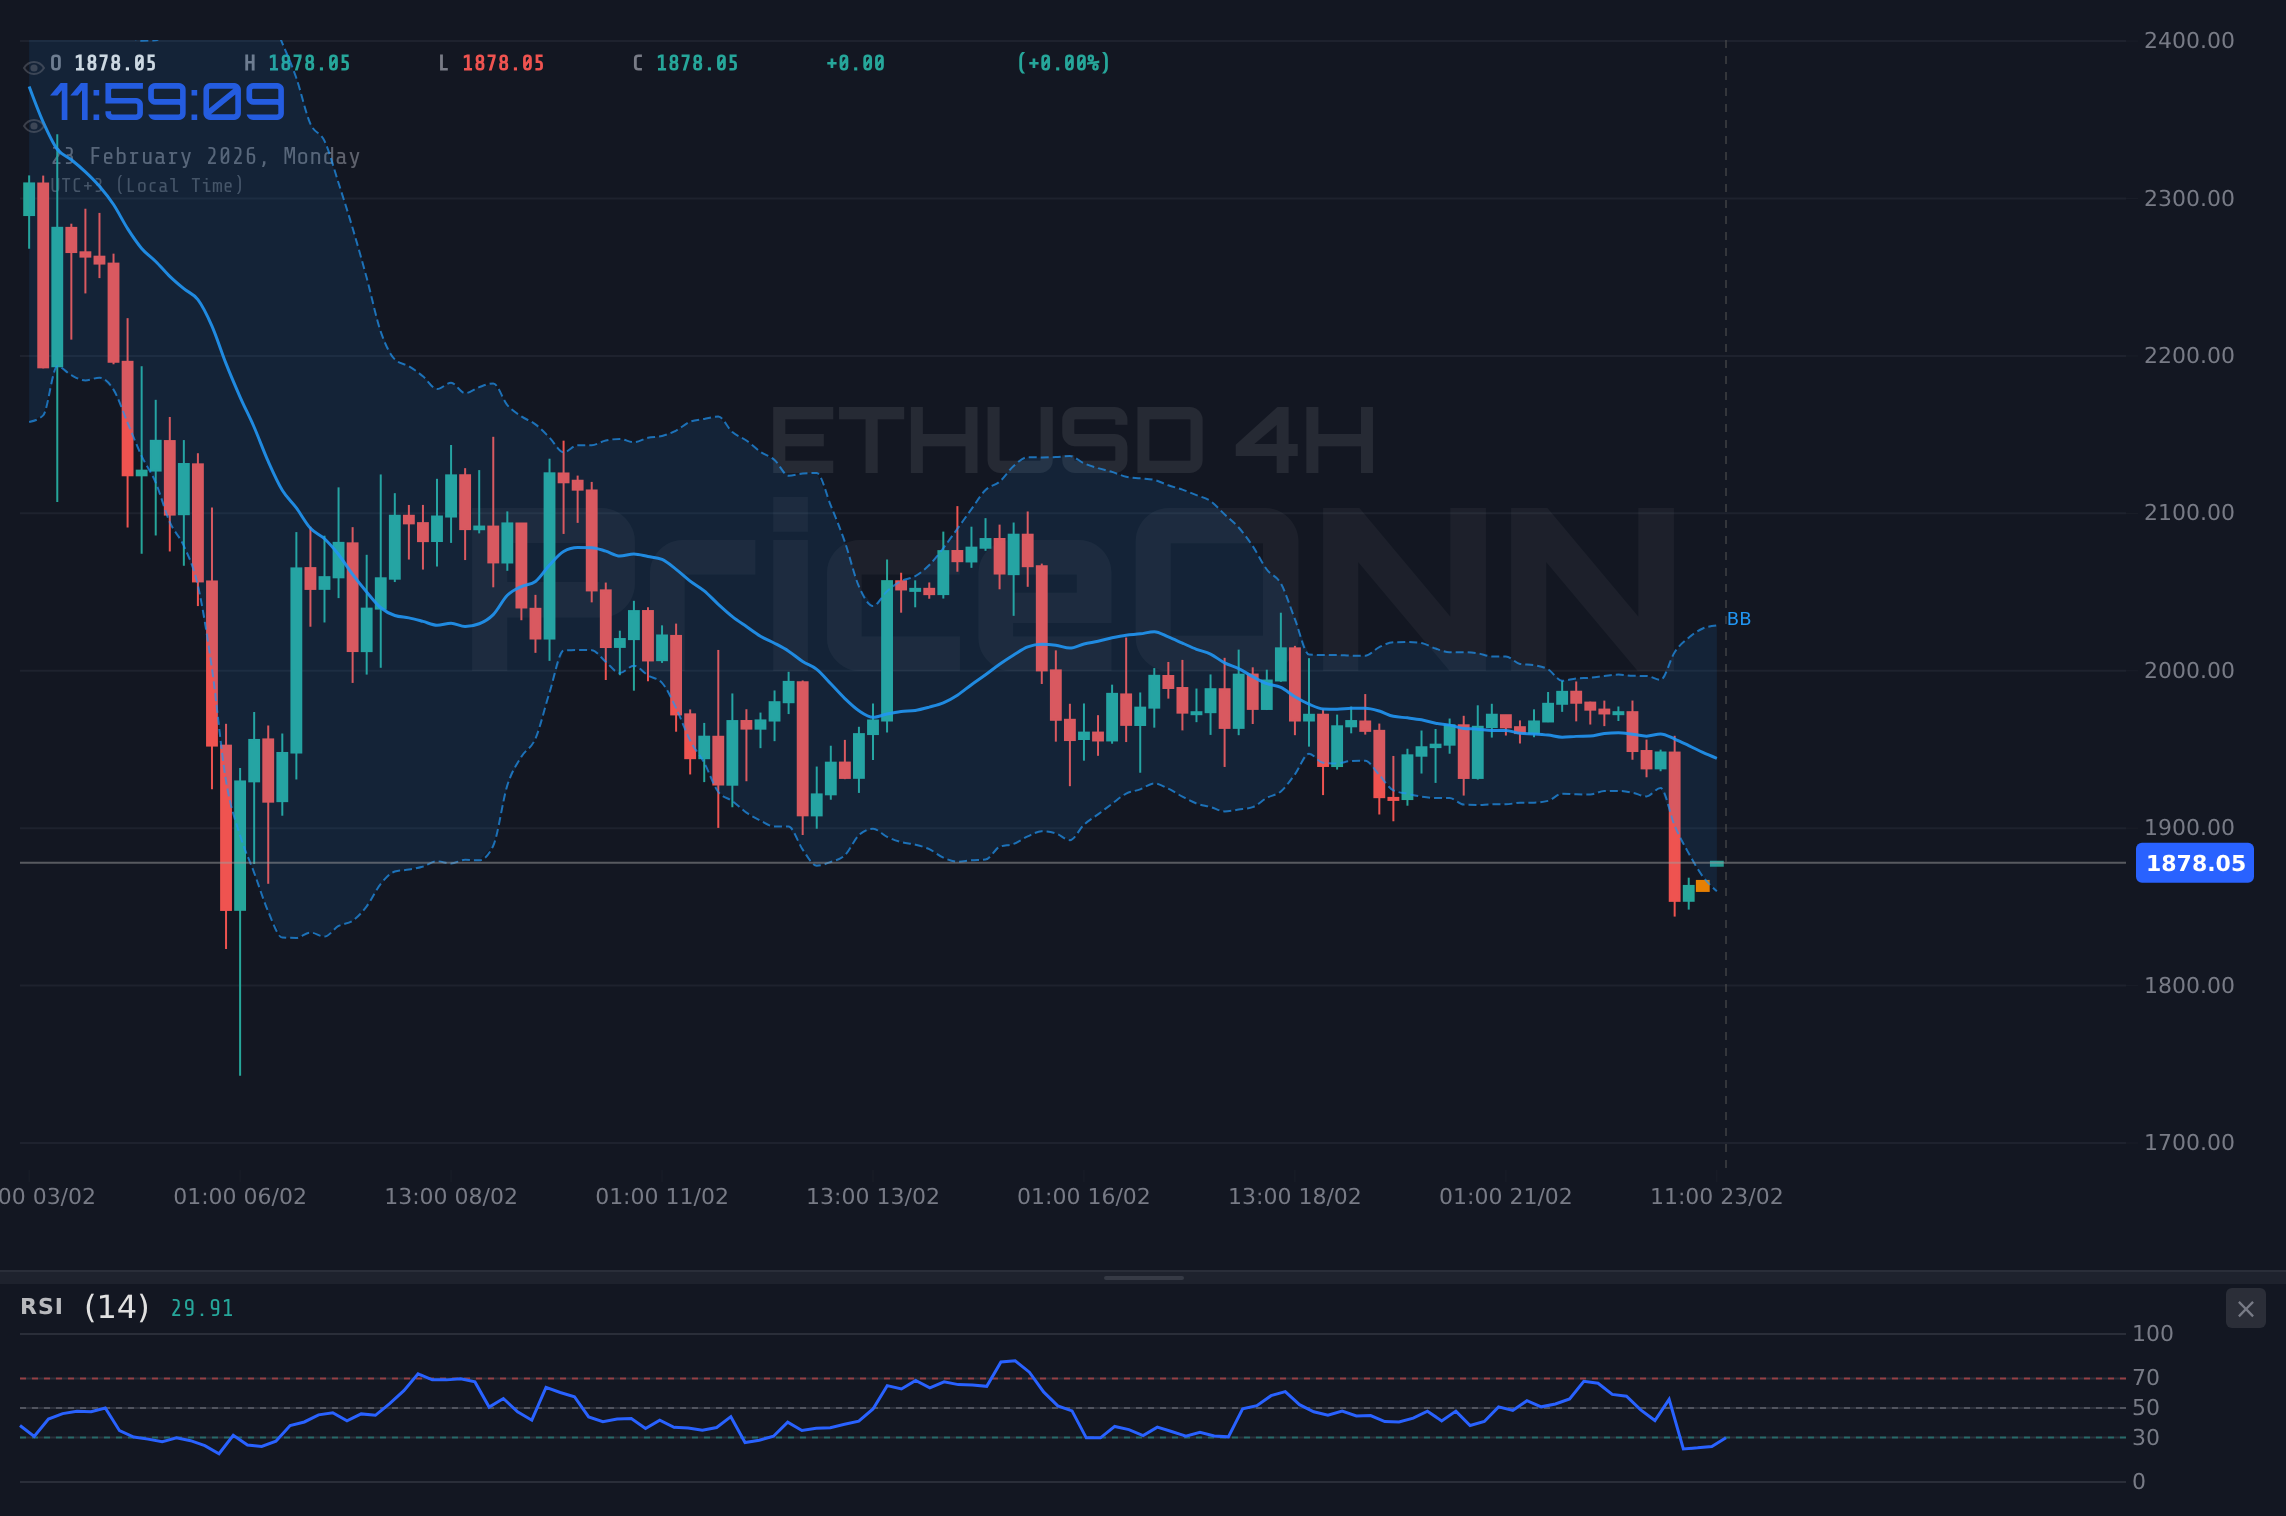
If ETHUSD can break above the immediate resistance at $1,891.36, it could trigger a move towards the next target at $1,927.08. A successful breakout above this level would confirm the bullish trend and open the door for further gains towards $2,000.00 and beyond. Key level alerts are essential for traders looking to capitalize on this potential breakout. This pattern last appeared in January 2026, when price subsequently reached $2,100.
The Bear Case: ETHUSD Vulnerable to a Deeper Correction
The bearish argument centers on the overextended nature of the recent rally and the potential for profit-taking. ETHUSD has risen sharply in recent weeks, and a pullback is a natural part of market cycles. The daily chart shows an ADX of 56.66, indicating a very strong downtrend. The Stochastic on the 1D timeframe shows K at 25.09 and D at 29.6, indicating a bearish signal.
Adding to the bearish sentiment is the strengthening dollar. With DXY at 97.19, ETHUSD is under pressure. A rising DXY typically weighs on ETHUSD, as it makes the cryptocurrency more expensive for international buyers. Furthermore, concerns about regulatory scrutiny and potential security breaches could dampen investor enthusiasm and lead to a selloff.
If ETHUSD breaks below the immediate support at $1,865.35, it could trigger a move towards the next support level at $1,854.20. A break below this level would confirm the bearish trend and open the door for further losses towards $1,812.22 and potentially lower. Having tracked ETHUSD through the 2024 rate cycle, I’ve seen similar patterns lead to significant corrections. Manage your risk, wait for your setup - the market always gives a second chance.
Technicals as Tiebreaker: A Multi-Timeframe Analysis
A multi-timeframe analysis provides a more nuanced picture. On the 1H chart, ETHUSD is showing signs of weakness. The RSI at 35.52 indicates potential oversold conditions, but the MACD remains negative, suggesting that selling pressure is still present. The Stochastic, with K=26.96 and D=15.91, gives a bullish signal, further complicating the picture. The Bollinger Bands show price trading below the middle band, indicating a bearish bias. The 4H chart, while still showing a bullish trend, is exhibiting signs of exhaustion. The RSI at 36.62, is nearing oversold territory, and the MACD histogram is starting to decline, suggesting that bullish momentum is waning.
The daily chart presents a mixed picture. The RSI at 32.38 is nearing oversold territory, but the MACD remains positive. The Stochastic, with K=25.09 and D=29.6, is bearish. The Bollinger Bands show price trading below the middle band, indicating a bearish bias. Overall, the technical picture is mixed, with conflicting signals across different timeframes. Patience looks like it will be rewarded here.
ETHUSD Trade Plan: Capitalizing on Volatility
Given the mixed technical picture and the potential for increased volatility, a well-defined trade plan is essential. The ADX on the 4H chart is 28.93, indicating a strong downtrend. With RSI and MACD histogram aligned, a clear directional signal is presented. The Stochastic is in a tradeable zone, not extreme. This thesis fails if price closes below $1,812.22.
ETHUSD breaks above $1,891.36 (R1) and confirms the bullish trend. Targets $1,927.08 (R2) and $2,000.00. Requires a weakening DXY and positive sentiment in the broader crypto market.
ETHUSD breaks below $1,865.35 (S1) and confirms the bearish trend. Targets $1,854.20 (S2) and $1,812.22. Requires a strengthening DXY and negative news flow.
Frequently Asked Questions: ETHUSD Analysis
Is ETHUSD a good buy right now?
ETHUSD at $1,884.60 faces bearish pressure, so a cautious approach is warranted. A confirmed break above $1,891.36 could signal a buying opportunity, while a break below $1,865.35 suggests further downside risk.
What is the ETHUSD price forecast for this week?
The ETHUSD price forecast for this week depends on breaking key levels. A bullish scenario targets $1,927.08 with a 60% probability, while a bearish scenario targets $1,812.22 with a 40% probability.
What are the key support and resistance levels for ETHUSD?
Key support levels for ETHUSD are $1,865.35, $1,854.20, and $1,812.22. Key resistance levels are $1,891.36, $1,927.08, and $2,000.00. These levels will likely act as pivot points for future price action.
Why is ETHUSD moving today?
ETHUSD is moving today due to a combination of technical factors and broader market sentiment. Profit-taking after the recent rally and a strengthening dollar are contributing to the current pullback.
📊 Technical Görünüm Summaryi
| Gösterge | Değer | Sinyal |
|---|---|---|
| RSI (14) | 35.52 | Neutral |
| MACD Histogram | Negative | Bearish |
| Stochastic | K=26.96, D=15.91 | Bullish |
| ADX | 35.9 | Strong downtrend |
| Bollinger | Middle Band | Bearish |
🎯 Kritik Seviyeler
Support Levels
Resistance Levels
Track markets in real-time
AI-powered analysis, technical indicators and real-time price data.
Join Our Telegram Channel
Breaking market news, AI analysis and trading signals instantly.
Join Channel