

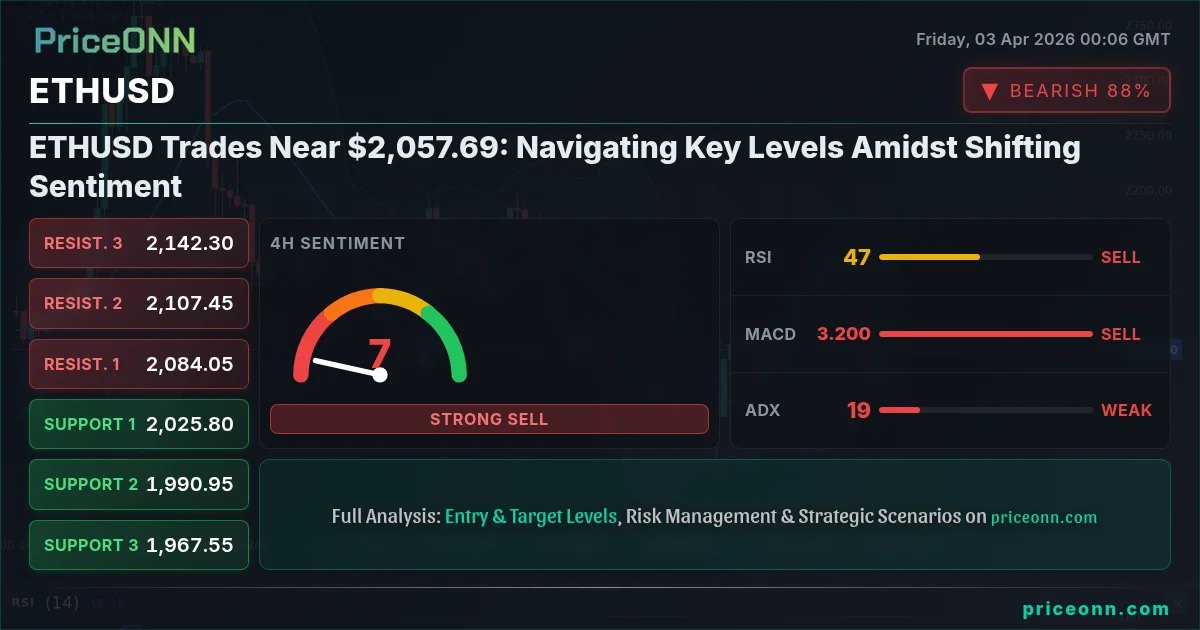
The cryptocurrency market is currently navigating a complex landscape, with ETHUSD finding itself at a pivotal juncture near the $2,057.69 mark. This price point, while seemingly stable in the short term, belies a swirling mix of technical indicators and underlying market forces that demand close attention. As traders and investors alike scrutinize the charts, the question on everyone's mind is whether ETHUSD is poised for a decisive move, and in which direction. The interplay between the strengthening US Dollar Index (DXY), the mixed signals from various timeframes, and the ever-present crypto-specific fundamentals creates a challenging, yet potentially rewarding, environment for those looking to capitalize on market movements.
- ETHUSD is trading near $2,057.69, with a daily change of -3.9% (-$83.41).
- On the 1-hour chart, RSI is at 49.05, indicating a slight bearish trend, while the 4-hour chart shows RSI at 46.4, also suggesting downward pressure.
- Critical support levels are identified at $2,051.90 (1H) and $2,025.80 (4H), while resistance looms around $2,063.06 (1H) and $2,084.05 (4H).
- The DXY is showing strength, trading at 99.81 and exhibiting a bullish trend on the daily chart, which typically correlates with pressure on risk assets like ETHUSD.
The current price action for ETHUSD, hovering around $2,057.69, presents a fascinating case study in market indecision. While the 1-hour chart signals a neutral trend with a slight bearish inclination due to an RSI of 49.05, the 4-hour timeframe echoes this sentiment with an RSI of 46.4. This suggests that while there isn't a strong conviction for a reversal yet, the bears are certainly holding some ground. The MACD on both the 1H and 4H charts indicates positive momentum on the 1H, but negative momentum on the 4H, creating a divergence that traders often interpret as a potential turning point or a period of consolidation before the next significant move.
Adding to the complexity, the Stochastic Oscillator provides conflicting signals across different timeframes. On the 1-hour chart, it shows a slight bearish signal (%K
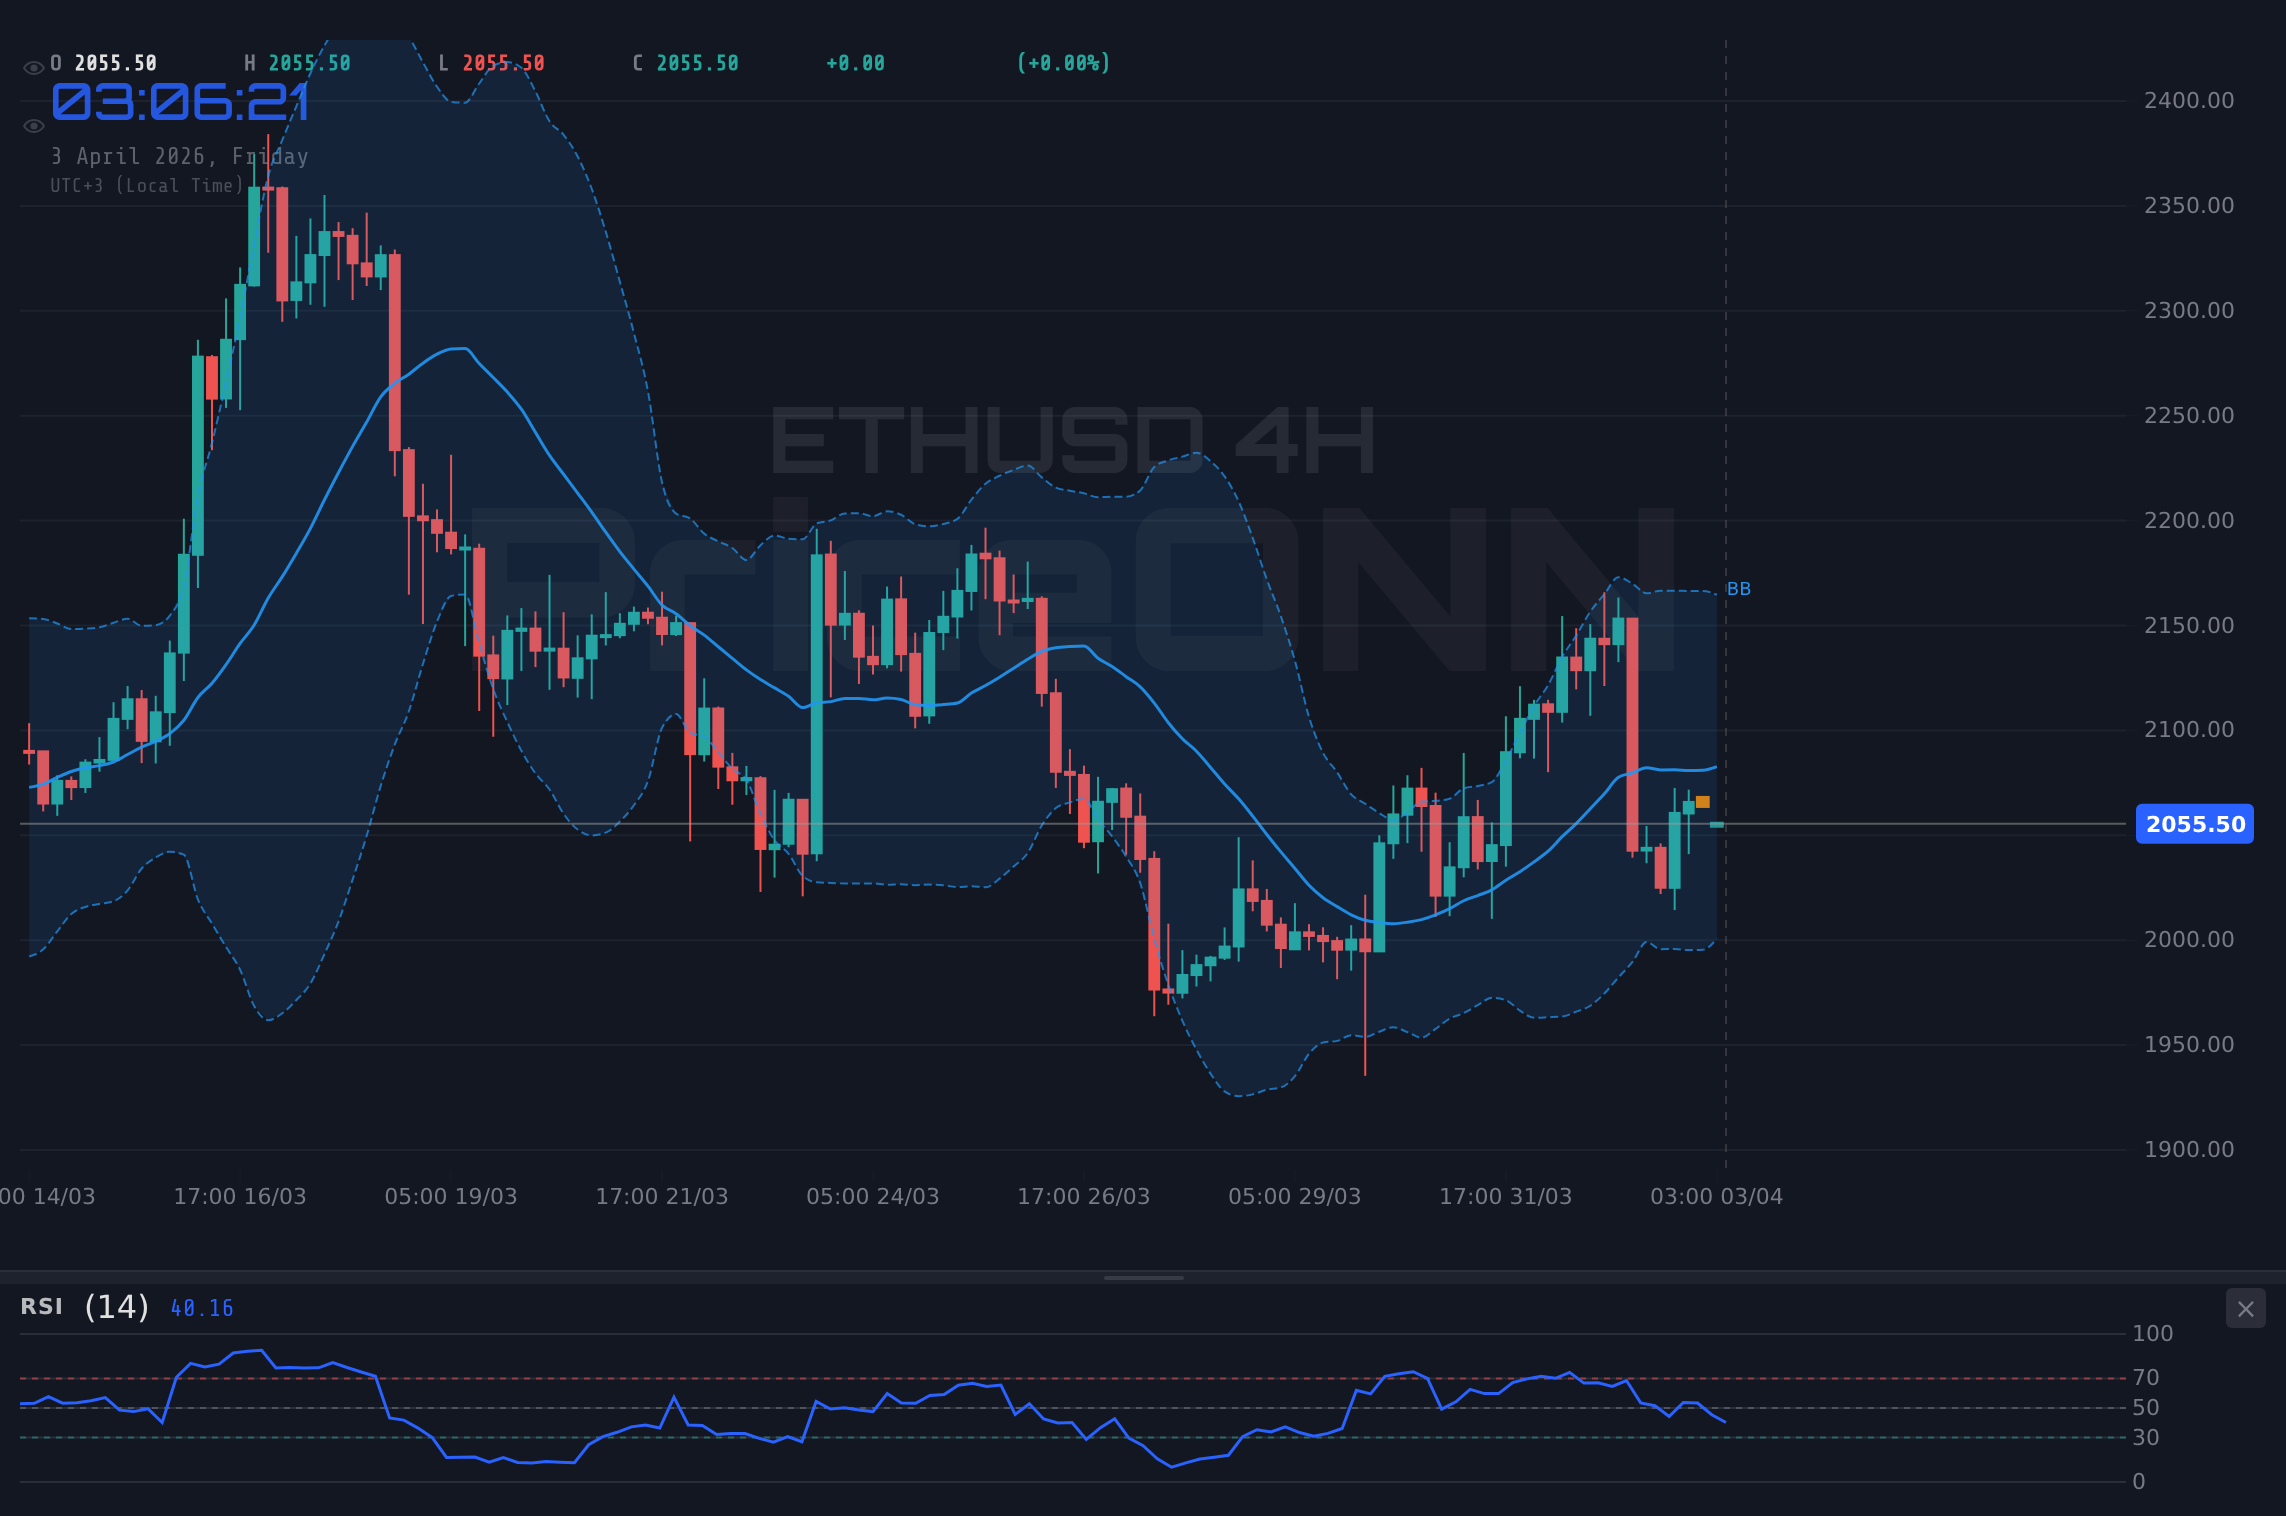
The economic context cannot be ignored, especially the performance of the US Dollar Index (DXY). Currently trading at 99.81 and showing a strong bullish trend on the daily chart, the DXY's strength typically exerts downward pressure on risk assets like ETHUSD. When the dollar strengthens, it becomes more expensive for holders of other currencies to purchase dollar-denominated assets, potentially dampening demand. The correlation between DXY and ETHUSD, while not always perfect, is a significant factor that analysts are watching closely. A sustained rise in the DXY could foreshadow further declines in ETHUSD, especially if other risk assets also begin to falter.
Looking at the immediate technical landscape, the 1-hour chart presents resistance at $2,063.06, $2,068.44, and $2,074.22. A decisive break above these levels would be necessary to shift the short-term sentiment. Conversely, immediate support is found at $2,051.90, $2,046.12, and $2,040.74. The 4-hour chart offers a slightly different perspective, with resistance at $2,084.05, $2,107.45, and $2,142.30. Support on this timeframe is seen at $2,025.80, $1,990.95, and $1,967.55. The fact that the 1-hour chart's resistance is close to the current price, while the 4-hour support is further down, suggests a potential for a short-term pullback before any significant upward movement could be considered.
The daily chart for ETHUSD paints a picture of indecision, with a neutral trend and a falling RSI (43.46), indicating a downward bias but not yet oversold territory. The MACD is showing negative momentum, and Bollinger Bands are below the middle band, both suggesting a bearish inclination. However, the Stochastic Oscillator on the daily chart provides a bullish signal, hinting at potential oversold conditions. This divergence between the RSI/MACD and the Stochastic on the daily timeframe is a classic sign of market uncertainty, where traders are looking for a catalyst to break the stalemate. The ADX at 18.66 further confirms the lack of a strong trend, suggesting that the market is consolidating rather than trending.
When we delve deeper into the crypto-specific fundamentals, the picture becomes even more nuanced. On-chain metrics, such as active addresses and whale movements, can offer clues about underlying network health and investor sentiment. A declining number of active addresses might suggest waning interest, while significant whale movements could signal accumulation or distribution phases. Exchange flows are also critical; large outflows from exchanges can indicate a belief in long-term holding (HODLing), while inflows might suggest selling pressure is building. Currently, without specific on-chain data for ETHUSD, we must rely on technicals and broader market correlations, but these fundamental aspects are crucial for a comprehensive view.
Developments in the DeFi and NFT ecosystems also play a vital role in ETHUSD's valuation. The total value locked (TVL) in Ethereum-based DeFi protocols, staking yields, and the overall activity in NFT marketplaces can influence demand for ETH. A growing TVL and robust staking yields often signal confidence in the Ethereum network, potentially boosting ETH prices. Conversely, a decline in these metrics, perhaps due to higher gas fees or a general market downturn, can weigh on ETH. The recent news about a new DeFi protocol, Altura, offering tokenized gold arbitrage with potential 20% yields, highlights the innovation within the DeFi space, though its direct impact on ETHUSD requires further observation.
Regulatory news continues to be a significant overhang for the entire cryptocurrency market. Any hint of stricter regulations or, conversely, clearer regulatory frameworks, can send ripples through asset prices. The French blockchain stock exchange, Lise, planning its first on-chain IPO, signifies increasing institutional interest in blockchain technology, which could indirectly benefit ETH as a major smart contract platform. However, the market remains sensitive to any regulatory pronouncements from major economies, particularly the US, where discussions around stablecoins and DeFi oversight are ongoing. The current geopolitical tensions, as highlighted by the news regarding Trump's speech and Middle East concerns, can also indirectly impact risk assets like cryptocurrencies by influencing investor sentiment and capital flows.
The correlation with Bitcoin (BTCUSD) is another fundamental pillar for ETHUSD analysis. As the largest cryptocurrency, Bitcoin often dictates the overall direction of the altcoin market. ETHUSD typically moves in tandem with BTCUSD, although its volatility can be amplified. With BTCUSD currently trading near $66,998 and showing a bearish trend on the 4-hour chart, this downward pressure on Bitcoin could be contributing to the weakness seen in ETHUSD. The general crypto market sentiment, influenced by both macro factors and crypto-specific news, is therefore a crucial element in understanding ETHUSD's potential trajectory.
Given the conflicting signals and the current market environment, a clear directional trade setup for ETHUSD is not yet apparent. The 'WATCH_ZONE' classification is appropriate, suggesting a period of observation and waiting for confirmation. A daily close above the nearest resistance level on the 1-hour chart, which is $2,063.06, would be the initial sign of strengthening bullish momentum. However, this would need to be sustained and ideally accompanied by increasing volume and a more positive confluence of indicators across multiple timeframes. Until such a breakout occurs and holds, caution is advised, and risk management should be paramount.
The key level to watch for ETHUSD is the $2,051.90 support on the 1-hour chart. A breakdown below this level could trigger a cascade of selling, potentially testing the more significant 4-hour support at $2,025.80. Conversely, a sustained push above the $2,063.06 resistance, backed by solid volume and positive indicator alignment, could signal the start of a recovery. The market is currently in a state of flux, where short-term fluctuations are common, but the overall trend is still being determined. Traders should remain vigilant, focusing on risk management and waiting for a clear, confirmed setup rather than trying to anticipate the market's next move prematurely.
The interplay of technical indicators, the broader crypto market sentiment, and macro-economic influences like the DXY creates a complex trading environment for ETHUSD. While the current price near $2,057.69 offers little clarity, the identified support and resistance levels provide a framework for potential future price action. The lack of a strong trend across multiple timeframes, coupled with conflicting oscillator signals, suggests a period of consolidation or a potential for a whipsaw market. As such, patience and discipline are key for traders looking to engage with ETHUSD in the near term. Waiting for a confirmed breakout or breakdown, supported by robust volume and aligned indicators, will be crucial for navigating these choppy waters and identifying high-probability trading opportunities.
The current technical picture for ETHUSD, trading around $2,057.69, reflects a market at a crossroads. The 1-hour chart shows RSI at 49.05, MACD with positive momentum but on the 4H negative momentum, and Stochastic oscillators offering mixed signals. The ADX readings across timeframes point towards weak trends, suggesting consolidation rather than strong directional movement. The DXY's strength at 99.81 adds a layer of complexity, typically posing a headwind for risk assets. Key levels to monitor are support at $2,051.90 (1H) and resistance near $2,063.06 (1H). A decisive close above this resistance, confirmed by increasing volume and a confluence of bullish indicators, would be needed to signal a potential upward move. Conversely, a break below $2,051.90 could lead to further downside, targeting the $2,025.80 support on the 4-hour chart.
The broader cryptocurrency market sentiment, influenced by Bitcoin's trajectory and on-chain metrics, remains a critical factor. While specific on-chain data is not detailed here, a general trend of cautious accumulation or distribution among whales, and the flow of ETH onto and off exchanges, would provide further clues. Developments in DeFi, such as TVL and staking yields, and regulatory news, especially concerning stablecoins and crypto ETFs, continue to shape the market's perception of Ethereum's long-term value proposition. The recent surge in crude oil prices, driven by geopolitical tensions, also contributes to a broader market environment where inflation concerns might influence central bank policies, indirectly impacting crypto.
The path forward for ETHUSD hinges on several factors. A sustained break above the $2,063.06 resistance, coupled with positive developments in crypto-specific fundamentals and a less hawkish stance from the DXY, could ignite a bullish rally. However, if ETHUSD fails to hold the $2,051.90 support, the bearish scenario becomes more probable, potentially leading to a test of lower levels. The market's reaction to upcoming economic data releases and any further geopolitical developments will be crucial in determining the short-to-medium term direction. For now, a 'WATCH_ZONE' approach is prudent, emphasizing risk management and waiting for clearer signals.
In the absence of a strong trend, price action trading becomes paramount. Scalpers might look for short-term opportunities around the immediate 1H support and resistance, focusing on tight risk management. Swing traders, however, would likely wait for a confirmed breakout or breakdown, seeking higher probability setups that offer a better risk-reward ratio. The current environment suggests that patience will be rewarded. Waiting for ETHUSD to establish a clearer direction, supported by both technical confirmation and fundamental catalysts, is the most prudent strategy. The market is dynamic, and opportunities will arise, but forcing trades in uncertain conditions often leads to unnecessary losses.
The key takeaway from the current ETHUSD price action near $2,057.69 is the prevailing uncertainty. With mixed technical signals across timeframes, a strong DXY acting as a headwind, and a lack of clear fundamental catalysts, the market is likely to remain range-bound or volatile in the short term. The critical levels of $2,051.90 support and $2,063.06 resistance on the 1-hour chart will be key battlegrounds. A decisive move beyond these levels, accompanied by increased volume and positive confirmation from other indicators and market sentiment, will be necessary to establish a clear trend. Until then, a cautious approach, prioritizing risk management and waiting for confirmed trading setups, is the most advisable strategy for navigating this complex crypto market.
The current market sentiment for ETHUSD, trading around $2,057.69, is characterized by a lack of strong directional conviction. While the 1-hour chart shows a neutral trend with RSI at 49.05, the 4-hour chart indicates a downward pressure with RSI at 46.4. The DXY’s strength at 99.81 adds to the bearish pressure on risk assets. Key levels to watch are the 1H support at $2,051.90 and resistance at $2,063.06. A confirmed break above resistance, supported by bullish indicators and positive market sentiment, could signal an upward move. Conversely, a break below support might lead to further declines. Given the current indecision, a 'WATCH_ZONE' approach is recommended, focusing on risk management and waiting for clearer signals before entering significant positions.
The recent surge in crude oil prices, driven by geopolitical tensions, highlights the interconnectedness of global markets. While not directly impacting ETHUSD's price, such events can influence overall risk appetite, which in turn affects cryptocurrency markets. If these geopolitical concerns escalate, leading to a broader 'risk-off' sentiment, assets like gold and the US Dollar might strengthen, while cryptocurrencies could face selling pressure. Conversely, a de-escalation of tensions could foster a 'risk-on' environment, potentially benefiting ETHUSD. Understanding these macro correlations is vital for a holistic trading strategy.
The fundamental drivers for ETHUSD are multifaceted, encompassing on-chain activity, DeFi ecosystem health, and regulatory developments. While specific on-chain data isn't provided, a general observation of active addresses, whale movements, and exchange flows would offer insights into investor sentiment. The health of Ethereum's DeFi sector, measured by TVL and staking yields, and the pace of institutional adoption, such as through potential ETF approvals, are also critical factors that could influence long-term price trends. The lack of specific recent news directly impacting ETHUSD means that technicals and macro correlations currently hold more sway in short-term price discovery.
Trading Scenarios for ETHUSD
Bearish Scenario: Downside Pressure Mounts
65% ProbabilityNeutral Scenario: Consolidation Around $2,057
25% ProbabilityBullish Scenario: Recovery Potential
10% Probability| Indicator | Value | Signal | Interpretation |
|---|---|---|---|
| RSI (14) | 49.05 | Neutral | Slightly bearish trend on 1H, further down on 4H. |
| MACD | Positive Momentum (1H) / Negative Momentum (4H) | Mixed | Divergence suggests indecision or potential reversal. |
| Stochastic | K=61.12, D=69.15 (1H) / K=26.01, D=33.46 (4H) | Bearish | Bearish cross on 1H, oversold potential on 4H. |
| ADX | 15.11 (1H) / 16.94 (4H) | Weak Trend | Lack of strong directional momentum across short-term charts. |
| Bollinger Bands | Middle Band | Watch | Price moving above middle band on 1H, below on 4H, indicating choppiness. |
Frequently Asked Questions: ETHUSD Analysis
What happens if ETHUSD breaks below the $2,051.90 support level?
A confirmed break below the $2,051.90 support on the 1-hour chart could trigger further selling pressure, potentially leading to a test of the $2,046.12 level. If this level also fails, the next significant support to watch would be $2,025.80 on the 4-hour timeframe.
Should I consider buying ETHUSD at current levels near $2,057.69 given the mixed signals?
Given the mixed signals and weak trend indicated by the ADX, buying at current levels is not recommended without further confirmation. A more prudent approach would be to wait for a decisive break above the $2,063.06 resistance, or a clear bounce from the $2,051.90 support, accompanied by increased volume and positive indicator confluence.
Is the RSI at 49.05 on the 1H chart a sell signal for ETHUSD?
An RSI of 49.05 is technically in the neutral zone, slightly favoring a bearish trend but not yet indicating oversold or overbought conditions. While it suggests a lack of bullish momentum, it's not a standalone sell signal. Confirmation from other indicators, such as a bearish MACD cross or a break below key support, would be needed to validate a sell-off.
How might the strong DXY at 99.81 affect ETHUSD's price action this week?
The strong DXY at 99.81 typically exerts downward pressure on risk assets like ETHUSD. This correlation suggests that continued strength in the dollar could hinder any potential recovery attempts for ETHUSD, making it more expensive for foreign investors and potentially leading to reduced demand unless counteracting bullish crypto-specific news emerges.
The path forward for ETHUSD remains uncertain, with key support at $2,051.90 and resistance around $2,063.06 dictating the short-term outlook. The prevailing market conditions, marked by mixed technical signals and a strong US Dollar, suggest that patience is a virtue. Traders should focus on risk management and wait for clear, confirmed setups rather than attempting to force trades in the current environment. The market always presents opportunities, but waiting for the right moment, supported by robust data and technical confluence, is key to long-term success.
Track markets in real-time
AI-powered analysis, technical indicators and real-time price data.
Join Our Telegram Channel
Breaking market news, AI analysis and trading signals instantly.
Join Channel