

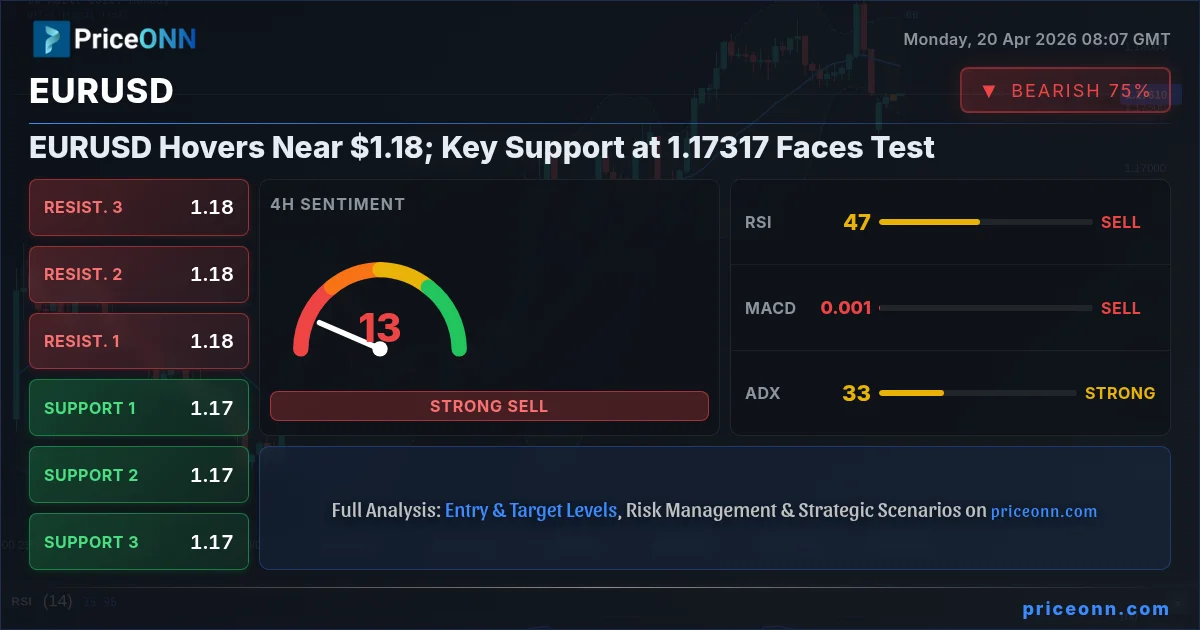
EURUSD is currently navigating a pivotal zone, trading near the $1.18 mark. The pair's recent price action reveals a complex interplay of technical indicators and fundamental undercurrents, with immediate attention fixed on the crucial support level at 1.17317. As traders digest mixed signals from various timeframes, the prevailing market sentiment suggests a cautious approach, awaiting clearer direction from upcoming economic releases and the persistent influence of the US Dollar Index (DXY).
- EURUSD is currently trading around $1.18, with immediate support identified at 1.17317.
- The 1-hour chart shows a neutral trend with a 'Sell' signal, while the 4-hour chart exhibits a strong 'Sell' signal within an uptrend.
- The daily chart presents a bullish bias with a 'Buy' signal, highlighting significant divergence across timeframes.
- DXY is at 98, exhibiting a mixed technical picture, which adds complexity to EURUSD's directional bias.
The EURUSD today analysis reveals a market caught between conflicting signals. On the 1-hour timeframe, the trend is neutral with a prevailing 'Sell' signal, indicating short-term bearish pressure. This is corroborated by a RSI(14) reading of 44.68, suggesting a downward inclination, and the MACD, which shows momentum balancing out. However, the Stochastic oscillator on this timeframe is flashing a 'Buy' signal with %K (78.6) above %D (61.06), creating a notable divergence. The ADX at 17.65 points to a weak trend, suggesting that current price action might be more noise than a committed directional move. This short-term indecision makes immediate trading strategies precarious.
Navigating Short-Term Weakness and Divergence
The immediate technical landscape for EURUSD on the 1-hour chart is a mixed bag, leaning towards caution. While the overall trend is classified as neutral, the 'Sell' signal suggests that bears have a slight edge in the very short term. The RSI(14) at 44.68, firmly in neutral territory but trending downwards, hints at potential selling pressure building. The MACD's current state of momentum balancing out reinforces this view, implying that the recent upward push might be losing steam. However, the Stochastic oscillator presents a counter-argument: its %K line (78.6) has crossed above the %D line (61.06), typically a bullish signal indicating that the pair might be oversold and poised for a rebound. This divergence between RSI/MACD and Stochastic is a classic sign of market indecision and potential volatility. Traders are often advised to wait for confirmation, perhaps a decisive break above resistance or a clear hold of support, before committing to a short-term position. The ADX value of 24.81 on the 4-hour chart for XAGUSD, though not directly EURUSD, suggests that trends generally are not strongly established across all markets, adding to the general uncertainty.
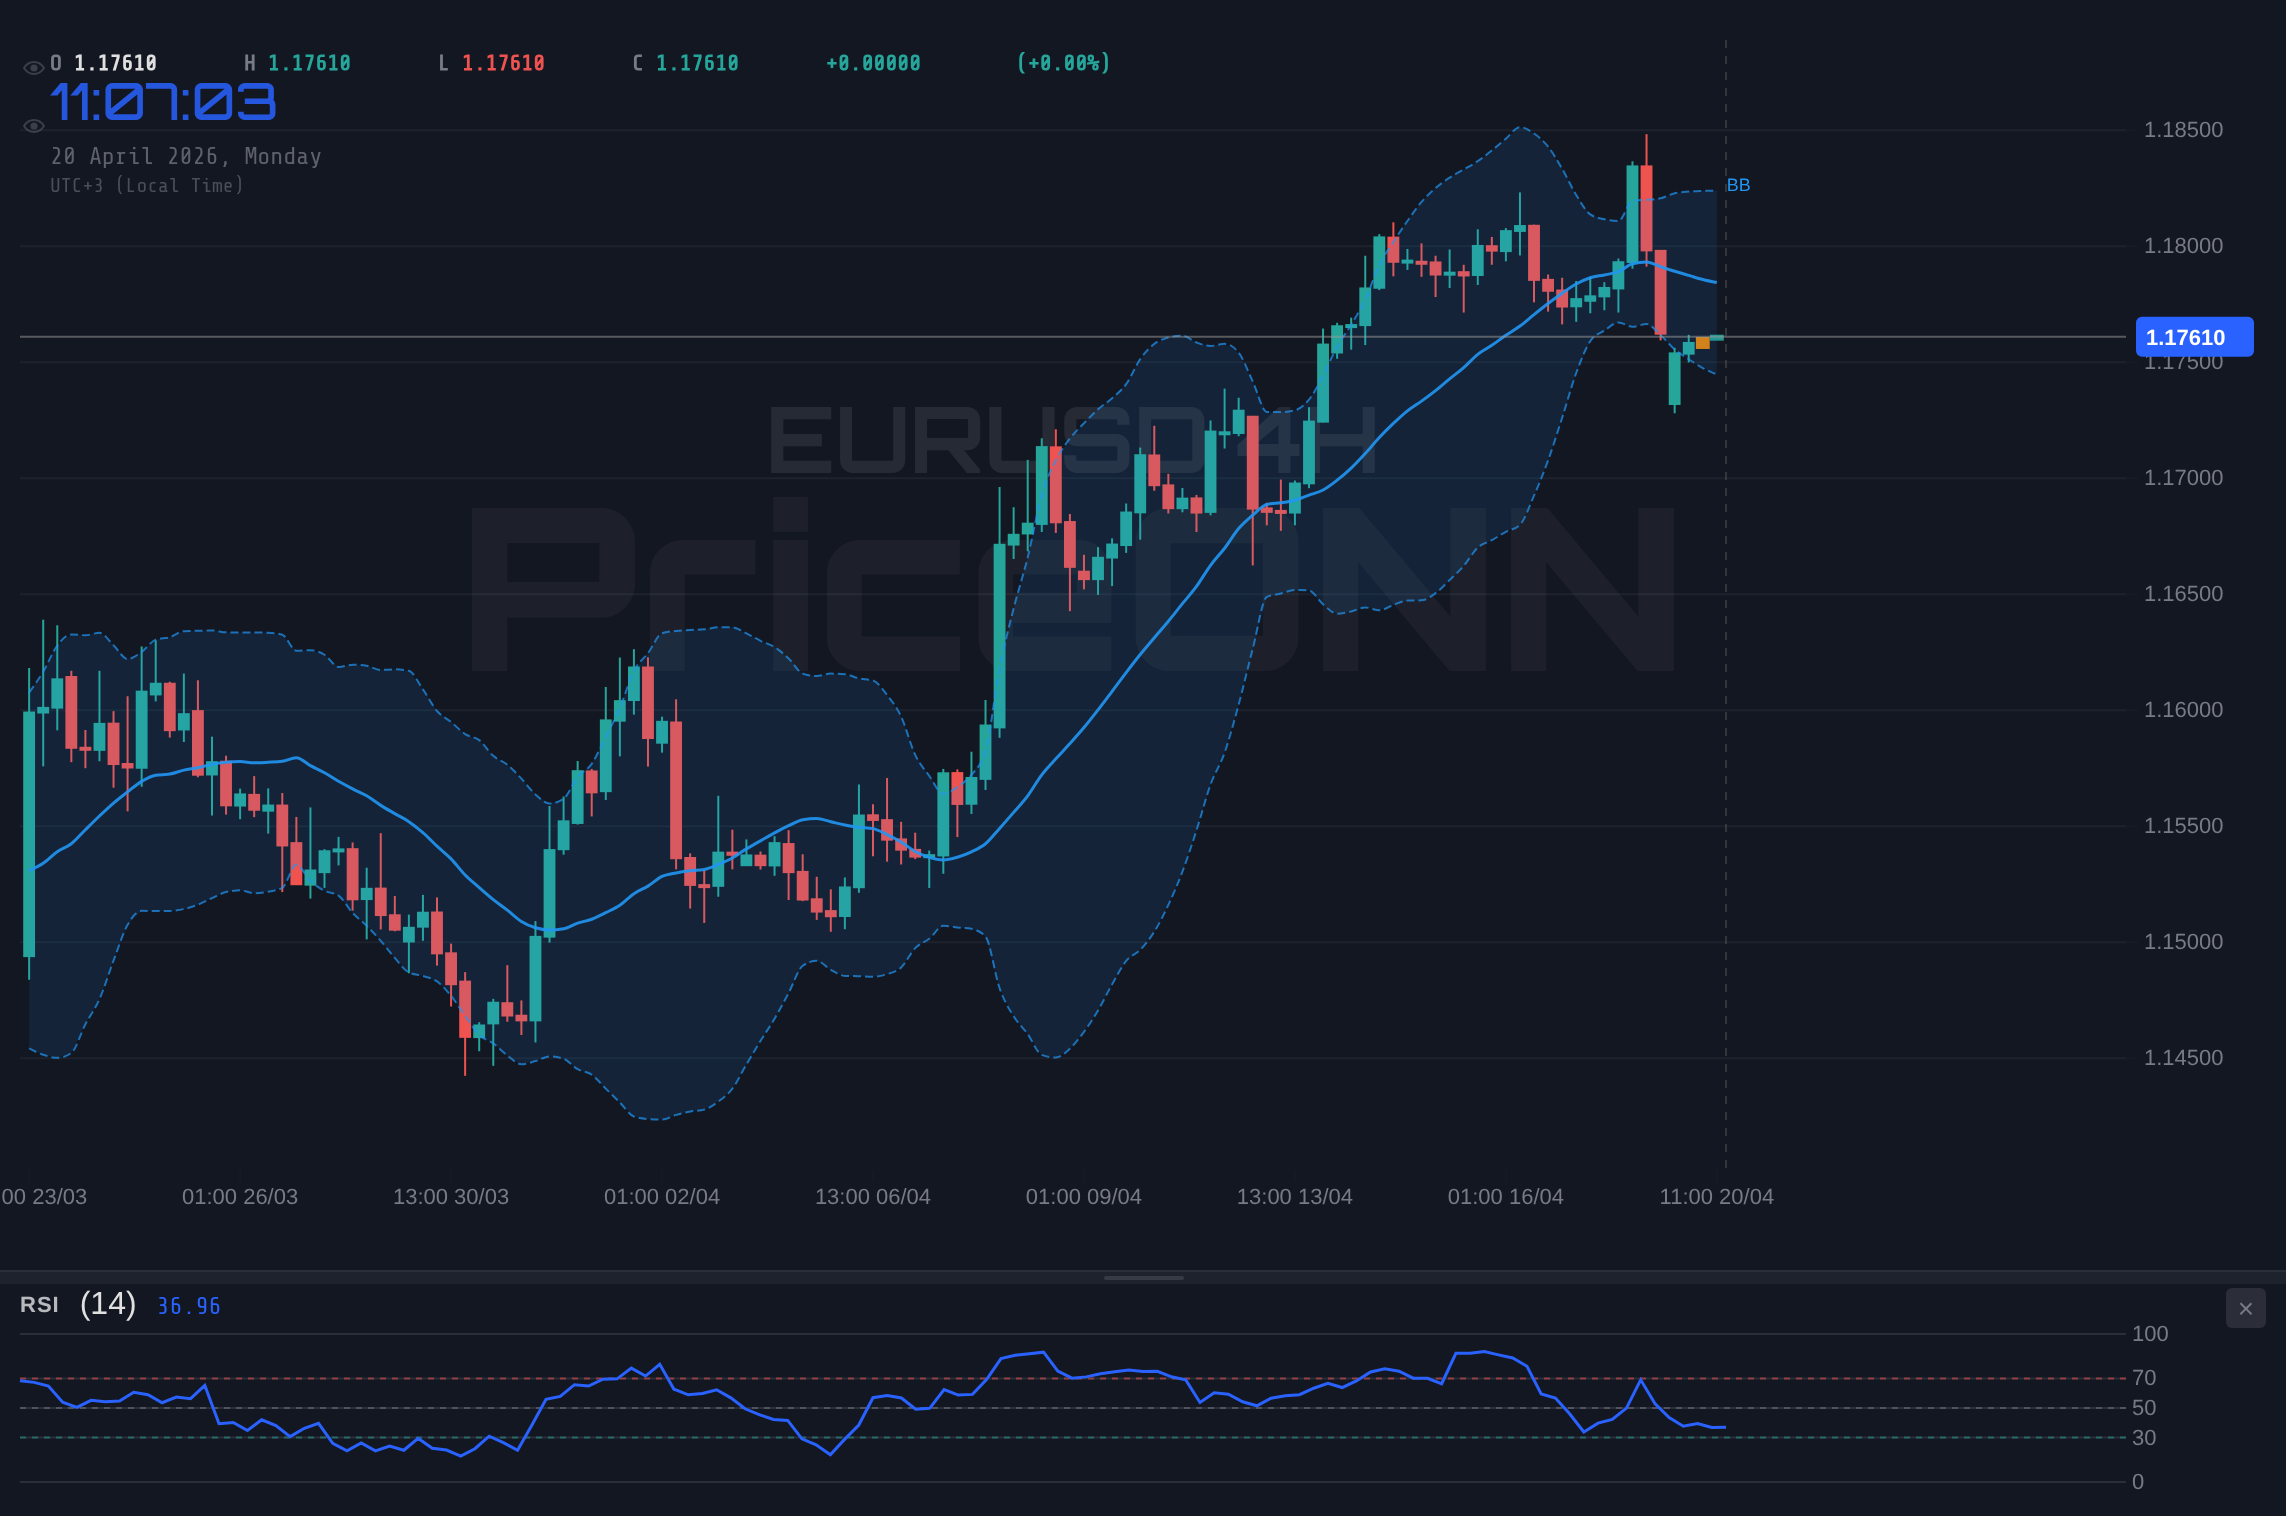
The support levels on the 1-hour chart are pegged at 1.17524, 1.17406, and 1.17343. Conversely, resistance lies at 1.17705, 1.17768, and 1.17886. The current price of $1.18 positions EURUSD squarely within this short-term range, but closer to the upper boundary of immediate resistance. A break below the 1.17524 support could signal further downside towards 1.17317, a level we'll discuss further. Conversely, a sustained move above 1.17705 might encourage a test of higher resistance levels, though the broader daily trend could cap such gains.
The 4-Hour Chart: A Stronger Bearish Signal Amidst an Uptrend
Diving into the 4-hour timeframe for EURUSD paints a more definitive, albeit conflicting, picture. Here, the trend is classified as 'Uptrend' with a very high power of 91%, suggesting that the larger picture still favors buyers. However, the 'General Signal' is a strong 'SAT' (Sell). This dichotomy is critical. The RSI(14) at 47.07, while in neutral territory, continues its downward trend, reinforcing the bearish signal. The MACD remains in negative momentum, with the MACD line below its signal line, indicating selling pressure. Bollinger Bands are below the middle band, a sign of bearish consolidation or a potential breakdown. The Stochastic oscillator presents a strong 'Sell' signal (%K at 16.63 crossing below %D at 39.05), confirming the bearish sentiment on this timeframe. The ADX at 32.9 indicates a strong uptrend, which seems to contradict the 'Sell' signals from RSI, MACD, and Stochastic. This suggests that while an uptrend might be technically present, the immediate momentum is decidedly bearish, possibly setting up a significant pullback or even a trend reversal if key levels fail.
The support levels on the 4-hour chart are 1.17358, 1.17178, and 1.17076. Resistance is seen at 1.17640, 1.17742, and 1.17922. The current price of $1.18 is above the immediate 4-hour resistance, which, given the strong 'Sell' signals across indicators, could be a point of rejection. A decisive close below 1.17358 would be a significant bearish development, potentially targeting the lower support levels and invalidating the higher timeframe uptrend. The confluence of a strong uptrend (ADX) with strong sell signals suggests a potential for a sharp reversal, a common pattern when market participants anticipate shifts in economic policy or sentiment.
Daily Timeframe: A Glimmer of Bullish Hope
Shifting to the daily chart, the EURUSD presents a more optimistic outlook, albeit with its own set of cautionary notes. The trend is classified as 'Neutral' with a 50% power, indicating a lack of strong directional conviction over the longer term. Yet, the 'General Signal' is 'AL' (Buy). The RSI(14) at 60.08 is comfortably in neutral territory and shows a rising trend, suggesting potential for further upside. The MACD is positive, with the MACD line above its signal line, confirming bullish momentum. Bollinger Bands are above the middle band, aligning with a bullish bias. However, the Stochastic oscillator on the daily chart is showing a 'Sell' signal (%K at 74.55 crossing below %D at 89.81), which contrasts sharply with the RSI and MACD. This is a critical divergence: the daily chart suggests buying opportunities, but the Stochastic warns of potential overbought conditions or a coming downturn. The ADX at 28.42 indicates a strong uptrend, which, if it persists, could eventually override the Stochastic's bearish signal.
On the daily chart, support is found at 1.17317, 1.17011, and 1.16428. Resistance levels are higher up, at 1.18206, 1.18789, and 1.19095. The current price of $1.18 is sitting just below the first daily resistance level, making it a critical juncture. A sustained move above 1.18206 could signal a continuation towards higher targets, aligning with the daily 'Buy' signal. However, failure to overcome this resistance, especially with the Stochastic's bearish warning, could see the pair retreat towards the daily support at 1.17317. This level is particularly important as it aligns with the 1-hour chart's lower support boundary, making it a potential confluence point for a significant bounce or breakdown.
The Dollar Index (DXY) and its Influence
The Dollar Index (DXY) is currently trading at 98, showing a mixed technical picture. On the 1-hour timeframe, it exhibits a 'Düşüş' (Downtrend) with 86% power, yet the 'General Signal' is 'AL' (Buy). The RSI(14) at 58.12 is in neutral territory with an upward trend, supported by positive MACD momentum. However, the Stochastic oscillator shows a 'Sell' signal (%K at 65.16 crossing below %D at 73.54). The ADX at 21.22 indicates a moderately strong uptrend. On the 4-hour chart, the DXY is neutral with 50% power, but the 'General Signal' is 'AL' (Buy). RSI is at 51.52, MACD is positive, and Stochastic shows a 'Buy' signal (%K at 82.12 crossing above %D at 59.38). The ADX at 33.01 points to a strong downtrend, which is a significant contradiction. The daily chart presents a more bearish outlook, with a neutral trend (50% power) and a 'SAT' (Sell) signal. RSI is at 42.25, trending down, MACD is negative, and Stochastic shows a 'Buy' signal (%K at 28.81 crossing above %D at 11.7). The ADX at 26.24 indicates a strong downtrend.
This complex DXY picture directly impacts EURUSD. A stronger dollar generally exerts downward pressure on EURUSD, and vice versa. With the DXY showing a mix of short-term bullish signals (1H, 4H 'Buy') and longer-term bearish signals (Daily 'Sell', 4H ADX downtrend), its influence adds another layer of uncertainty. If the DXY strengthens, it could drag EURUSD down towards the 1.17317 support. Conversely, a weakening dollar, suggested by the daily chart's bearish trend and sell signal, could provide a tailwind for EURUSD, pushing it towards the 1.18206 resistance. The current price of DXY at 98 makes it a critical level to watch; a decisive move away from this level could significantly influence currency pair movements.
Economic Calendar and Fundamental Drivers
Looking at the economic calendar, several high-impact events are on the horizon that could significantly influence EURUSD. This week's calendar shows upcoming releases for US Non-Farm Payrolls (NFP) and Average Hourly Earnings, crucial indicators for the Federal Reserve's monetary policy decisions. The previous NFP data came in at 207K, slightly below the forecast of 212K, and Average Hourly Earnings were at -0.913% versus a forecast of -1%. These figures suggest some softening in the US labor market, which could give the Fed pause regarding future interest rate hikes. If upcoming releases show further weakness, it could lead to a weaker dollar, supporting EURUSD's move higher. Conversely, stronger-than-expected data could boost the dollar and put pressure on the pair.
Furthermore, upcoming PMI data for both the US (forecast 52.5, previous 52.3) and the Eurozone (forecast 50.1, previous 49.8) will be critical. A PMI reading above 50 indicates expansion, while below 50 suggests contraction. If the Eurozone PMI shows a stronger expansion than the US, it would favor EURUSD. The previous UK GBP data showed a trade surplus of 3.3 billion, beating forecasts, which could indirectly influence EURUSD sentiment by affecting broader European economic perceptions, although direct correlation is limited. The recent news regarding a surprise trade surplus in New Zealand, while not directly impacting EURUSD, contributes to a global narrative of shifting trade dynamics and could influence overall risk appetite, which in turn affects currency markets. The market will be closely watching these economic releases for clues on the future path of monetary policy, particularly from the Fed and potentially the ECB, which will be key drivers for EURUSD in the coming days.
Synthesizing the Signals: A Path Forward
The EURUSD presents a challenging trading environment characterized by significant divergence across timeframes and conflicting technical signals. The 1-hour chart leans bearish short-term, the 4-hour chart shows strong bearish momentum within an uptrend, while the daily chart offers a bullish signal but is cautioned by a bearish Stochastic. The DXY's own mixed signals further complicate the outlook. The critical support at 1.17317, a confluence point across multiple timeframes, becomes the immediate focal point. A break below this level would likely invalidate the daily bullish bias and could trigger a more significant sell-off, targeting lower support levels.
Conversely, if EURUSD holds above 1.17317 and manages to break through the immediate resistance around 1.17705 (1H) and 1.17640 (4H), it could signal a continuation of the daily uptrend. However, the resistance at 1.18206 on the daily chart looms large and may cap any further upside without a significant shift in fundamental drivers, such as a dovish surprise from the Fed or a hawkish stance from the ECB. The upcoming economic data, particularly US NFP and PMIs, will be crucial in determining the next directional move. Traders must remain disciplined, prioritizing risk management and waiting for clear confirmation before entering positions. The market is currently in a state of flux, and patience will likely be rewarded.
Bearish Scenario: Support Break and Downside Acceleration
65% ProbabilityNeutral Scenario: Consolidation Around $1.18
25% ProbabilityBullish Scenario: Daily Trend Resumes
10% ProbabilityFrequently Asked Questions: EURUSD Analysis
What happens if EURUSD breaks below the critical support at $1.17317?
A break below $1.17317 would invalidate the daily bullish bias and likely trigger a move towards the next significant support levels at $1.17011 and potentially $1.16428. This would align with the bearish signals seen on the 4-hour chart.
Should I buy EURUSD at current levels near $1.18 given the mixed signals?
Buying at current levels around $1.18 is risky due to conflicting signals across timeframes. A more prudent approach would be to wait for price to hold above $1.17317 or break decisively above $1.18206, confirming a bullish continuation.
Is the RSI at 44.68 on the 1-hour chart a sell signal for EURUSD?
An RSI of 44.68 on the 1-hour chart is in neutral territory but trending downwards, suggesting potential for further selling pressure. However, it's not yet in oversold territory, and the Stochastic oscillator shows a conflicting bullish signal, indicating caution is warranted.
How will upcoming US NFP data affect EURUSD this week?
Weaker-than-expected US NFP data could weaken the dollar, supporting EURUSD and potentially pushing it towards resistance levels like $1.18206. Stronger data could boost the dollar, leading EURUSD to test support near $1.17317.
| Indicator | Value | Signal | Interpretation |
|---|---|---|---|
| RSI (14) | 44.68 (1H) | Neutral | Downward trend suggests slight bearish lean |
| MACD | Balancing | Neutral | Momentum is not clearly defined |
| Stochastic | K=78.6, D=61.06 (1H) | Bullish | %K crossed above %D, potential reversal |
| ADX | 17.65 (1H) | Weak | Trend is not strongly established |
| RSI (14) | 47.07 (4H) | Bearish | Downward trend, supports sell signal |
| MACD | Negative Momentum | Bearish | MACD below signal line |
| Stochastic | K=16.63, D=39.05 (4H) | Bearish | Strong sell signal, %K below %D |
| ADX | 32.9 (4H) | Strong | Indicates a strong uptrend technically |
| RSI (14) | 60.08 (1D) | Bullish | Comfortably in neutral, rising trend |
| MACD | Positive Momentum | Bullish | MACD above signal line |
| Stochastic | K=74.55, D=89.81 (1D) | Bearish | Bearish crossover, warning of overbought |
| ADX | 28.42 (1D) | Strong | Indicates a strong uptrend technically |
Track markets in real-time
AI-powered analysis, technical indicators and real-time price data.
Join Our Telegram Channel
Breaking market news, AI analysis and trading signals instantly.
Join Channel