

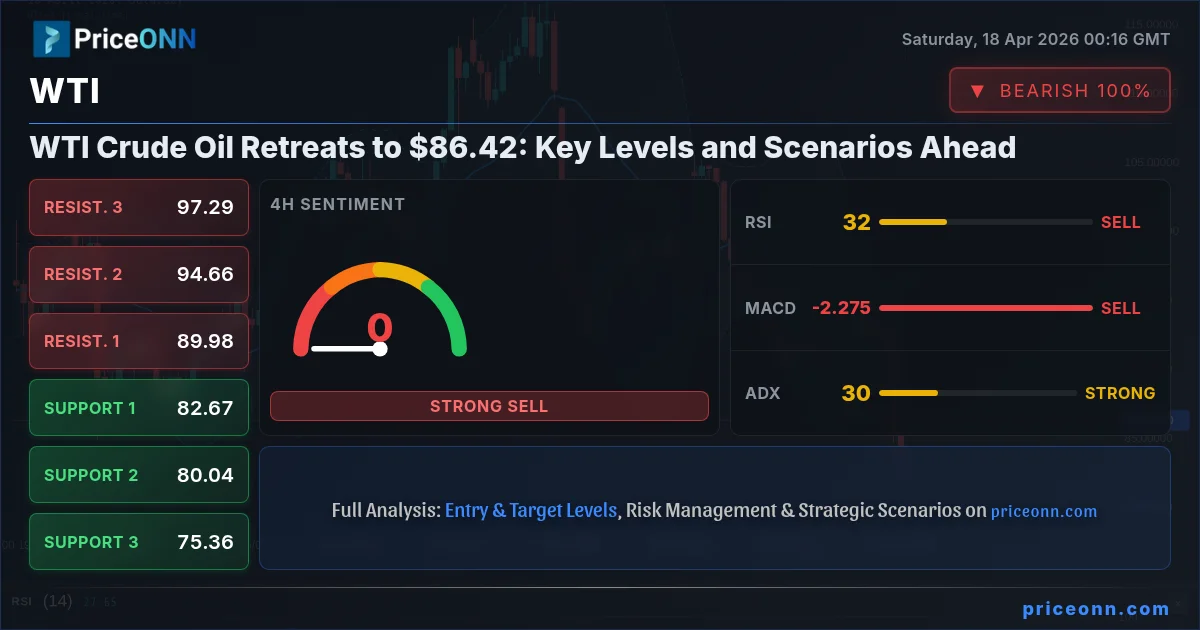
WTI Crude Oil experienced a volatile week, closing last Friday at $86.42 after a significant 6.7% drop from its recent highs. This sharp pullback, triggered by a confluence of easing geopolitical tensions and a surge in US crude oil inventories, has put traders on alert. As the market digests these developments, the focus now shifts to key technical levels and upcoming economic data that could dictate the next move. Understanding the interplay between supply dynamics, demand expectations, and the broader macroeconomic landscape is crucial for navigating this complex market.
- WTI Crude Oil closed the week at $86.42, down 6.7% amid easing geopolitical fears and rising US inventories.
- Critical support for WTI is identified at $85.07 (S1), with further downside potential to $83.27 (S3).
- Resistance is capped near $86.87 (R1), a break above which could target $88.67 (R3).
- The ADX at 30.33 on the 4H chart indicates a strong downtrend, while the 1H ADX at 37.6 suggests significant momentum.
- Geopolitical shifts, particularly concerning US-Iran talks and the Strait of Hormuz, alongside US inventory data, will be key drivers.
Navigating the Fallout: Why WTI Dropped Below $90
The past week was a stark reminder of how quickly sentiment can shift in the oil markets. WTI Crude Oil, after touching highs near $100.31 earlier in the month, experienced a dramatic reversal, closing at $86.42. This decline wasn't a single event but a cascade of factors that eroded bullish momentum. The primary catalyst appears to be the easing of tensions in the Middle East. News suggesting progress in US-Iran diplomatic talks, coupled with Iran's decision to reopen the Strait of Hormuz, significantly reduced the immediate geopolitical risk premium that had been inflating prices. This perceived de-escalation immediately took a key driver off the table for the bulls.
Adding to the bearish pressure was a substantial build-up in US crude oil inventories. Data released this week showed a significant spike, far exceeding forecasts. The market reacted strongly to the report showing inventories rising by 207 thousand barrels, contrasting with a forecast of 10.3 thousand barrels. This indicates that domestic supply is more than adequate, potentially even outpacing demand. When you combine reduced immediate geopolitical threats with a glut of supply, the stage is set for a price correction. The market's reaction was swift, pushing WTI prices down sharply as traders reassessed their positions and the fundamental supply-demand balance.
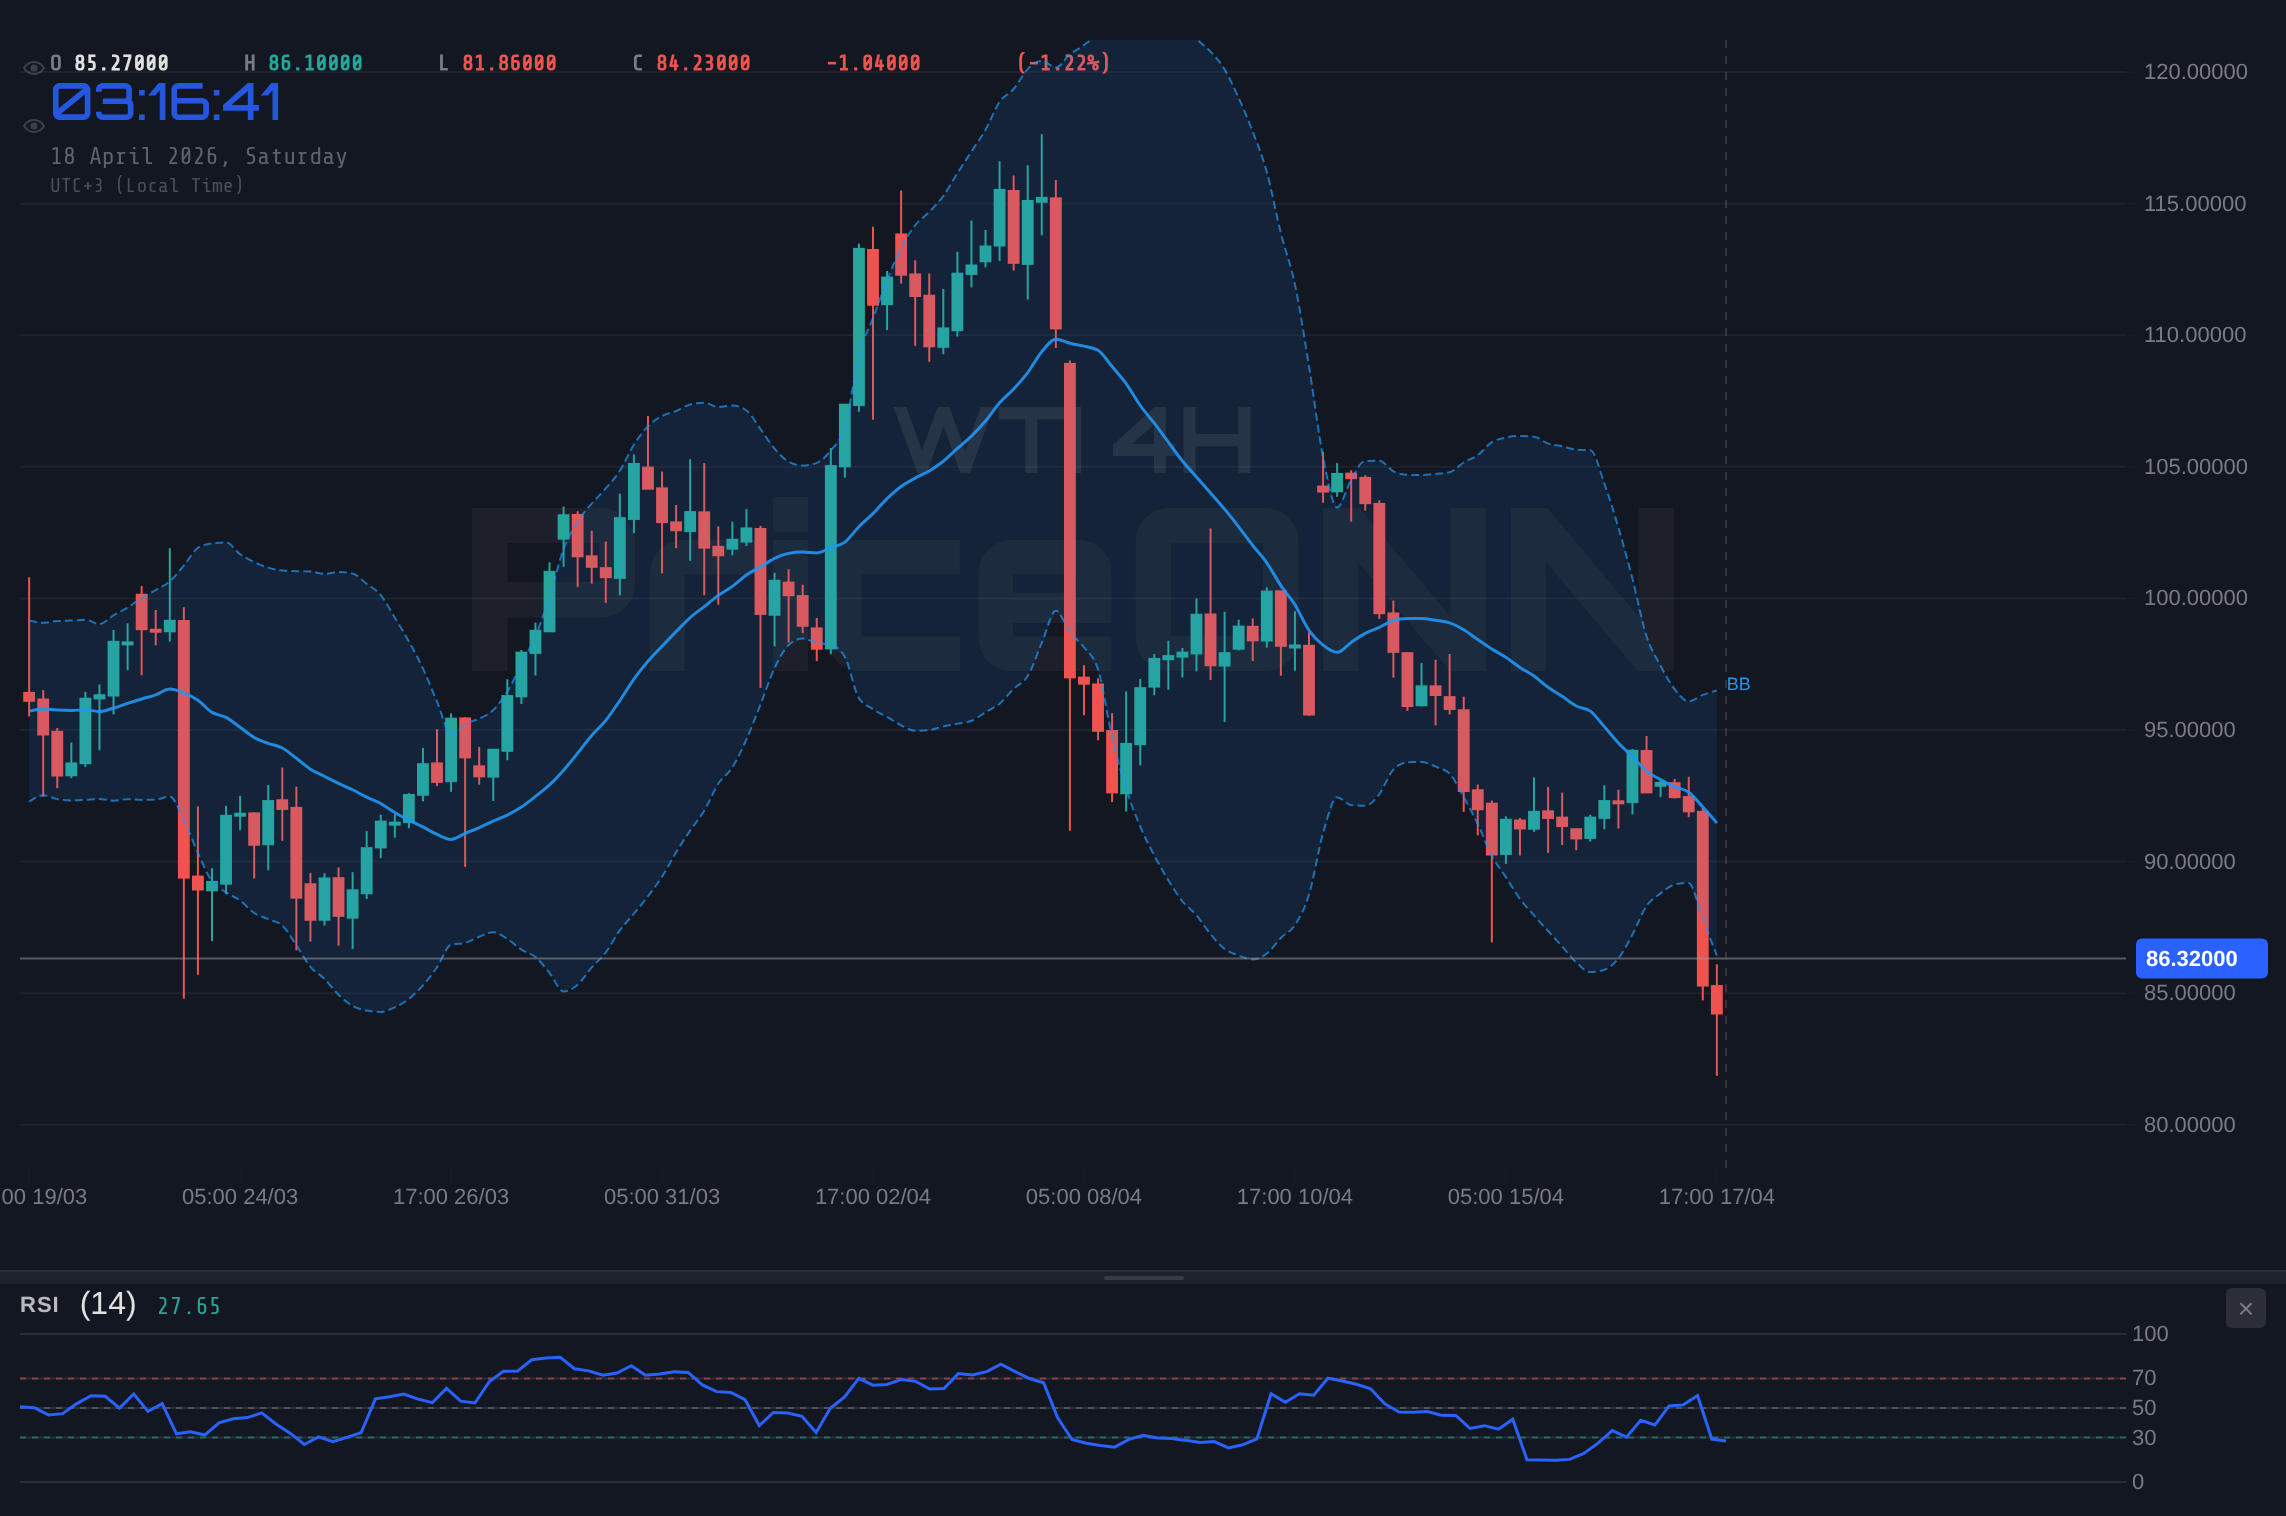
This shift in sentiment is clearly reflected in the technical indicators. While the 1D ADX still hovers around 34.16, suggesting a strong downtrend on the daily chart, the shorter timeframes paint a more immediate picture of bearish momentum. The 1H ADX at 37.6 and the 4H ADX at 30.33 confirm that the selling pressure is robust and has established a clear trend in the short to medium term. This technical backdrop validates the price action seen throughout the week, reinforcing the bearish narrative that has taken hold of WTI.
The Impact of Inventory Reports
Let's delve deeper into the inventory data. The latest report indicated a build of 207 thousand barrels, which, while not as dramatic as some historical spikes, was certainly a surprise given the prevailing expectations of a smaller increase or even a draw. This data point is crucial because it directly addresses the physical supply side of the oil market. High inventories generally suggest that production is outpacing consumption, leading to downward pressure on prices. For traders, this report serves as a tangible piece of evidence that the supply side is tightening, counteracting the fears of supply disruptions that had previously supported higher prices.
Furthermore, the context of these inventory levels matters. If global demand were exceptionally strong, a build might be absorbed more easily. However, with ongoing concerns about global economic growth, particularly in regions like Europe and China, demand growth is not robust enough to easily absorb surplus supply. This imbalance becomes amplified when geopolitical risks that could constrain supply are simultaneously receding. The market is left with a clear picture: more oil available than anticipated, and fewer immediate threats to its flow. This fundamental shift is a significant headwind for WTI prices in the short term.
The weekly inventory report is always a closely watched event, and this week's figures provided a clear bearish signal. It underscores the importance of fundamental data in driving commodity prices, often overriding speculative or geopolitical narratives in the medium term. As we look ahead, traders will be scrutinizing future inventory reports and demand indicators to see if this trend of rising stockpiles continues or if the market dynamics shift again.
Geopolitical Winds Shift: Hormuz Reopens, Easing Oil Fears
The narrative surrounding oil prices has been heavily influenced by geopolitical tensions for months, particularly concerning the Strait of Hormuz, a critical chokepoint for global oil trade. Any hint of disruption in this region has historically sent prices soaring due to the immediate threat to supply. However, this past week saw a significant development: reports emerged that Iran has reopened the Strait of Hormuz. This news, if fully substantiated and sustained, drastically alters the risk premium embedded in oil prices.
The Strait of Hormuz is vital, with roughly 20% of global oil consumption passing through it daily. Any closure or significant disruption would have immediate and severe consequences for global supply chains and energy markets. Therefore, the news of its reopening was met with considerable relief by market participants. It signals a potential de-escalation of regional conflicts, reducing the likelihood of supply shocks. This development directly challenges the bullish narrative that has been predicated on the risk of a supply squeeze originating from this volatile region. The market has reacted by pricing out a portion of this geopolitical risk premium.
While the reopening is a positive sign, it's important to remain cautious. Geopolitical situations are fluid, and statements from various parties can change rapidly. However, for the immediate term, this development provides a significant counter-narrative to the supply-side concerns. It allows traders to focus more on the fundamental balance of supply and demand, where the picture has recently become more bearish due to inventory builds. This geopolitical shift is therefore a critical factor explaining the sharp decline in WTI prices, as it removes a key support pillar for higher valuations.
Technical Analysis: Key Levels and Indicator Signals
From a technical standpoint, WTI Crude Oil is at a critical juncture. The price has fallen sharply, testing key support levels. On the 1-hour chart, the immediate support is identified at $85.07, followed by $84.86 and $83.27. A break below these levels could signal further downside. Resistance, on the other hand, is currently seen at $86.87, $87.57, and $88.67. The directionality of the price action will heavily depend on which of these levels holds or breaks.
The technical indicators provide a mixed but predominantly bearish short-to-medium term outlook. On the 1-hour chart, the RSI is at 37.67, indicating a bearish trend but not yet in oversold territory. The MACD shows negative momentum, with the MACD line below the signal line, reinforcing the bearish sentiment. The Stochastic Oscillator (%K=42.07, %D=22.86) is showing a potential for a bounce, as %K is above %D, but this needs confirmation. The ADX, however, paints a strong bearish picture with a value of 37.6, indicating a robust downtrend. This suggests that any upward movements might be short-lived corrections within a larger bearish move.
Looking at the 4-hour timeframe, the picture remains bearish. Support levels are found at $82.67, $80.04, and $75.36. Resistance is observed at $89.98, $94.66, and $97.29. The RSI at 31.96 is approaching oversold conditions, which could suggest a potential reversal or consolidation. However, the MACD continues to show negative momentum. The Stochastic Oscillator (%K=24.99, %D=49.54) is in oversold territory and showing a bearish crossover, reinforcing the downtrend. The ADX at 30.33 confirms a strong downtrend. The Bollinger Bands are currently below the lower band, indicating extreme bearishness and a potential for a short-covering rally, but the underlying trend remains down.
On the daily chart, WTI is trading around $86.42, below the middle Bollinger Band. Support is at $90.45, $88.27, and $86.11, while resistance is at $94.79, $96.95, and $99.13. The RSI at 43.14 is in neutral territory with a bearish lean. The MACD is below its signal line, showing negative momentum. The Stochastic Oscillator (%K=15.23, %D=17.04) is in the oversold region, suggesting a potential bounce. The ADX at 38.29 indicates a very strong downtrend. Overall, the technical indicators across multiple timeframes suggest that the bearish momentum is strong, although short-term oversold conditions might lead to some consolidation or minor bounces.
The Week Ahead: What To Watch For WTI
Looking forward, several factors will be crucial in determining WTI's trajectory. The ongoing monitoring of US crude oil inventories remains paramount. Any further builds could exacerbate the current bearish sentiment, while a surprise draw might offer some respite to prices. The market will also be closely watching the geopolitical landscape. While tensions have eased, any resurgence of conflict or rhetoric that threatens supply routes could quickly reverse the current trend. Diplomatic developments between the US and Iran, and their impact on regional stability, will be a key focus.
Economic data releases will also play a significant role. Key inflation reports and employment figures from major economies can influence global demand expectations. For instance, higher-than-expected inflation could lead to tighter monetary policies, potentially dampening economic activity and, consequently, oil demand. Conversely, strong economic growth indicators could bolster demand forecasts and provide support to prices. The interplay between these fundamental drivers and technical levels will be essential for traders to navigate.
From a technical perspective, the $86.42 closing price is pivotal. A sustained break below $85.07 would likely open the door for a move towards the $83.27 level. Conversely, a strong rally that pushes WTI above the $86.87 resistance could signal a short-term recovery, potentially targeting higher levels around $88.67. The strength of any move will be indicated by accompanying volume and confirmation from other indicators. The ADX readings suggest that the current trend has momentum, so a decisive break of key levels is likely to be followed by further price action in that direction.
The Bull's Roadmap: A Potential Rebound Scenario
For WTI prices to stage a significant recovery, several conditions need to be met. Firstly, the geopolitical narrative would need to re-intensify, creating renewed fears of supply disruptions. This could involve escalations in the Middle East or specific actions targeting shipping lanes. Secondly, the upcoming US crude oil inventory data would need to show a surprise draw, indicating stronger-than-expected demand or production cuts. Thirdly, technical indicators would need to confirm a shift in momentum. A break above the immediate resistance at $86.87 would be the first sign, followed by a decisive move above $87.57. If WTI can break and hold above the $88.67 resistance level, it would signal a potential reversal, with the next significant target being the psychological $90 level, and potentially challenging the $92.98 mark.
The bullish scenario hinges on external catalysts that can override the current bearish fundamentals. A sudden geopolitical flare-up or a significant miss in upcoming economic data that boosts global growth expectations could provide the necessary spark. Technically, confirmation would come from RSI moving back above 50, MACD showing a bullish crossover, and Stochastic exiting oversold territory with a positive turn. The ADX would ideally need to show a weakening trend (below 25) to suggest the downtrend is losing steam, allowing for a more sustainable rally. This scenario currently appears less probable given the prevailing market sentiment but cannot be entirely dismissed.
Where Bears Take Control: The Downside Path
The bearish scenario appears to be the path of least resistance given the current technical and fundamental backdrop. The immediate trigger for further downside would be a decisive close below the $85.07 support level. This would confirm the breakdown from the current consolidation range and likely lead to a test of the $83.27 level. If selling pressure intensifies, driven by continued inventory builds or further de-escalation of geopolitical risks, the next significant support zone lies around $81.86. The ADX readings on the 1H and 4H charts (37.6 and 30.33 respectively) indicate strong trending conditions, suggesting that once support breaks, the move could be swift and significant.
Invalidation for this bearish outlook would occur if WTI prices manage to decisively break above the $86.87 resistance, and more importantly, hold above the $87.57 level. A close above $88.67 would significantly weaken the bearish case, suggesting a potential shift back towards consolidation or even a bullish reversal. However, until such a break occurs, the path of least resistance remains lower. The RSI would need to move out of its bearish lean and the Stochastic would need to confirm a bullish divergence. The strong downtrend indicated by the daily ADX of 38.29 suggests that bears have considerable control currently.
The Waiting Game: Consolidation Around $86.42
A neutral scenario, characterized by consolidation, is also plausible, especially if conflicting signals emerge or if key data releases are mixed. In this case, WTI might trade within a defined range, likely between the $85.07 support and the $86.87 resistance. This scenario often occurs when the market is waiting for a clear catalyst, such as a major economic announcement or a significant geopolitical event, to break the stalemate. During consolidation, technical indicators might give conflicting signals, with RSI hovering around the 50 level and MACD oscillating around its signal line.
The ADX would likely remain subdued in this scenario, indicating a lack of strong trend momentum. Price action might become choppy, with smaller trading ranges and failed attempts to break key levels. This period of indecision can be frustrating for traders seeking clear directional trades. However, it also presents opportunities for range-bound strategies, buying near support and selling near resistance, provided risk management is strictly applied. The duration of such a consolidation phase would depend on how long it takes for the market to digest current information and for new drivers to emerge.
Bearish Scenario: Downside Targets Beckon
65% ProbabilityBullish Scenario: A Rebound on Renewed Risk
15% ProbabilityNeutral Scenario: Range-Bound Indecision
20% ProbabilityThe Most Probable Path and Key Triggers to Watch
Given the current technical indicators and fundamental backdrop, the bearish scenario presents the highest probability at 65%. The strong downtrend signals on the hourly and daily charts, coupled with the significant build-up in US crude oil inventories and the receding geopolitical risk premium, all point towards further downside potential. The $85.07 support level is critical; a break below it would likely trigger a cascade of stop-loss orders, accelerating the move towards $83.27 and potentially $81.86.
However, the market is rarely linear. The 20% probability assigned to the neutral scenario acknowledges the possibility of consolidation. This could occur if upcoming economic data is mixed, or if geopolitical tensions unexpectedly resurface. Traders should remain vigilant for any signs of a shift in momentum. The bullish scenario, with a 15% probability, requires significant catalysts - either a sharp escalation in geopolitical risks or a major positive surprise on the demand side. Without such events, a sustained rally above $88.67 seems unlikely in the immediate term.
What I'll be watching closely this week are a few key triggers: First, the next US crude oil inventory report. A continued build would reinforce the bearish outlook, while a draw could signal a potential bottom. Second, any significant shifts in the geopolitical rhetoric concerning the Middle East and Iran. A return to heightened tensions could invalidate the bearish thesis rapidly. Third, the price action around the $85.07 support level. A decisive breach here would confirm the bearish scenario, while holding this level could lead to a period of range-bound trading.
- US Crude Oil Inventories: Further builds would solidify the bearish case; a surprise draw could signal a bottom.
- Geopolitical Developments: Any escalation in Middle East tensions or rhetoric could invalidate the current downside move.
- $85.07 Support Level: A decisive break below this level would confirm the bearish scenario and target lower prices.
Connecting the Dots: Macro Factors and Oil Prices
It's essential to understand how broader macroeconomic factors are influencing WTI prices. The US Dollar Index (DXY) provides a crucial correlation. With DXY currently trading around 97.9, its relatively stable position doesn't exert strong directional pressure on commodities at this exact moment. However, any significant move in the dollar, driven by Federal Reserve policy expectations or global risk sentiment, will undoubtedly impact oil. A strengthening dollar typically puts downward pressure on dollar-denominated commodities like WTI, making them more expensive for holders of other currencies.
The Federal Reserve's monetary policy stance remains a key consideration. While recent inflation data showed some moderation (Actual: 2.6%, Forecast: 2.5%), the Fed is likely to remain cautious. The latest US employment data (Actual: 207k, Forecast: 213k) showed a slight miss, which could influence the Fed's decision-making, potentially leading to a pause in rate hikes sooner rather than later. Lower interest rates or a less hawkish Fed stance could stimulate economic growth and, by extension, oil demand, providing some support for WTI. Conversely, persistent inflation or a more hawkish Fed could dampen demand prospects.
Equity markets also offer insights into risk appetite. The S&P 500 is trading around 6572.87, showing resilience. A strong equity market generally correlates with higher risk appetite, which can be positive for oil demand. However, the Nasdaq 100, trading at 26682.75, is showing signs of overheating, with RSI at 72.58 in the 1H chart. If risk appetite falters, and major indices like the S&P 500 begin to retreat, it could spill over into commodities, adding another layer of bearish pressure on WTI.
Treasury yields also play a role. While not explicitly provided in the market data, rising yields can indicate expectations of higher inflation or tighter monetary policy, which can dampen economic activity and oil demand. Conversely, falling yields might suggest a flight to safety or expectations of economic slowdown, which can also be bearish for oil, though it can sometimes support gold as a safe-haven asset. The intricate web of correlations between currencies, equities, yields, and commodities means that a holistic view is always necessary for effective market analysis.
PriceONN's Weekly Review: Key Events and Levels
This past week, WTI Crude Oil prices saw a dramatic reversal, closing at $86.42, down 6.7%. This followed a period of geopolitical tension that had pushed prices towards $100.31. The primary drivers for the decline were the easing of Middle East tensions, particularly concerning the Strait of Hormuz, and a significant build-up in US crude oil inventories, which rose by 207 thousand barrels against expectations of a smaller increase. These fundamental shifts overshadowed earlier supply disruption fears.
Technically, WTI broke key support levels. The $90.00 psychological level was breached early in the week, followed by a test of the $88.27 support. The closing price at $86.42 places WTI precariously close to further support at $85.07 (S1). Resistance has formed around the $86.87 (R1) to $88.67 (R3) range. The ADX indicator across multiple timeframes (1H: 37.6, 4H: 30.33, 1D: 38.29) strongly suggests a bearish trend is in place, reinforcing the price action.
Looking ahead to the coming week, the market will be closely monitoring US inventory data for any signs of a trend continuation or reversal. Geopolitical developments in the Middle East remain a wildcard; any flare-up could invalidate the current bearish outlook. Key levels to watch are the $85.07 support and the $86.87 resistance. A break below the former could target $83.27, while a sustained move above the latter might signal a short-term recovery towards $88.67.
| Indicator | Value | Signal | Interpretation |
|---|---|---|---|
| RSI (14) | 37.67 | Bearish | Below 50, confirms bearish momentum on 1H. |
| MACD Histogram | -1.25 | Bearish | Negative momentum on 1H, below signal line. |
| Stochastic | K=42.07, D=22.86 | Bullish Crossover | Potential for short-term bounce, but trend is down. |
| ADX | 37.6 | Strong Trend | Confirms strong bearish trend on 1H. |
| Bollinger Bands (1H) | Price below middle band | Bearish | Suggests downward pressure. |
Frequently Asked Questions: WTI Analysis
What happens if WTI Crude Oil breaks below the $85.07 support level?
If WTI closes decisively below the $85.07 support, it would likely trigger further selling pressure, targeting the $83.27 level. This would confirm the bearish scenario indicated by the strong ADX readings and negative momentum on shorter timeframes.
Should I buy WTI at current levels near $86.42 given the oversold Stochastic signals?
Buying solely based on oversold Stochastic signals at $86.42 carries significant risk. While a short-term bounce is possible, the overall trend remains bearish, confirmed by ADX and RSI. A safer approach would be to wait for confirmation of a bullish reversal, such as a break above $88.67, or to wait for price to approach the $83.27 support for a potentially better risk/reward setup.
Is the RSI at 37.67 a sell signal for WTI Crude Oil right now?
An RSI of 37.67 on the 1-hour chart indicates bearish momentum but is not yet in oversold territory. While it supports the bearish outlook, it's not an immediate sell signal on its own. Traders often look for RSI to move below 30 for oversold conditions or for divergence patterns to signal potential reversals. The current level suggests the downtrend has room to continue before hitting extreme oversold levels.
How will upcoming US crude oil inventory data affect WTI prices this week?
Another significant build in US crude oil inventories, similar to the recent 207k barrel increase, would likely reinforce the bearish sentiment and could push WTI prices towards the $83.27 support. Conversely, a surprise draw would challenge the current narrative and could spark a short-covering rally, potentially targeting resistance near $88.67.
Track markets in real-time
AI-powered analysis, technical indicators and real-time price data.
Join Our Telegram Channel
Breaking market news, AI analysis and trading signals instantly.
Join Channel