

The global financial markets are entering a crucial phase as the SP500, a bellwether for US equity sentiment, hovers around the significant $6,572.87 mark. Last week presented a complex picture, with initial strength giving way to renewed selling pressure, leaving investors to decipher whether this is a mere pause or the precursor to a deeper correction. The interplay between macroeconomic data, central bank policy expectations, and geopolitical tensions continues to dictate market movements, creating a challenging environment for traders and investors alike. Understanding the nuances of these forces is paramount for navigating the current landscape and positioning for the week ahead. This analysis delves into the technical underpinnings of the SP500, examining key indicators and levels that will likely shape market action in the coming days, while also considering the broader economic context that underpins these movements.
- The SP500 closed the week around $6,572.87, with significant selling pressure observed.
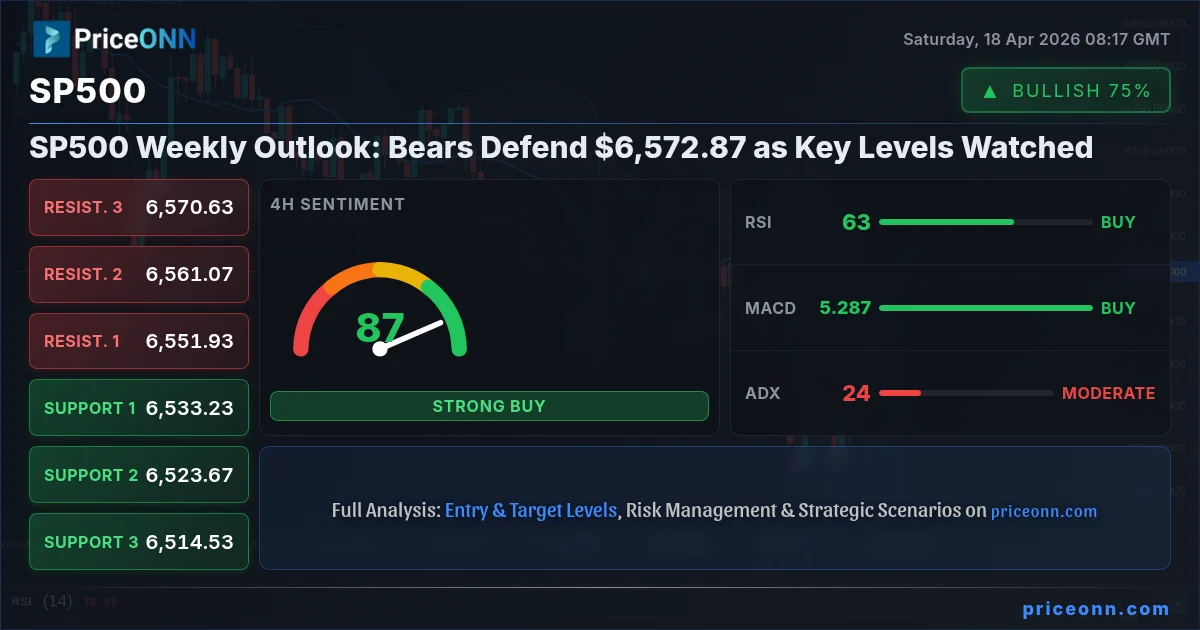
- Key support for the SP500 is currently holding at $6,533.23 on the 4-hour chart, while resistance looms at $6,551.93.
- RSI readings across multiple timeframes suggest caution, with the daily RSI at 45.35 indicating room for further downside.
- The ADX indicator on the daily chart at 47.51 signals a strong downtrend is in play, reinforcing bearish sentiment.
- Market sentiment remains cautious, influenced by persistent inflation concerns and the Federal Reserve's hawkish stance on interest rates.
Navigating the Choppy Waters: SP500's Battle at Key Levels
The Week in Review: A Tale of Two Halves
Last week was a potent reminder that market trends are rarely linear. The SP500 began the trading week on a strong footing, buoyed by positive sentiment and a seemingly resilient economic outlook. Initial price action saw the index climb, testing higher levels and creating optimism among bulls. However, this optimism proved to be short-lived as the latter half of the week witnessed a significant shift in momentum. Selling pressure intensified, particularly on Friday, pushing the SP500 down from its weekly highs to close near $6,572.87. This reversal highlights the underlying fragility in the market and the sensitivity of equities to shifts in macroeconomic narratives and risk appetite. The daily change of +0.74% on Friday, while seemingly positive in isolation, masks the broader intraday weakness and the failure to hold earlier gains, a classic sign of waning bullish conviction.
The price action suggests that while there are pockets of buying interest, particularly on dips, the bears are successfully defending key resistance levels. The intraday range on Friday, from 6522.1 to 6580.1, illustrates this tug-of-war. The inability to decisively break above the upper bounds and sustain the move points to significant overhead supply. This pattern of early-week gains being eroded by late-week losses is a recurring theme, indicating a market grappling with conflicting signals and a lack of clear direction. Investors are keenly watching to see if the current levels can hold, or if the bears will manage to push the index lower, potentially testing more significant support zones in the process. The current price of $6,572.87 is not merely a number; it represents a critical juncture where the short-term trend is being decided.
Technical Indicators Signal Caution: What the Charts Are Saying
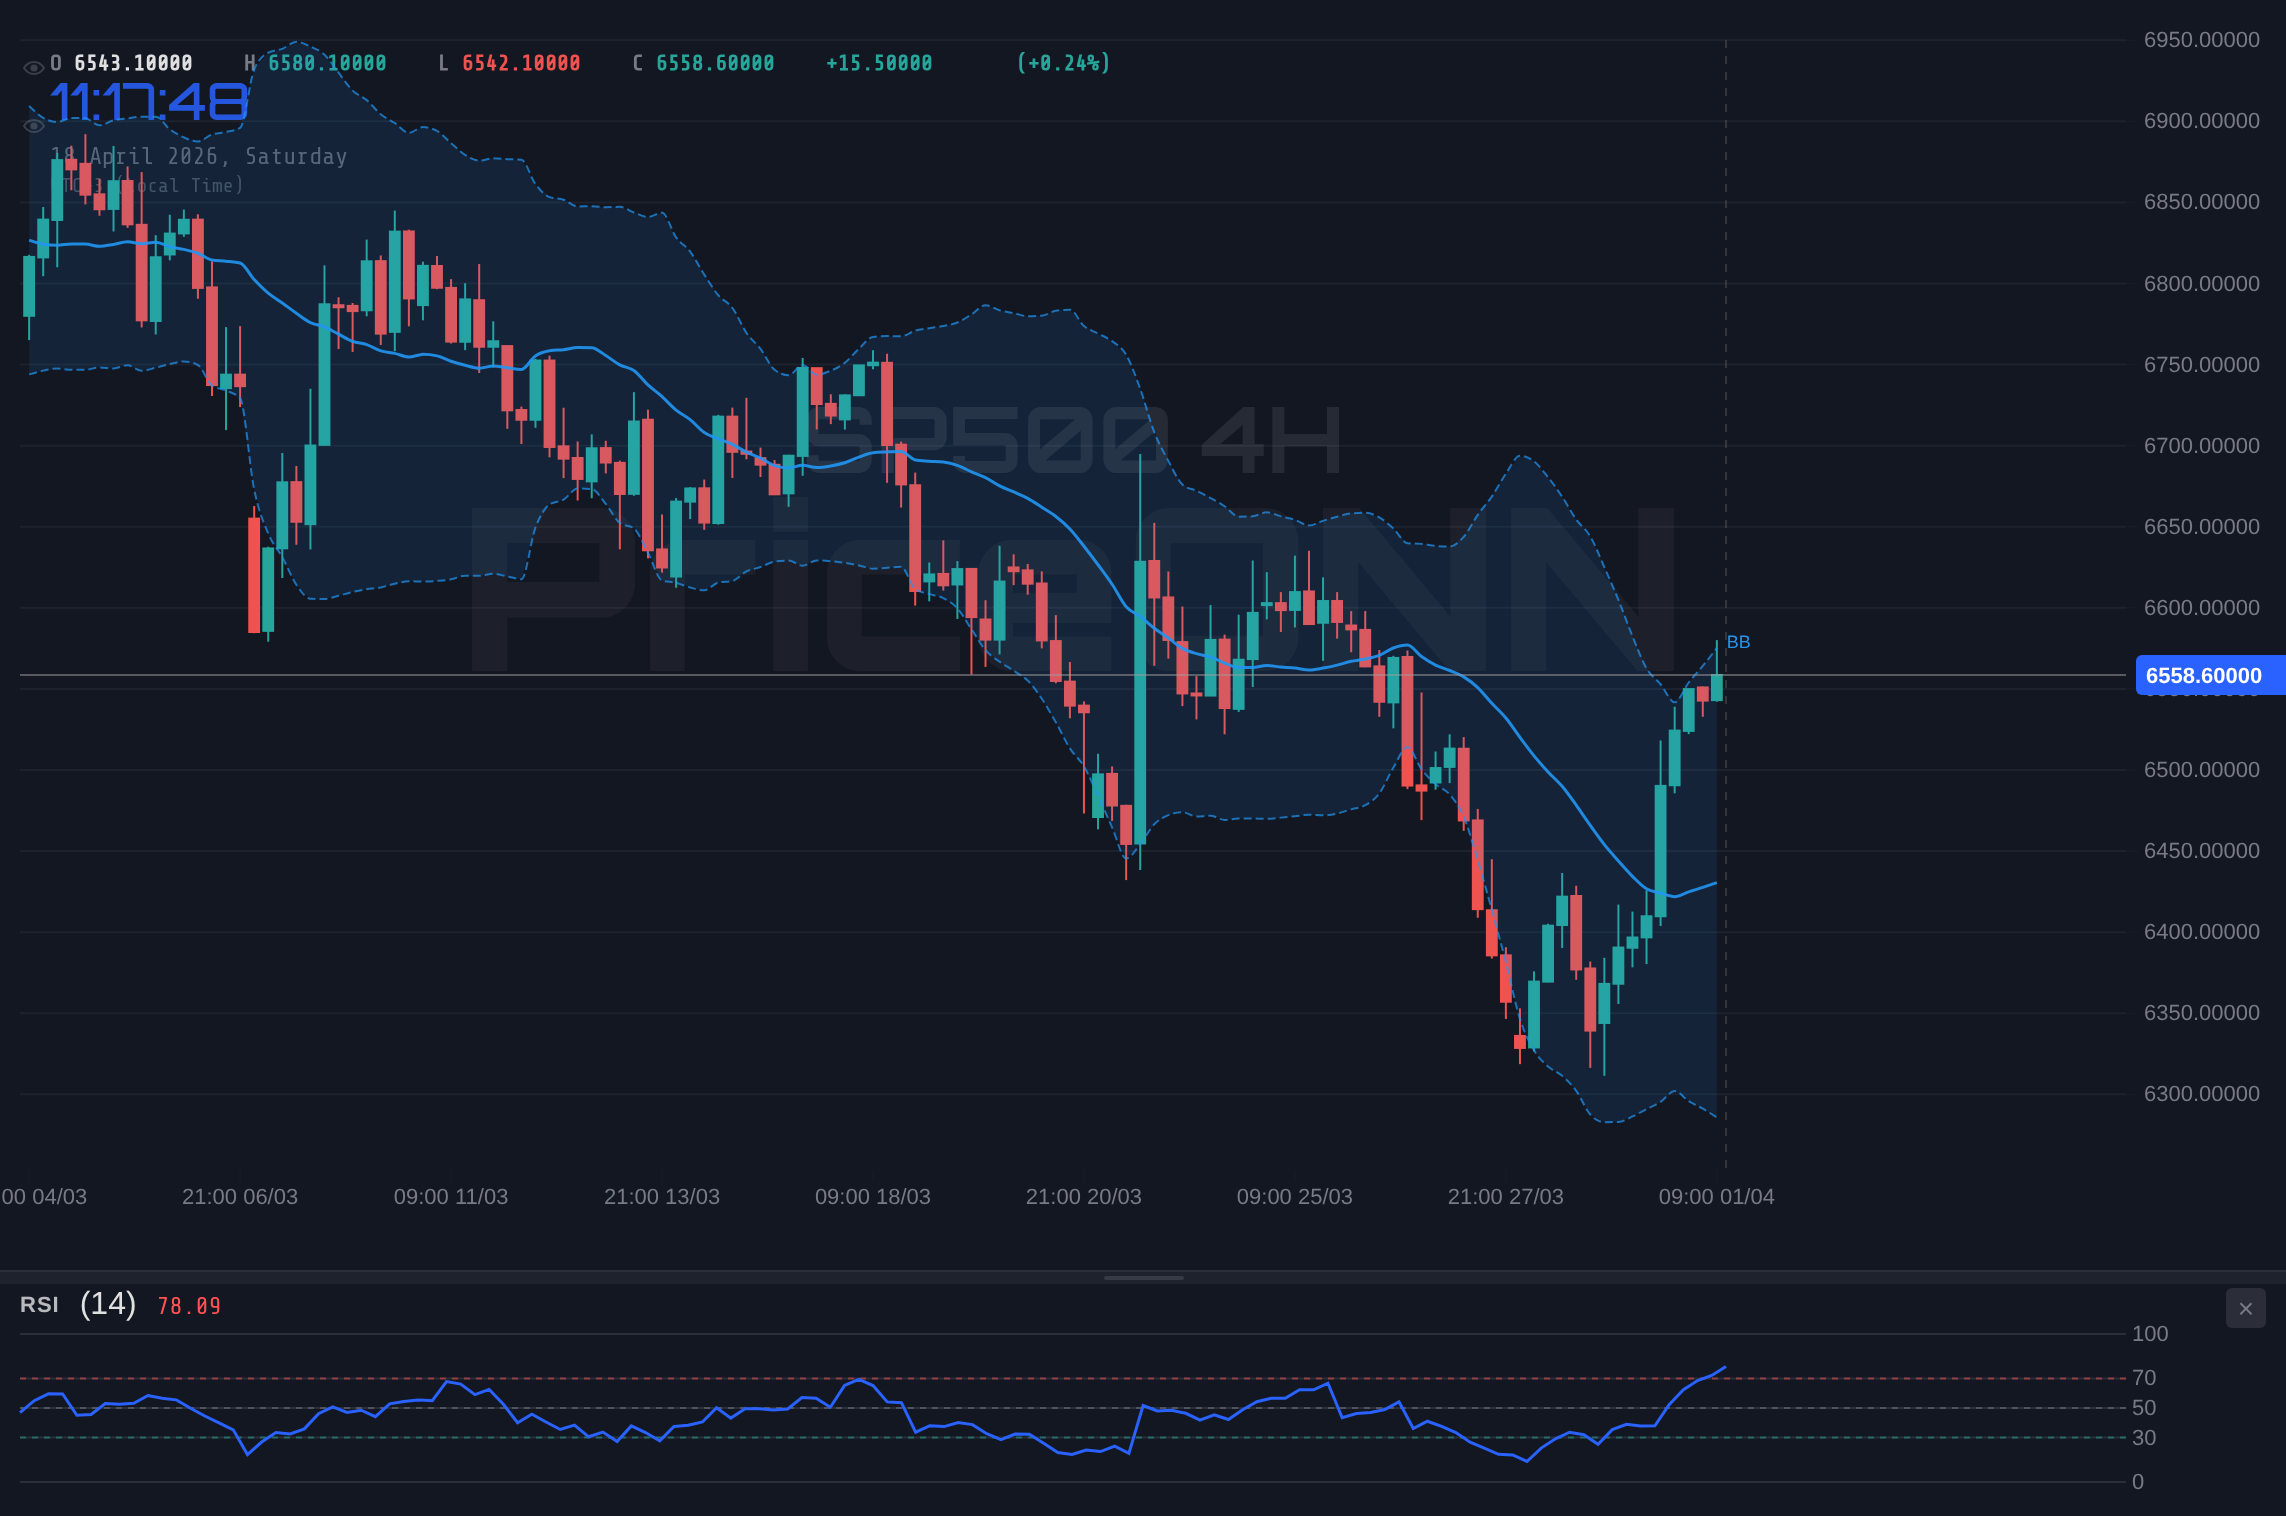
From a technical standpoint, the SP500 presents a mixed but leaning bearish picture across different timeframes. On the 1-hour chart, the trend is classified as 'Bullish' with a power of 100%, but this is juxtaposed with a MACD that shows negative momentum and Stochastic Oscillator indicating a potential pullback (%K
Delving into the 4-hour timeframe, the trend is marked as 'Neutral' with 50% power. Here, the MACD is positive, and the Stochastic shows an oversold condition, suggesting a potential bounce. However, the ADX at 24.23 indicates only a moderate trend strength, meaning any upward move might lack conviction. The daily chart paints a more concerning picture. The trend is 'Bearish' with 100% power. The RSI at 45.35, while not deeply oversold, indicates more room for a decline before finding significant buying interest. The MACD is showing negative momentum, and the Stochastic Oscillator, though suggesting a potential bounce with %K > %D, is emerging from oversold territory, which can be less reliable in a strong downtrend. The ADX on the daily chart stands at a robust 47.51, confirming a strong downtrend is in play. This is a critical reading, suggesting that the prevailing market condition is one of directional selling pressure, and any rallies are likely to be met with resistance.
The confluence of these indicators across timeframes paints a picture of a market under pressure. While short-term charts might show some resilience or overbought conditions that could lead to minor bounces, the longer-term daily trend is decidedly bearish, supported by strong ADX readings. The failure to hold onto gains on Friday further reinforces this bearish outlook. Traders are watching the $6,533.23 support level closely on the 4-hour chart; a break below this could trigger further downside, while resistance at $6,551.93 on the same timeframe needs to be cleared for any significant bullish reversal to gain traction. The overall technical sentiment is one of caution, with the strong daily downtrend signal from the ADX being a dominant factor.
Correlation Analysis: The Dollar's Shadow and Equity Sentiment
The DXY's Grip: A Stronger Dollar's Impact
The Dollar Index (DXY) continues to exert a significant influence on global markets, and its recent movements are crucial for understanding the SP500's trajectory. With the DXY currently trading at 97.9, a level that has seen some consolidation but maintains a generally firm undertone, its correlation with risk assets like the SP500 remains a key consideration. Historically, a strengthening dollar often correlates with pressure on US equities, as it makes American exports more expensive and can signal tighter global financial conditions or a flight to safety, which paradoxically can sometimes weigh on stocks even as the dollar benefits.
On the 1-hour chart, the DXY shows a neutral trend but with a bullish signal, RSI at 56.83, and Stochastic indicating a rise. The 4-hour chart, however, shows a neutral trend with a bearish signal and RSI at 47.84. The daily chart presents a clearer bearish picture for the dollar index, with a neutral trend, a bearish RSI of 40.62, and negative MACD momentum. This mixed signal from the DXY itself adds another layer of complexity. If the dollar were to show a sustained move lower, it could provide some relief to the SP500, as it might indicate a decrease in safe-haven demand or a shift in global monetary policy expectations. Conversely, any resurgence in the dollar, perhaps fueled by unexpected hawkish commentary from the Fed or escalating geopolitical risks, could quickly put the SP500 back under pressure. The current level of the DXY at 97.9 suggests a watchful stance is appropriate, as its next directional move could be a significant catalyst for equity markets.
Risk Appetite and Equity Correlation
The relationship between major equity indices like the SP500 and Nasdaq, and the broader market's risk appetite, is a well-established dynamic. When risk sentiment is buoyant, investors tend to favor growth-oriented assets, pushing indices like the Nasdaq 100 (currently at 26682.75, up 1.45% on the day) and the SP500 higher. Conversely, a decline in risk appetite, often triggered by macroeconomic uncertainty, geopolitical shocks, or fears of an economic slowdown, typically leads to a sell-off in equities and a move towards perceived safe-haven assets such as gold or US Treasuries. The SP500's intraday volatility on Friday, coupled with the late-week decline, suggests that risk sentiment is becoming more fragile.
The Dow Jones Industrial Average, trading at 49470.5 and showing a strong daily gain of 1.74%, might appear to contradict this caution. However, the underlying momentum and technical signals are crucial. The Nasdaq 100, with its 1-hour RSI at 72.58 and 4-hour RSI at 86.86, is showing signs of being significantly overbought, indicating a potential for a sharp pullback. Similarly, the Dow Jones' 1-hour RSI at 73.42 and 4-hour RSI at 78.1 also point towards overbought conditions. This suggests that the broad market gains seen on Friday might be unsustainable, especially if broader risk sentiment deteriorates. The correlation between these indices and the SP500 means that any significant move in one is likely to be mirrored, to some extent, by the others. The current environment, characterized by mixed signals from the DXY and overbought conditions in some equity indices, points towards increased choppiness ahead.
Economic Calendar and Fed Watch: Inflation Remains the Key
Inflation Data: The Fed's Persistent Headache
The economic calendar, though lighter on high-impact events this past week due to the weekend, has been dominated by lingering inflation concerns. While some data points have shown signs of moderation, the overall picture remains one where inflation is proving more persistent than initially anticipated. The latest figures for core PCE, a key inflation metric closely watched by the Federal Reserve, have shown a stubbornness around the 3.5% mark. This persistent inflation is the primary reason behind the Fed's current monetary policy stance. Futures markets pricing in Fed funds rate expectations indicate a growing probability that the Fed might need to maintain higher interest rates for longer than previously expected, or even consider further hikes if inflation does not show a more decisive trend downwards.
The implications for the SP500 are significant. Higher-for-longer interest rates tend to dampen economic growth, increase borrowing costs for corporations, and reduce the present value of future earnings, all of which are headwinds for equities. While the market has shown resilience, digesting various data points, the underlying inflationary pressure remains a critical overhang. Any upcoming data that suggests inflation is re-accelerating or failing to recede towards the Fed's 2% target could trigger a sharp repricing of risk assets. Conversely, a significant and sustained drop in inflation would likely be met with a strong rally in equities, as it would open the door for the Fed to pivot towards a more accommodative stance.
Upcoming Data and Market Expectations
Looking ahead, the economic calendar holds several potentially market-moving events. While this past week was relatively quiet, the coming days will bring a fresh batch of high-impact data. Notably, upcoming retail sales figures will provide insight into consumer spending, a crucial component of economic growth. A significant miss or beat in these numbers could dramatically influence market sentiment and Fed expectations. Similarly, employment data, including the Non-Farm Payrolls (NFP) report, will be closely scrutinized. Strong job growth could be a double-edged sword: positive for the economy but potentially negative for equities if it fuels inflation fears and reinforces a hawkish Fed stance.
The market's reaction to economic data has become increasingly sensitive. Traders are meticulously analyzing the 'actual' versus 'forecast' numbers, looking for any deviation that might signal a change in the economic trajectory or the Fed's policy path. For instance, if upcoming US retail sales data shows a significant slowdown, it could be interpreted as a sign of weakening consumer demand, potentially leading to a dovish shift in Fed expectations and a rally in the SP500. However, if the data surprises to the upside, it might lead to concerns about sticky inflation and a hawkish Fed, putting downward pressure on the index. The current price of SP500 at $6,572.87 is particularly sensitive to these upcoming releases, as they could provide the catalyst needed to break current trading ranges.
Geopolitical Undercurrents: Oil Prices and Global Stability
The Strait of Hormuz and Oil Price Volatility
Recent geopolitical developments, particularly concerning the Strait of Hormuz and its impact on oil prices, have added another layer of complexity to the market outlook. Reports of Iran reopening the Strait amidst a fragile ceasefire initially sent crude oil prices plunging by as much as 10%. Brent crude, for example, saw a dramatic drop from over $100 to around $92.54, while WTI followed suit, falling from $93.22 to $86.42. This significant decline in oil prices, if sustained, could have a deflationary effect on the global economy, potentially easing some inflationary pressures.
However, the situation remains fluid. The reopening of the Strait, while reducing immediate supply disruption fears, does not eliminate underlying geopolitical tensions in the Middle East. The market remains vigilant for any signs of escalation or disruption, which could quickly reverse the recent decline in oil prices. Higher oil prices have a direct impact on inflation expectations and consumer spending, particularly in countries heavily reliant on energy imports, such as the US and Canada. The surge in gasoline prices has already been a point of concern, potentially pushing Canadian inflation past 3% in April. A sustained drop in oil prices, conversely, could ease these concerns, but the market's reaction to the initial price collapse suggests a significant risk premium had been priced in. The current price of Brent at $92.54 and WTI at $86.42 are levels to watch closely for any signs of stabilization or further decline, which could influence broader market sentiment.
Safe-Haven Demand and Currency Shifts
In times of geopolitical uncertainty and market volatility, safe-haven assets often see increased demand. Gold, currently trading around $4,834.08, has seen some gains, with prices surging by 1.61% earlier in response to shifting macro winds and the Strait of Hormuz reopening narrative. While the initial reaction saw a price dip, the underlying demand for gold as a hedge against inflation and geopolitical risk remains. Silver, at $81, has also shown a strong upward move, outperforming gold in percentage terms, indicating a broader appetite for precious metals amidst uncertainty.
The interplay between these safe-haven assets and major currency pairs provides further context. The USD/CAD, for instance, has fallen for five consecutive sessions, reaching three-week lows below 1.3700, partly due to the strengthening Canadian dollar, which is benefiting from the oil price fluctuations. The strengthening Loonie reflects the market's assessment of the oil price impact on the Canadian economy. Meanwhile, EURUSD is trading at 1.17634, showing a slight daily decline, while USDJPY is at 158.625, also experiencing a slight pullback. These currency movements are influenced by a complex mix of relative interest rate expectations, risk sentiment, and commodity price movements. The SP500's correlation with these broader market forces means that any significant shifts in geopolitical stability or commodity prices will likely be reflected in equity performance.
Trade Scenarios for SP500: Navigating the Uncertainty
Given the current technical and fundamental landscape, several scenarios could unfold for the SP500. The market is at a critical juncture, with conflicting signals from various indicators and a lack of clear direction from macroeconomic data. The price action around $6,572.87 will be key in determining the short-to-medium term trend. The following scenarios outline potential paths forward, considering the prevailing market conditions and key levels.
Bearish Scenario: Downtrend Resumes
65% ProbabilityConsolidation Scenario: Range-Bound Trading
25% ProbabilityBullish Scenario: Reversal Attempt
10% ProbabilityKey Levels and Technical Summary
| Indicator | Value | Signal | Interpretation |
|---|---|---|---|
| RSI (14) | 45.35 | Bearish | Daily RSI indicates room for downside. |
| MACD Histogram | - | Bearish | Negative momentum on daily chart. |
| Stochastic | K=42.97, D=29.88 | Bullish (potential bounce) | Emerging from oversold, but weak in downtrend. |
| ADX | 47.51 | Strong Trend | Confirms strong downtrend on daily chart. |
| Bollinger Bands | Middle Band | Watch | Price below middle band on daily chart. |
The technical indicators present a predominantly bearish outlook for the SP500 on the daily timeframe, primarily driven by the strong ADX reading of 47.51, which confirms a robust downtrend. While the Stochastic Oscillator hints at a potential short-term bounce as it emerges from oversold conditions, this is often a less reliable signal within a strong bearish trend. The RSI at 45.35 suggests there is still ample room for prices to fall before hitting deeply oversold territory, further supporting the bearish case. The MACD histogram reinforcing negative momentum adds to the cautious sentiment. The current price action around $6,572.87, coupled with the failure to hold earlier gains on Friday, reinforces the view that the bears are currently in control. Resistance at $6,551.93 and $6,561.07 on the 4-hour chart are critical levels to watch. A break below the 4-hour support at $6,533.23 would likely accelerate selling pressure, targeting $6,523.67 and potentially lower.
FAQ Section: Decoding the SP500's Next Move
Frequently Asked Questions: SP500 Analysis
What happens if SP500 breaks below the $6,533.23 support level?
A break below the $6,533.23 support on the 4-hour chart would invalidate the current neutral stance and likely trigger a bearish scenario. This could lead to a rapid decline towards the next support at $6,523.67, as stop-loss orders are expected to be triggered. The strong daily downtrend indicated by the ADX at 47.51 suggests that such a breakdown could be significant.
Should I consider buying SP500 at current levels around $6,572.87 given the mixed signals?
Buying at current levels around $6,572.87 carries significant risk due to the prevailing bearish trend on the daily chart. While short-term indicators might hint at a bounce, the strong ADX and RSI readings suggest caution. A more prudent approach would be to wait for confirmation of a bullish reversal, such as a sustained break above $6,605.07 resistance, or to look for selling opportunities on rallies towards resistance levels.
Is the RSI at 45.35 on the daily chart a sell signal for SP500?
An RSI of 45.35 on the daily chart is not inherently a sell signal; it indicates a bearish bias but suggests there is still room for prices to decline before reaching oversold conditions. In a strong downtrend, RSI can remain in bearish territory for extended periods. Therefore, while it supports the bearish outlook, it should be considered alongside other indicators like the ADX and MACD for confirmation.
How will upcoming US retail sales data affect SP500 around $6,572.87?
Upcoming US retail sales data could be a major catalyst for the SP500 at $6,572.87. If the data significantly misses expectations, it could signal weakening consumer demand, potentially leading to dovish Fed expectations and a rally in equities. Conversely, a strong beat might fuel inflation concerns, leading to hawkish Fed expectations and downward pressure on the SP500. Traders will be watching closely for any deviation from the forecast of 10.3.
The path forward for the SP500 remains uncertain, with the market caught between persistent inflation concerns and the potential for a Fed pivot. The technical picture, particularly on the daily chart, leans bearish, with key support levels at $6,533.23 and $6,523.67 being closely watched. A decisive break below these levels could signal a deeper correction. However, the market is dynamic, and unexpected shifts in economic data or central bank policy could quickly alter the outlook. Investors must remain disciplined, manage risk effectively, and wait for clear setups. Patience and a strategy grounded in data are crucial for navigating these choppy waters.
Track markets in real-time
AI-powered analysis, technical indicators and real-time price data.
Join Our Telegram Channel
Breaking market news, AI analysis and trading signals instantly.
Join Channel