

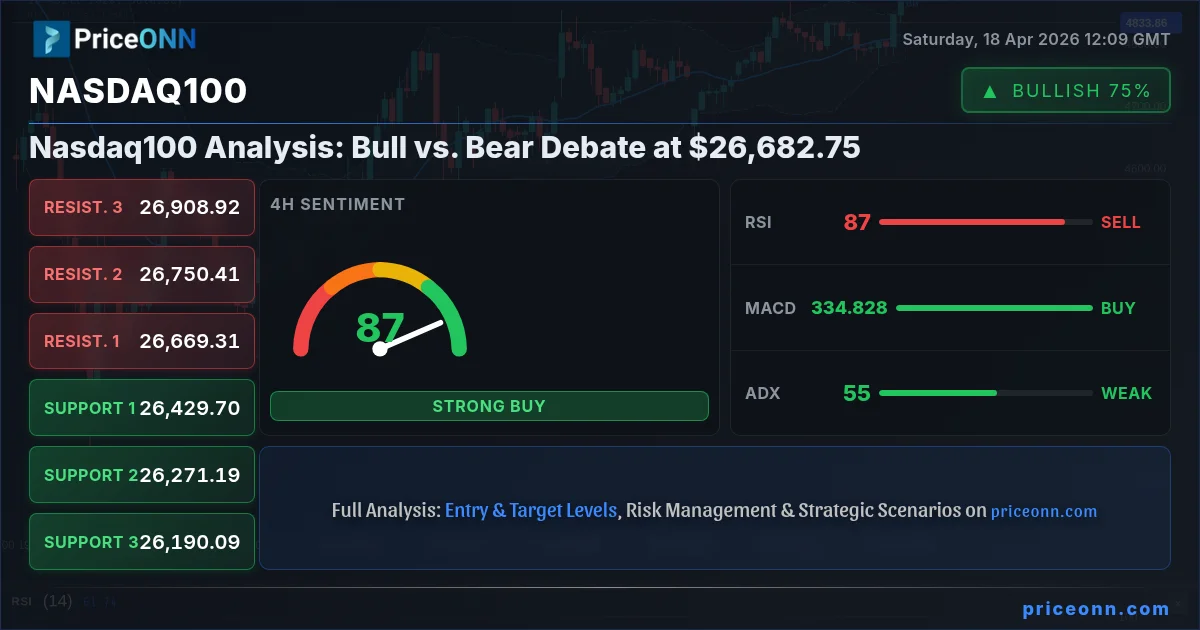
As the Nasdaq100 index stands at $26,682.75 following a notable 1.45% climb last week, the market is at a critical juncture. This gain, while significant, hasn't definitively settled the ongoing tug-of-war between optimistic bulls and cautious bears. The question on every trader's mind is whether this upward momentum is sustainable or merely a temporary reprieve before a potential downturn. The technical indicators present a mixed picture, with some suggesting continued strength while others flash warning signs of overextension. Furthermore, the macroeconomic landscape remains a complex tapestry of shifting central bank expectations, persistent inflation concerns, and geopolitical undercurrents that could easily sway market sentiment. Understanding the interplay of these factors is crucial for navigating the Nasdaq100's path forward.
- The Nasdaq100 closed last week at $26,682.75, up 1.45% for the week.
- Key support for the Nasdaq100 is identified at $26,527.88, while resistance looms at $26,722.07.
- RSI at 72.58 on the 1H chart signals overbought conditions, suggesting potential selling pressure.
- The Dollar Index (DXY) at 97.9 is showing mixed signals, influencing correlation with the Nasdaq100.
The Bullish Case: Momentum and Macro Tailwinds
Riding the Wave of Tech Strength
The bulls are certainly encouraged by the recent performance of the Nasdaq100, especially its ability to close above $26,682.75. This ascent was largely fueled by strong earnings reports from several key technology companies, which often form the backbone of the index. When giants like Apple, Microsoft, or Nvidia report better-than-expected results, it creates a ripple effect, boosting investor confidence and driving broader market participation. The 1.45% gain last week wasn't just a random tick up; it was supported by tangible corporate performance that reassures investors about the underlying health of the tech sector. This optimism can be self-fulfilling, as positive sentiment encourages more buying, pushing prices higher and attracting further investment. The 4H chart shows a strong upward trend (Power: 92%), with ADX at 23.31 indicating a moderately strong trend. This suggests that the underlying momentum, for those looking at the medium term, is indeed supportive of further gains.
Economic Data Supporting the Optimism
Beyond corporate earnings, certain macroeconomic indicators have provided a supportive backdrop for the Nasdaq100's advance. While inflation remains a concern, recent data points have offered glimmers of hope that the situation might be stabilizing. For instance, the EUR/USD's daily chart shows positive momentum with RSI at 60.87, suggesting a potential easing of inflationary pressures in major economies, which can indirectly benefit growth-oriented assets like tech stocks. The recent EUR data release showing actual inflation at 2.6% against a forecast of 2.5% also points towards inflation being managed, albeit still elevated. This scenario allows central banks, particularly the Federal Reserve, to maintain a more accommodative stance or at least pause aggressive tightening, which is generally positive for equity markets. The Nasdaq100, being a growth-focused index, tends to benefit significantly from lower interest rate expectations or a stable rate environment. The 1D Stochastic for Nasdaq100 is in overbought territory (K=98.1, D=98.12), which, while a warning sign for short-term traders, can also indicate strong underlying demand from a longer-term perspective. The fact that the index is pushing higher despite this overbought condition suggests robust buying interest.
Correlation with Risk Appetite
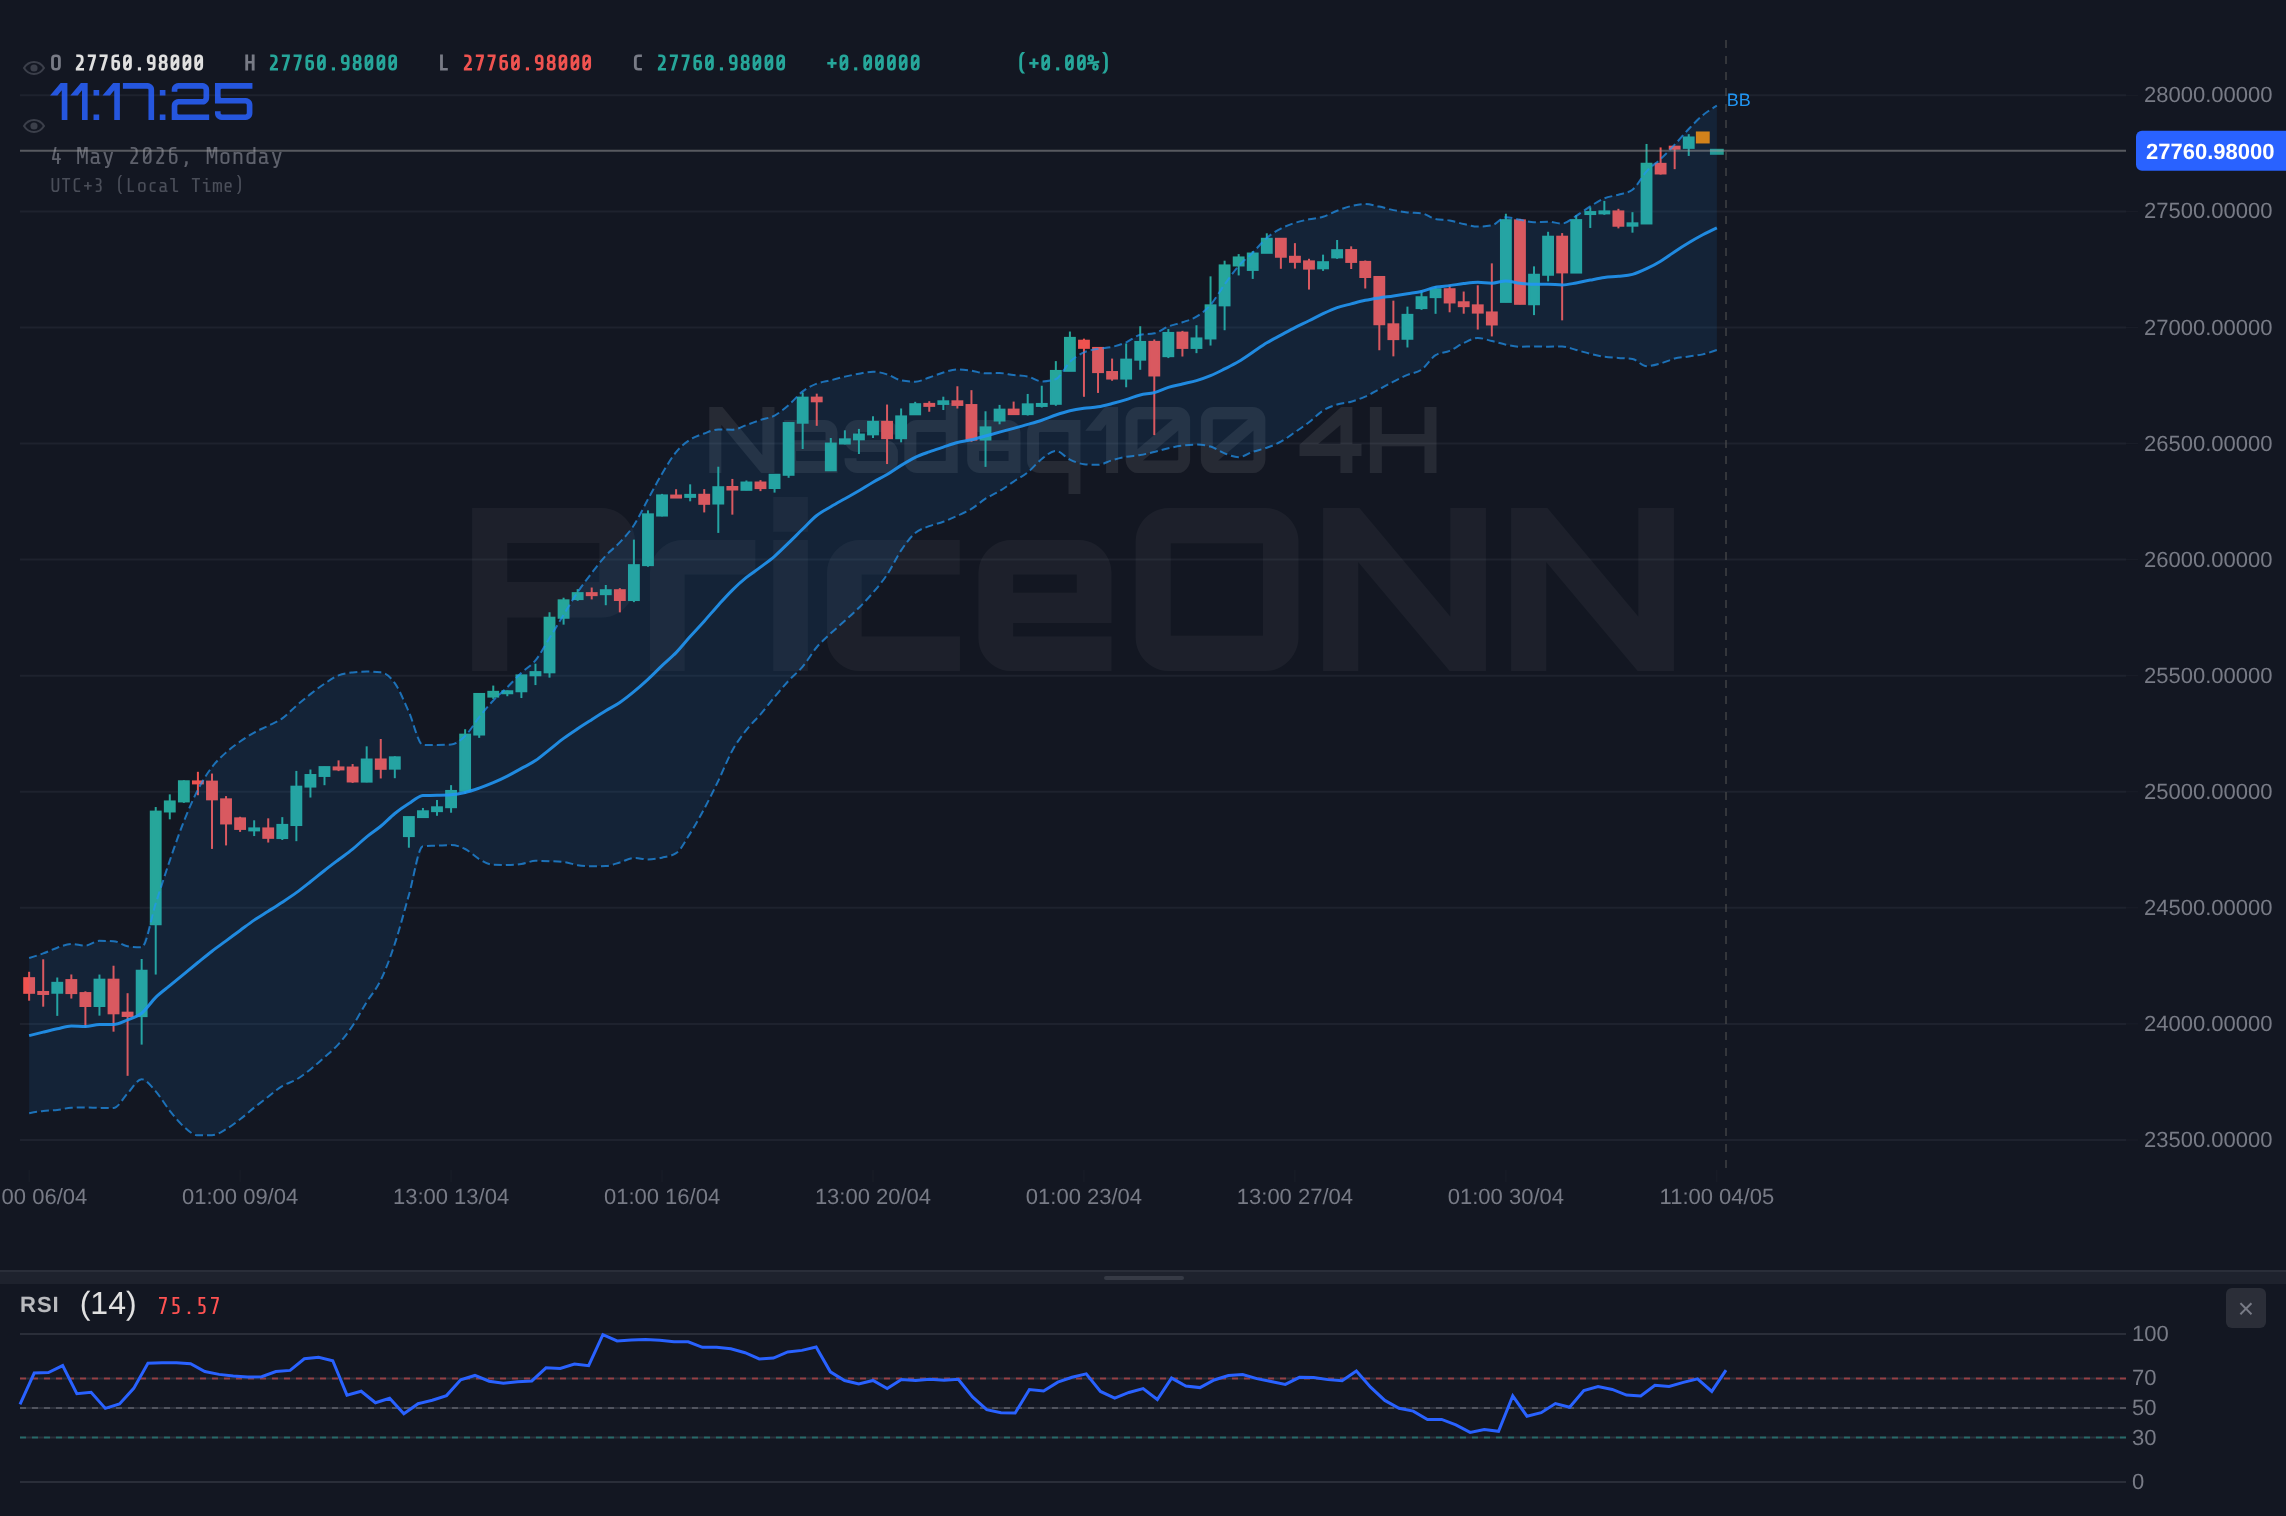
The Nasdaq100's performance is intrinsically linked to market risk appetite. When investors feel confident about the global economic outlook, they tend to favor growth assets, which include the tech-heavy Nasdaq. Last week, we saw a positive correlation with the S&P 500, which also experienced a gain of 0.74% to reach 6572.87. This broad market strength suggests a general increase in risk appetite, a favorable environment for the Nasdaq100. The Dow Jones Industrial Average also surged 1.74% to 49470.5, reinforcing the bullish sentiment across major US indices. This synchronized upward movement indicates that the market is not singling out tech stocks but rather embracing a broader risk-on sentiment. The DXY, or Dollar Index, at 97.9, showed a slight dip, which often correlates with increased risk appetite as investors move away from the safe-haven dollar. This decreased dollar strength can make US assets, including equities, more attractive to international investors.
Technical Signals Pointing Upwards (with Caveats)
Looking at the technical indicators, the 1H chart for the Nasdaq100 shows a strong bullish trend with an ADX of 34.16. The MACD is exhibiting positive momentum, with the MACD line above the signal line, suggesting that buying pressure is currently dominant. The price trading above the middle Bollinger Band also supports a bullish inclination on this timeframe. However, the RSI(14) at 72.58 on the 1H chart is a clear warning sign of an overbought condition. This suggests that the rally might be extended in the short term and could be due for a pause or a pullback. The Stochastic indicator on the 1H chart (K=81.18, D=85.83) also confirms this overbought state, with the %K line below the %D line, indicating a potential shift in momentum. On the 4H timeframe, the picture is even more bullish, with an ADX of 55.04 indicating a very strong upward trend. The RSI is at a very high 86.86, signaling extreme overbought conditions, which, while indicating strong upward momentum, also increases the risk of a sharp correction. The fact that the index has continued to climb despite these high RSI readings on multiple timeframes suggests that the underlying demand is exceptionally strong, potentially overriding short-term overbought signals.
The Bearish Case: Overbought Conditions and Macro Headwinds
The Danger of Extended Rallies
While the bulls celebrate the recent gains, the bears are quick to point out the signs of overextension. The Nasdaq100's RSI readings are flashing red across multiple timeframes. On the 1H chart, the RSI is at 72.58, firmly in overbought territory. On the 4H, it's even higher at 86.86, and on the daily chart, it sits at 75.28. Historically, when RSI enters such elevated zones, it often precedes a period of consolidation or a price correction. The Stochastic indicator echoes this concern. On the 1H, it's in overbought territory with K=81.18 and D=85.83, showing a potential bearish crossover. The 4H Stochastic is also overbought at K=93.64, D=87.02, and the daily Stochastic is at K=98.1, D=98.12, indicating extreme overbought conditions. This suggests that the market may have moved too far, too fast, and a pullback is becoming increasingly likely as early buyers look to take profits. The ADX on the 1H chart at 34.16 and 4H at 55.04 indicates strong trends, but strong trends can reverse sharply once momentum shifts. The bears argue that the market is due for a healthy correction to reset these indicators.
Inflationary Pressures and Central Bank Uncertainty
Despite some positive data points, the specter of inflation continues to loom large. The recent surge in oil prices, with Brent Crude at $92.54 and WTI at $86.42, is a significant concern. The higher cost of energy directly impacts transportation and production costs, which can feed into broader inflation. For example, the Canadian dollar's outlook is being clouded by a projected surge in inflation to 2.5% due to a 21% jump in gasoline prices. While the Nasdaq100 is less directly correlated with energy prices than other assets, sustained high energy costs can dampen consumer spending and corporate profit margins across the board. This could force central banks, particularly the Federal Reserve, to reconsider their stance on interest rates. If inflation proves more persistent than expected, the Fed might need to maintain higher rates for longer, or even consider further hikes, which would be a significant headwind for growth stocks. The daily RSI for the Nasdaq100 at 75.28, in conjunction with persistent inflation fears, suggests that the market might be pricing in a less dovish future than currently anticipated. The Fed's next move remains a key uncertainty, and any hawkish signals could trigger a sell-off.
Geopolitical Risks and 'Risk-Off' Sentiment
Geopolitical tensions remain a persistent source of market volatility. While some news suggests a fragile ceasefire in the Strait of Hormuz, the broader geopolitical landscape is far from stable. The ongoing conflict in Eastern Europe and tensions in the Middle East continue to cast a shadow over global economic stability. Such uncertainties can trigger 'risk-off' sentiment, where investors flee to safer assets like gold, US Treasuries, or even the US Dollar. If risk appetite falters, growth-oriented indices like the Nasdaq100 are typically the first to suffer. The DXY at 97.9 is currently showing mixed signals, but a significant geopolitical shock could see it strengthen as a safe haven, further pressuring the Nasdaq100. The bears argue that the market may be becoming complacent about these risks, and any escalation could lead to a sharp reversal. The fact that the S&P 500 is also showing signs of overbought conditions on its 1H chart (RSI 70.95) suggests that the broader market sentiment could turn quickly if negative news emerges.
The Danger of a 'Death Cross' or Bearish Divergence
While current momentum appears strong, bears are watching for potential bearish divergences and the dreaded 'death cross' on longer timeframes. A death cross occurs when a shorter-term moving average crosses below a longer-term moving average, often signaling a significant downtrend. While not yet present on the daily Nasdaq100 chart, such patterns can emerge quickly. More immediately, the MACD on the 1H chart shows negative momentum, with the MACD line below the signal line, despite the price rally. This divergence, where price makes new highs but the MACD fails to confirm, is a classic bearish signal. Similarly, the Stochastic on the 1H chart (K=81.18, D=85.83) shows a bearish crossover in overbought territory. Bears believe these are early warnings that the upward momentum is losing steam and that a significant correction is building. The ADX on the 1D chart at 22.43 is relatively weak, which can indicate that the current upward move might not have strong conviction behind it and could be vulnerable to a reversal. If the price fails to hold above the crucial support level of $26,527.88, these bearish signals could gain traction rapidly.
The Neutral Stance: Waiting for Clarity
Consolidation Near Key Levels
Given the conflicting signals from technical indicators and the mixed macroeconomic backdrop, a neutral stance might be the most prudent approach for now. The Nasdaq100 is currently trading at $26,682.75, a level that has seen significant price action. On the 1H chart, the index is oscillating around the $26,682.75 mark, with resistance identified at $26,722.07 and support at $26,527.88. This tight range suggests indecision in the market. Traders are likely waiting for a clearer catalyst – either a decisive break above resistance or a firm hold above support – before committing to a significant directional trade. The ADX on the 4H chart is 24.23, indicating a moderately strong trend, but the RSI at 62.83 suggests it's not yet in extreme territory, allowing room for further movement in either direction. This zone represents a battleground where bulls and bears are testing each other's resolve.
The Importance of Upcoming Economic Data
The immediate future of the Nasdaq100 will likely be heavily influenced by upcoming economic data releases. With key events such as US Retail Sales, and potentially more significant inflation reports on the horizon, traders are adopting a wait-and-see approach. The actual US Retail Sales data, which came in at 207 against a forecast of 213, indicates a slight miss, suggesting consumer spending might be cooling more than anticipated. This could put pressure on growth stocks if it points to broader economic weakness. Conversely, if future data shows resilience, it could reignite the bullish sentiment. The interpretation of these data points will be critical. For example, if inflation data continues to surprise to the upside, it could force the Fed's hand, leading to a hawkish pivot that would be detrimental to the Nasdaq100. The interplay between inflation, consumer spending, and central bank policy will be the dominant narrative in the coming days and weeks. The daily MACD, currently showing positive momentum, could quickly turn negative if macroeconomic data deteriorates significantly.
Watching the DXY and Global Correlations
The Dollar Index (DXY) at 97.9, while showing mixed signals across timeframes, remains a crucial correlation to watch. A strengthening dollar typically exerts downward pressure on US equities, including the Nasdaq100, as it makes US assets more expensive for foreign buyers and can signal a 'risk-off' environment. Conversely, a weakening dollar can provide a tailwind. Currently, the DXY's daily chart shows a bearish trend (ADX 26.2) and negative momentum (MACD), suggesting potential dollar weakness ahead. However, its 1H chart shows a bullish trend (ADX 22.12) and positive signals, indicating intraday strength. This divergence highlights the need for careful monitoring. Similarly, the performance of other major indices like the S&P 500 and Dow Jones 30 will offer clues about broader market sentiment. If these indices begin to falter while the Nasdaq100 continues to climb, it could signal a weakening of the overall trend and potential for a rotation out of tech.
Navigating Overbought Warnings
The elevated RSI and Stochastic readings across multiple timeframes cannot be ignored. While strong uptrends can sometimes push these indicators into extreme territory and stay there for extended periods, they also increase the probability of sharp reversals or significant pullbacks. A neutral stance acknowledges this risk. Traders might look for a period of consolidation around the $26,682.75 level, allowing these indicators to cool off. A break below the 1H support at $26,527.88 would be the first sign that the bearish case is gaining traction. Conversely, a decisive move and hold above the 1H resistance at $26,722.07 would suggest the bulls are regaining control. Until one of these levels is decisively breached, the market may remain range-bound, offering limited opportunities for aggressive directional trades.
The Verdict: A Cautious Bullish Outlook with Key Levels to Watch
Synthesizing the Evidence
After weighing the arguments, the evidence suggests a cautiously optimistic outlook for the Nasdaq100, but with significant caveats. The bullish case is supported by strong corporate earnings, a generally positive risk appetite reflected in other major indices, and the potential for a less hawkish central bank stance if inflation data cooperates. The 4H and 1D charts show robust upward trends, with ADX values indicating conviction. However, the bearish case cannot be ignored. The extreme overbought conditions indicated by RSI and Stochastic on multiple timeframes, coupled with persistent inflation risks and geopolitical uncertainties, present substantial headwinds. The bears have valid points about the market potentially overextending itself and being due for a correction. The neutral stance highlights the current indecision, with traders waiting for clearer signals from economic data and price action.
The Critical Levels
The $26,682.75 price point is more than just a number; it's a battleground. For the bulls to maintain control, holding above the immediate 1H support at $26,527.88 is paramount. A close below this level could signal the start of a pullback towards the 4H support at $26,429.70. On the upside, breaking decisively above the 1H resistance at $26,722.07 is necessary to reignite strong bullish momentum. A sustained move above this level could open the door to further targets, potentially pushing towards the 4H resistance at $26,908.92. The daily resistance level at $26,714.90 also acts as a significant hurdle.
The ADX on the daily chart at 22.43 indicates a trend that, while present, isn't overwhelmingly strong, suggesting that significant moves might require more fundamental catalysts. The MACD on the daily chart remains positive, but if it begins to show bearish divergence against price, it would be a strong warning signal for the bulls. The RSI at 75.28 on the daily chart suggests that even if the trend continues, the pace might slow, and a correction becomes more probable.
The Path Forward: Data Dependency
The Nasdaq100's trajectory in the coming week will be heavily data-dependent. Any signs of cooling inflation or continued consumer resilience could bolster the bullish case. Conversely, hotter inflation prints or weaker economic data could trigger a significant sell-off, validating the bears' concerns about overbought conditions and macro headwinds. Investors and traders will be scrutinizing every piece of economic news, from employment figures to central bank commentary, for clues about the future path of interest rates and economic growth. The market's reaction to these data points will likely dictate whether the Nasdaq100 continues its ascent or succumbs to profit-taking and macroeconomic pressures. The current price of $26,682.75 represents a delicate balance, and the next few days of trading will be crucial in determining the prevailing trend.
Ultimately, while the bulls have the momentum, the extreme overbought readings and potential macroeconomic headwinds warrant caution. A prudent approach involves watching key support and resistance levels, particularly the $26,527.88 support and $26,722.07 resistance. A clear break of either will likely dictate the next significant move. Until then, expect choppiness and a battle for control around the current levels.
Scenario Analysis for the Nasdaq100
Bearish Scenario: Pullback Looming
60% ProbabilityBullish Scenario: Resistance Breakout
30% ProbabilityNeutral Scenario: Consolidation Phase
10% Probability| Indicator | Value | Signal | Interpretation |
|---|---|---|---|
| RSI (14) | 72.58 | Overbought | Potential for pullback or consolidation. |
| MACD Histogram | Positive | Bullish Momentum | Suggests upward pressure, but watch for divergence. |
| Stochastic | K=81.18, D=85.83 | Overbought Crossover | Signals potential reversal in short term. |
| ADX | 34.16 | Strong Trend | Indicates trending market, but vulnerable to reversals. |
| Bollinger Bands | Above Middle Band | Bullish Inclination | Price action favors upside in the short term. |
Frequently Asked Questions: Nasdaq100 Analysis
What happens if the Nasdaq100 breaks below the $26,527.88 support level?
A break below $26,527.88 on the 1-hour chart would invalidate the immediate bullish momentum and could trigger a sell-off towards the $26,429.70 level. This would align with the bearish scenario, suggesting profit-taking and a potential deeper correction.
Should I consider buying the Nasdaq100 at current levels around $26,682.75 given the overbought RSI at 72.58?
Buying at current levels with RSI at 72.58 carries significant risk due to overbought conditions. While the trend is strong, waiting for a pullback to a key support like $26,527.88 or a consolidation phase to reset indicators would offer a more favorable risk-reward ratio.
Is the RSI at 72.58 a definitive sell signal for the Nasdaq100 right now?
An RSI of 72.58 on the 1-hour chart strongly suggests overbought conditions and increases the probability of a short-term pullback or consolidation. However, it is not a definitive sell signal on its own, especially in a strong uptrend where such readings can persist.
How might upcoming US Retail Sales data impact the Nasdaq100's price action near $26,682.75?
The actual US Retail Sales data came in at 207, missing the forecast of 213, suggesting softer consumer spending. If this trend continues, it could dampen economic growth expectations and put pressure on the Nasdaq100, potentially pushing it towards support levels.
Track markets in real-time
AI-powered analysis, technical indicators and real-time price data.
Join Our Telegram Channel
Breaking market news, AI analysis and trading signals instantly.
Join Channel