

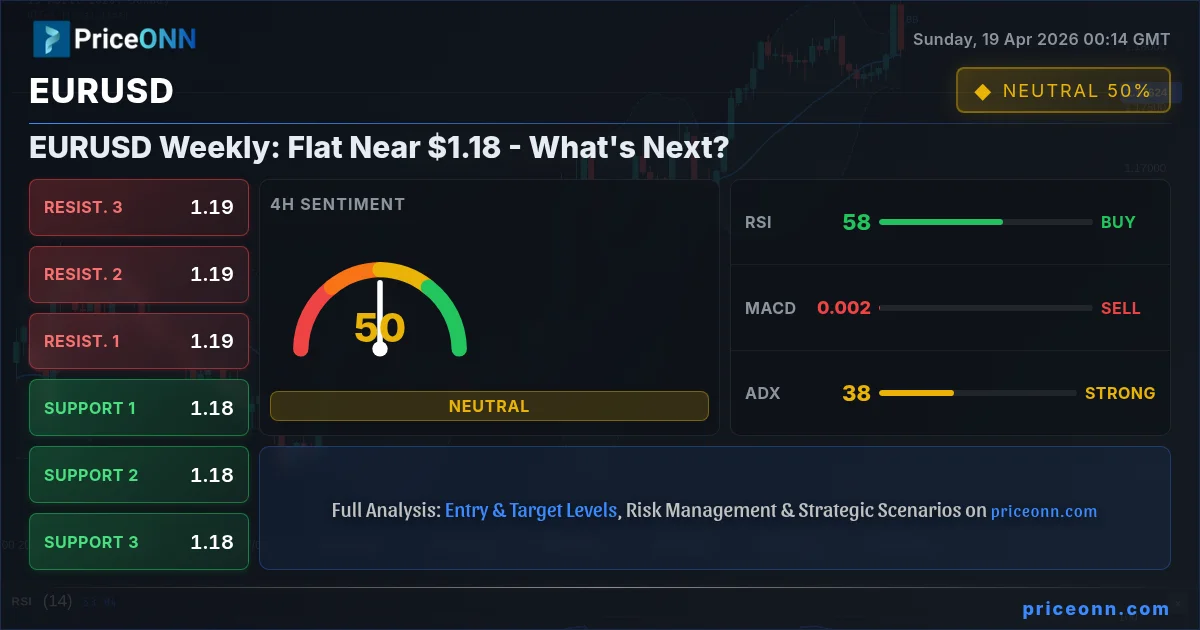
The EURUSD pair spent its past trading week largely treading water, hovering precariously near the 1.1760 handle. This period of consolidation, while offering a brief respite from the volatility seen in prior weeks, has left traders and investors in a state of watchful anticipation. The question on everyone's mind is whether this calm before the storm will give way to a decisive directional move in the upcoming trading week, or if the pair will remain locked in its current range-bound tug-of-war. The technical indicators are flashing a complex, often contradictory, set of signals, painting a picture of indecision that mirrors the broader market sentiment. With the Dollar Index (DXY) showing signs of stabilization after a recent pullback, and with crucial economic data releases on the horizon for both the Eurozone and the United States, the stage is set for a potentially pivotal week ahead for the world's most traded currency pair.
- EURUSD RSI at 38.74 on the 1H chart signals bearish momentum, while the 1D RSI at 60.87 indicates a neutral-to-bullish lean.
- Critical support for EURUSD is identified at $1.1760, with the next significant level at $1.1732. Resistance is eyed at $1.1811, followed by $1.1845.
- The MACD histogram on the 1H chart shows negative momentum, contrasting with positive momentum on the 1D chart, highlighting conflicting trends.
- With the DXY trading near 97.9, its correlation with EURUSD suggests potential downward pressure if the dollar index finds strength.
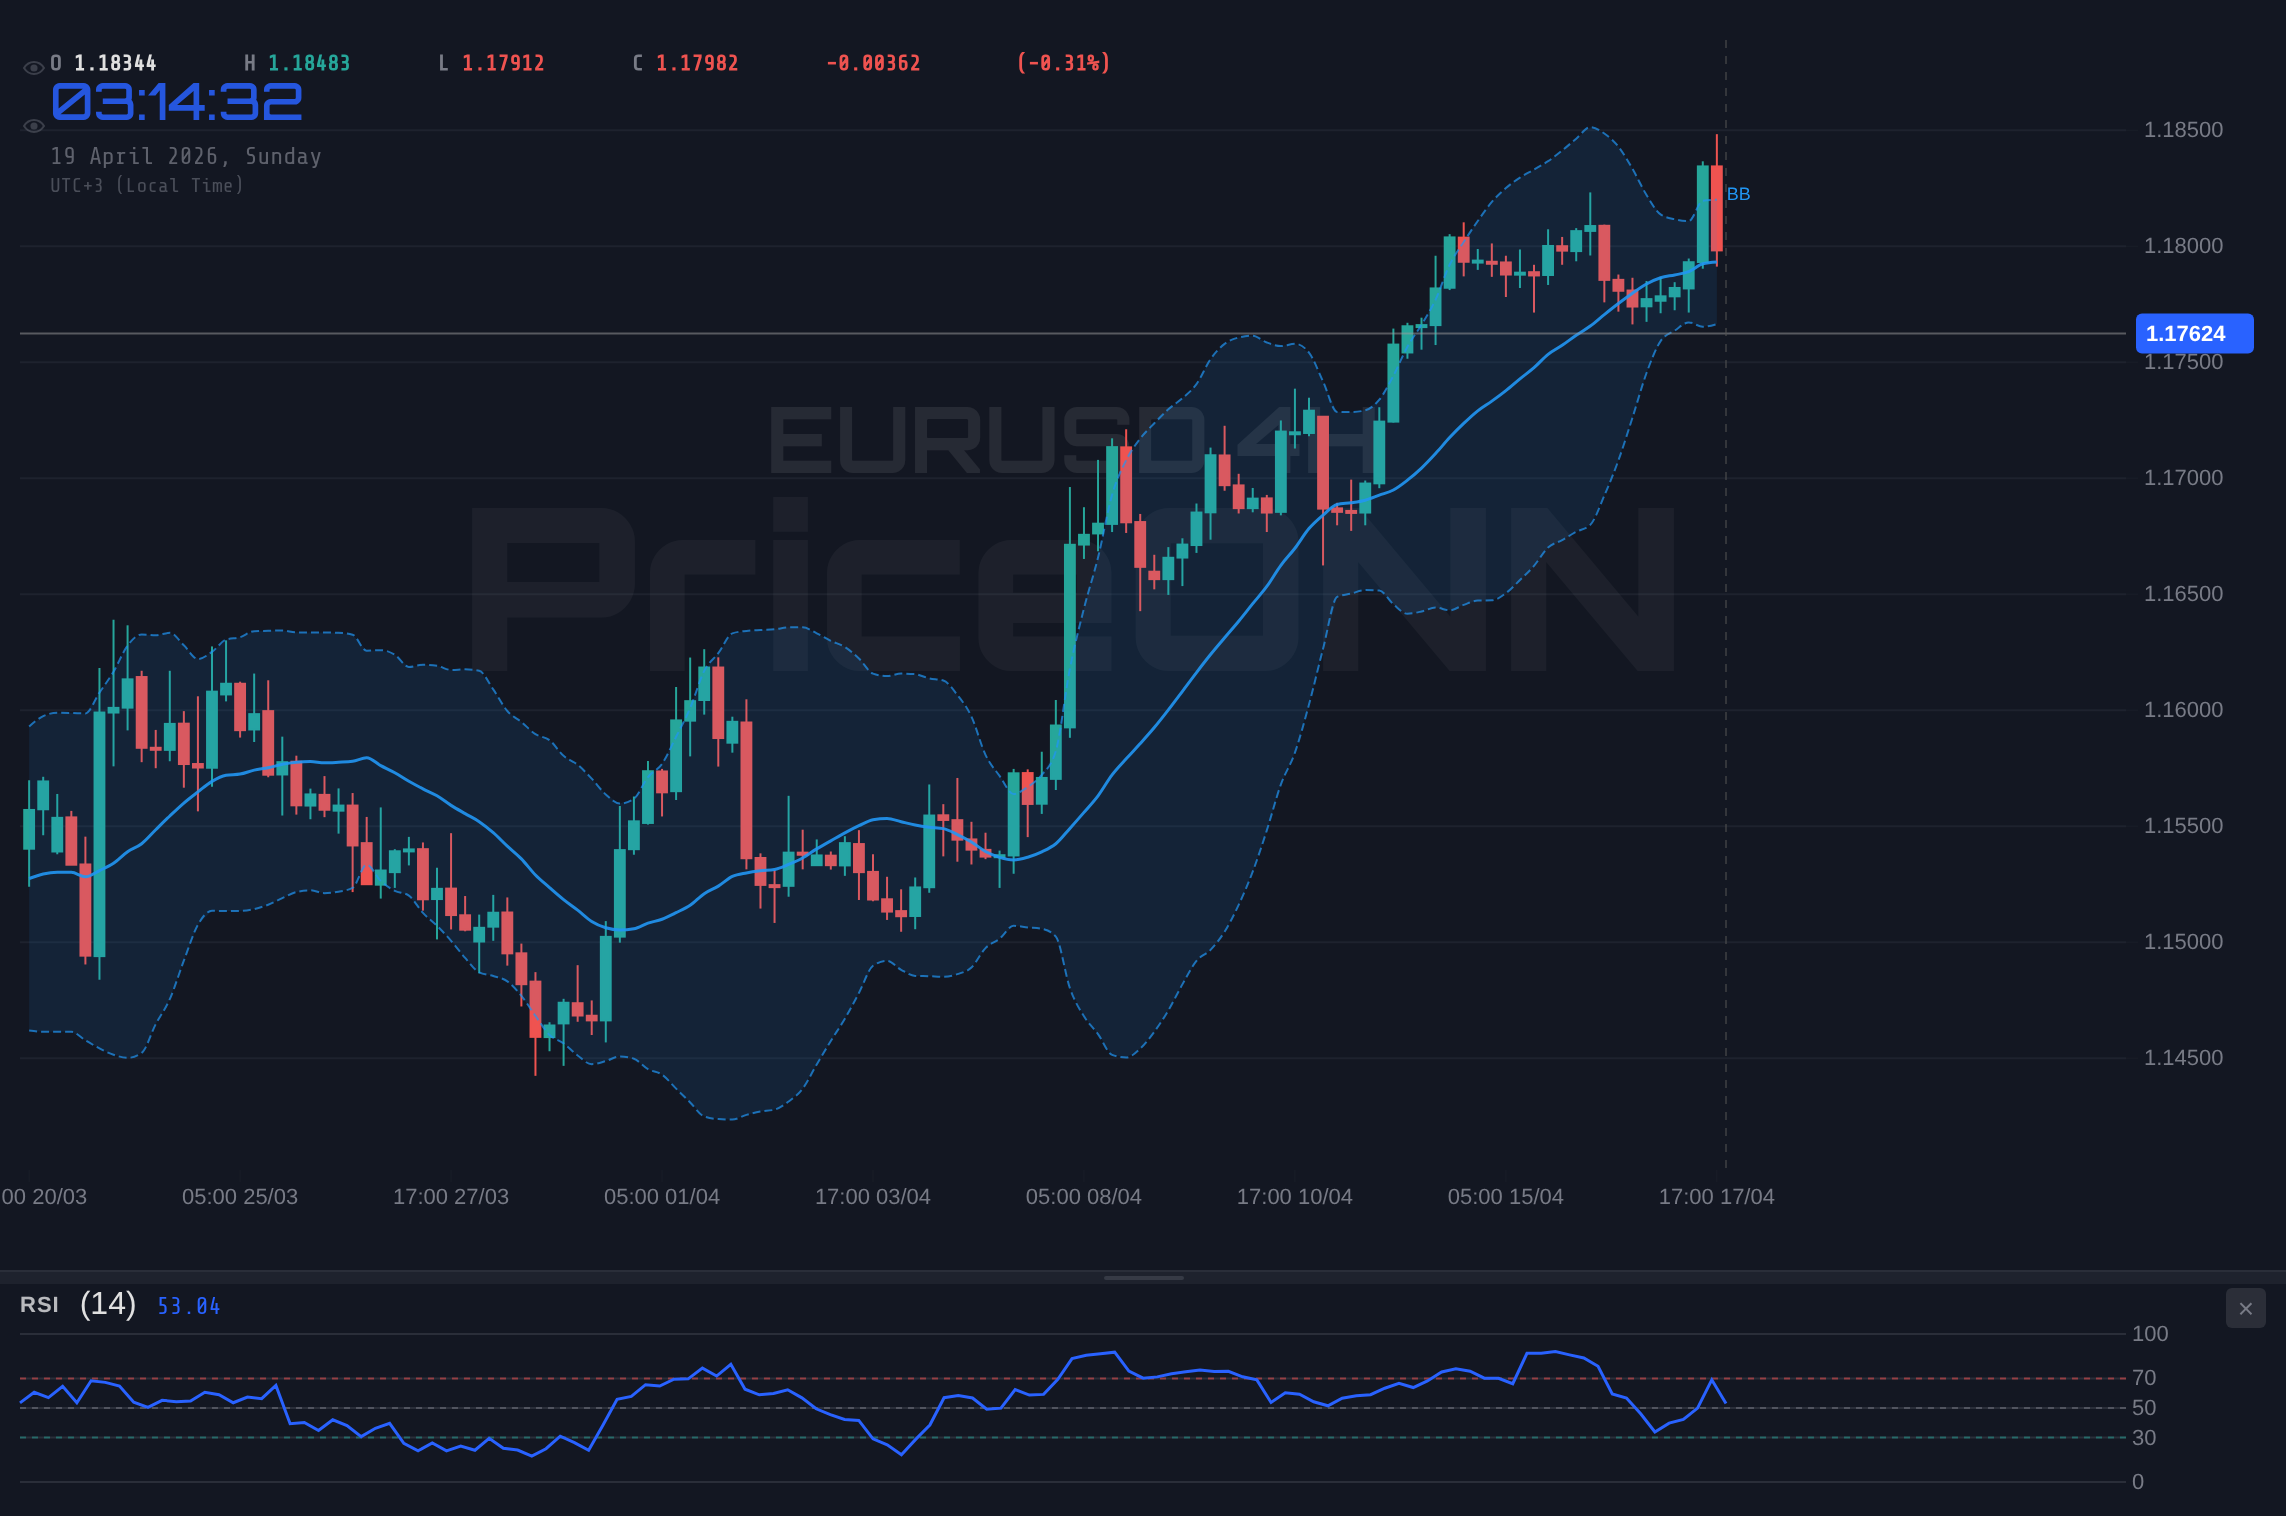
This week's price action for EURUSD can be best described as a battleground, with neither the bulls nor the bears able to establish firm control. The pair opened the week trading just above the 1.1800 mark, but a steady drip of selling pressure throughout the trading days saw it retreat towards the 1.1750s by Friday's close. This trading range, approximately 150 pips wide, is not unusual, but the lack of conviction behind the moves is. We witnessed brief rallies that failed to sustain momentum and equally fleeting dips that were quickly bought back. This scenario is often indicative of a market awaiting a significant catalyst, be it economic data, central bank commentary, or a geopolitical development, to break the stalemate. The current price of $1.17625, as of the latest data, reflects this equilibrium, a delicate balance that could easily be tipped by incoming information.
From a multi-timeframe technical analysis perspective, the EURUSD chart presents a fascinating, albeit confusing, picture. On the shorter timeframes, the narrative leans bearish. The 1-hour chart shows a clear downtrend in momentum, with the MACD indicator trading below its signal line and the RSI hovering in the mid-30s at 38.74. This suggests that intraday traders are favoring short positions, and any upward movements are being met with profit-taking. The Stochastic Oscillator on the 1H chart, with %K at 8.68 and %D at 37.13, also points to further downside potential, sitting deep in oversold territory and signaling a potential continuation of the bearish push. The ADX at 18.06 on this timeframe further reinforces this view, indicating a weak trend, which often precedes a more significant move once momentum builds. The Bollinger Bands on the 1H chart are also hugging the lower band, suggesting increased selling pressure.
However, casting a wider net to the daily timeframe reveals a somewhat different story, or at least a less bearish one. The 1-day chart for EURUSD shows the RSI at a more neutral 60.87, indicating that while the intraday bears might be active, the broader trend hasn't fully capitulated. The MACD on the daily chart, in contrast to the 1H, is showing positive momentum, trading above its signal line. This divergence between the short-term and long-term indicators is precisely what creates this 'choppy' market environment. It suggests that while sellers are active on shorter timeframes, the underlying bullish sentiment, perhaps driven by expectations of future ECB policy or broader US dollar weakness, remains somewhat intact. The Stochastic Oscillator on the daily chart, with K at 85.04 and D at 92.18, is deep in overbought territory, which, while often signaling a potential reversal, can also persist in strong uptrends or consolidation phases. This presents a classic dilemma for traders: follow the intraday bearish signals, or bet on the longer-term bullish undertones?
The Dollar Index (DXY), a crucial barometer for the euro's performance, has been exhibiting its own mixed signals. Currently trading around 97.9, the DXY has seen a slight dip from its recent highs, influenced by a combination of factors including profit-taking after a strong run and a slight easing of risk-off sentiment in global markets. However, the underlying strength of the dollar remains a significant factor for EURUSD. The 1-hour DXY chart shows a bearish momentum with MACD below the signal line, but the daily chart presents a more complex picture with positive MACD momentum. The ADX on the daily DXY chart at 26.2 suggests a strong downtrend, which, if it continues, would typically be supportive of EURUSD. Conversely, if the dollar finds renewed strength, perhaps driven by hawkish whispers from the Federal Reserve or a sudden shift in global risk appetite, EURUSD could face significant headwinds. The current neutral-to-bearish leaning on the DXY's daily chart at 40.62 is a key factor to monitor, as a decisive move here could provide the impetus for a breakout in the currency pair.
Looking at other correlated assets, the performance of US equities offers further context. The SP500, currently trading at 6572.87, has shown resilience, closing up 0.74% on the day. This risk-on sentiment in equities, generally speaking, can be a headwind for safe-haven assets like the US dollar, and by extension, a tailwind for EURUSD. However, the Nasdaq 100's surge of 1.44% to 26681.85, while positive for risk appetite, also presents a divergence. The RSI on the SP500's 1H chart at 70.95 is nearing overbought territory, suggesting potential for a pullback, which could spill over into EURUSD. The ADX on the SP500's 1D chart at 47.51 indicates a strong downtrend, which is confusing given the intraday gains, pointing to underlying weakness despite the recent bounce. This conflicting data from the equity markets adds another layer of complexity to the EURUSD outlook, suggesting that a clear risk-on or risk-off move hasn't fully materialized yet.
Gold prices, currently at $4833.03, have seen a notable uptick of 0.89%. This rise in gold, often seen as a safe-haven asset and an inflation hedge, could be interpreted in a few ways. It might signal underlying economic uncertainty or rising inflation expectations, which could indirectly support the euro by prompting a less dovish stance from the European Central Bank (ECB). Conversely, a strong gold rally can sometimes coincide with a weaker dollar, which would also be bullish for EURUSD. However, the ADX on the 1D gold chart at 22.43 suggests a moderately trending market, not an explosive move. The conflicting signals from equities and gold mean that the safe-haven narrative isn't providing a clear direction for EURUSD at this moment. Traders must weigh the possibility of risk aversion favoring the dollar against the potential for inflation hedging benefiting the euro.
The upcoming week is packed with high-impact economic data that could easily shatter the current consolidation phase for EURUSD. On the Eurozone front, we have a critical release of Purchasing Managers' Index (PMI) data, which will offer a snapshot of economic activity across the bloc. A reading significantly above or below forecasts could sway ECB policy expectations, impacting the euro. For the US, the focus will be on inflation figures, specifically the Consumer Price Index (CPI) and Producer Price Index (PPI). Higher-than-expected inflation would likely bolster the case for a more hawkish Federal Reserve, potentially strengthening the dollar and pressuring EURUSD. Conversely, any signs of cooling inflation could lead to a reassessment of Fed rate hike expectations, offering some respite to the euro. The market will also be dissecting any commentary from Fed officials for clues on future monetary policy direction.
Considering the current technical setup and the upcoming economic calendar, a scenario-based approach is crucial for navigating EURUSD. The pair is currently consolidating around a key confluence of support and resistance levels. The immediate support lies around the $1.1760-$1.1750 area, a zone that has held firm during the past week's trading. A decisive break below this level, particularly on significant volume, would likely open the door for further downside, targeting the next support at $1.1732 and potentially lower towards $1.1697. On the upside, resistance is encountered around $1.1811, coinciding with the upper Bollinger Band on the 1H chart and a previous swing high. A convincing break above this level, sustained by positive momentum and increasing volume, could signal a shift in sentiment and pave the way for a move towards $1.1845 and potentially higher.
The 4-hour timeframe presents a more mixed picture, adding to the complexity. While the 1-hour chart leans bearish, the 4-hour RSI at 58.18 and ADX at 38.1 indicate a stronger underlying trend, albeit one that is currently struggling for direction. The Stochastic Oscillator on the 4H chart shows a bullish signal with %K at 60.96 and %D at 34.62, suggesting that the recent pullback might be a temporary pause before a potential upward move. However, the MACD on this timeframe is still showing negative momentum. This conflict between short-term bearish signals and longer-term bullish undertones makes the $1.1760-$1.1811 range a critical battleground. A break out of this range, confirmed by increasing volatility and clear directional bias across multiple timeframes, will be key to determining the next significant move.
The daily chart, as mentioned, offers a more neutral to slightly bullish outlook, particularly with the RSI at 60.87 and positive MACD momentum. The ADX at 28.38 suggests a strong trend is developing, but the direction is not yet definitively established. The Stochastic Oscillator on the daily chart is deep in overbought territory (K=85.04, D=92.18), which typically warns of a potential reversal or a period of consolidation. This overbought condition, coupled with the consolidation seen over the past week, suggests that while the longer-term trend might still be upward, the path forward could involve further sideways movement or a corrective pullback before any significant upward continuation. This is where careful risk management becomes paramount, as chasing a trend that is showing signs of exhaustion can be a costly mistake.
Understanding the interplay between EURUSD and its key drivers is essential for formulating a robust trading strategy. The DXY's current position near 97.9, with its own mixed signals, adds another layer of uncertainty. If the dollar strengthens, driven by a more hawkish Fed stance or renewed global risk aversion, EURUSD could easily fall back towards its weekly lows. Conversely, any perceived dovish shift from the Fed, or a significant improvement in the Eurozone's economic outlook, could provide the necessary fuel for EURUSD to challenge the upper bounds of its recent range. The upcoming week's economic data will be the primary arbiter of these competing narratives. Traders will be looking for confirmation of either a strengthening dollar or a weakening one, and how that translates into price action for the euro.
The current market sentiment, as reflected in the technical indicators, suggests a high degree of caution is warranted. While the longer-term charts hint at potential for upside, the intraday momentum is clearly favoring the bears. This divergence creates an environment ripe for false breakouts and sharp reversals. Therefore, any trading strategy should prioritize risk management and wait for clear confirmation before committing significant capital. The levels around $1.1760 and $1.1811 are not just price points; they represent psychological battlegrounds where the market's next direction will likely be decided. Patience and discipline will be the most valuable assets for traders navigating EURUSD in the coming days.
Bearish Scenario: Testing the Lower Range
60% ProbabilityNeutral Scenario: Range-Bound Consolidation
25% ProbabilityBullish Scenario: Breakout Above Resistance
15% ProbabilityFrequently Asked Questions: EURUSD Analysis
What happens if EURUSD breaks below the $1.1760 support level?
A break below $1.1760, especially on increased volume, would invalidate the current neutral-to-bullish undertones on the daily chart and likely trigger further selling. This could see EURUSD target the next support at $1.1732, with a potential extension towards $1.1697 if the bearish momentum intensifies.
Should I consider buying EURUSD at current levels near $1.17625 given the mixed signals?
Buying at current levels carries significant risk due to the bearish momentum on the 1H chart and the RSI at 38.74. A more prudent approach would be to wait for confirmation of a bullish reversal, such as a decisive break above $1.1811 resistance, or to wait for a clear test and hold of lower support levels like $1.1732, which might offer a better risk-reward ratio.
Is the RSI at 60.87 on the daily chart a sign of strength for EURUSD?
An RSI of 60.87 on the daily chart is generally considered within the neutral-to-bullish zone, indicating upward momentum is present but not yet in overbought territory. However, it contrasts with the bearish RSI of 38.74 on the 1-hour chart, highlighting the conflicting signals and suggesting that the pair may need further consolidation or a directional catalyst to establish a clear trend.
How will upcoming US inflation data affect EURUSD trading this week?
Higher-than-expected US inflation figures would likely strengthen the US Dollar (DXY) as the Federal Reserve might be pressured to maintain a hawkish stance or delay rate cuts. This could lead to downward pressure on EURUSD, potentially pushing it towards the $1.1732 support level. Conversely, cooler inflation could weaken the dollar, offering support to EURUSD and potentially driving it towards the $1.1811 resistance.
The past week has been characterized by EURUSD's struggle to maintain momentum, trading within a tight range around the $1.1760 mark. While intraday charts suggest bearish pressure, the daily indicators offer a more neutral to cautiously optimistic view, creating a complex environment for traders. The upcoming week's economic data releases, particularly US inflation figures and Eurozone PMIs, will be critical in determining whether this consolidation breaks to the upside or downside. Patience and a clear strategy focused on risk management will be paramount for navigating these choppy waters. The market is at a crossroads, and the next directional impulse is likely to be driven by fundamental catalysts rather than sheer technical momentum alone.
Track markets in real-time
AI-powered analysis, technical indicators and real-time price data.
Join Our Telegram Channel
Breaking market news, AI analysis and trading signals instantly.
Join Channel