Weekly Market Review: April 13, 2026 – April 17, 2026 (Week 16)
The trading week ending April 17, 2026, saw significant price action across major asset classes. Gold experienced a notable surge, breaking above key resistance levels. The US Dollar Index (DXY) weakened throughout the week, while oil prices, both Brent and WTI, experienced sharp declines. Major stock indices showed mixed but generally positive sentiment, with tech-heavy Nasdaq and Dow Jones leading gains. Cryptocurrencies also posted gains, with Bitcoin and Ethereum trading higher.
Executive Summary
This past week was characterized by a risk-on sentiment in many markets, driven by a combination of geopolitical developments and economic data surprises. Key highlights include:
Gold surged over 3.3%, closing the week near $4,834.08, driven by perceived safe-haven demand and a weaker dollar.
The US Dollar Index (DXY) declined by 0.06%, testing lower levels as traders digested mixed economic data.
Oil prices experienced a sharp sell-off, with Brent Crude dropping 6.93% and WTI Crude falling 6.71%, influenced by inventory data and geopolitical easing.
Major US stock indices, including the Dow Jones (+1.74%), Nasdaq (+1.45%), and S&P 500 (+0.74%), closed the week higher.
Cryptocurrencies saw upward momentum, with Bitcoin gaining 2.75% and Ethereum advancing 3.00%.
US Dollar & DXY Analysis
The US Dollar Index (DXY) concluded the week with a modest decline of 0.06%, closing at 97.899. The index faced headwinds from a combination of factors, including a perceived easing of geopolitical tensions and stronger-than-expected economic data from other major economies. On the weekly timeframe, the DXY's RSI stood at 46.4, indicating a lack of strong bullish momentum and leaning towards neutral territory. The MACD histogram on the weekly chart was positive (+0.12), suggesting a potential shift, but this was contradicted by the daily and 4-hour charts, which showed negative MACD histograms (-0.21 and +0.03 respectively), implying downward pressure. The ADX on all timeframes remained at 1.0, indicating a lack of directional trend strength.
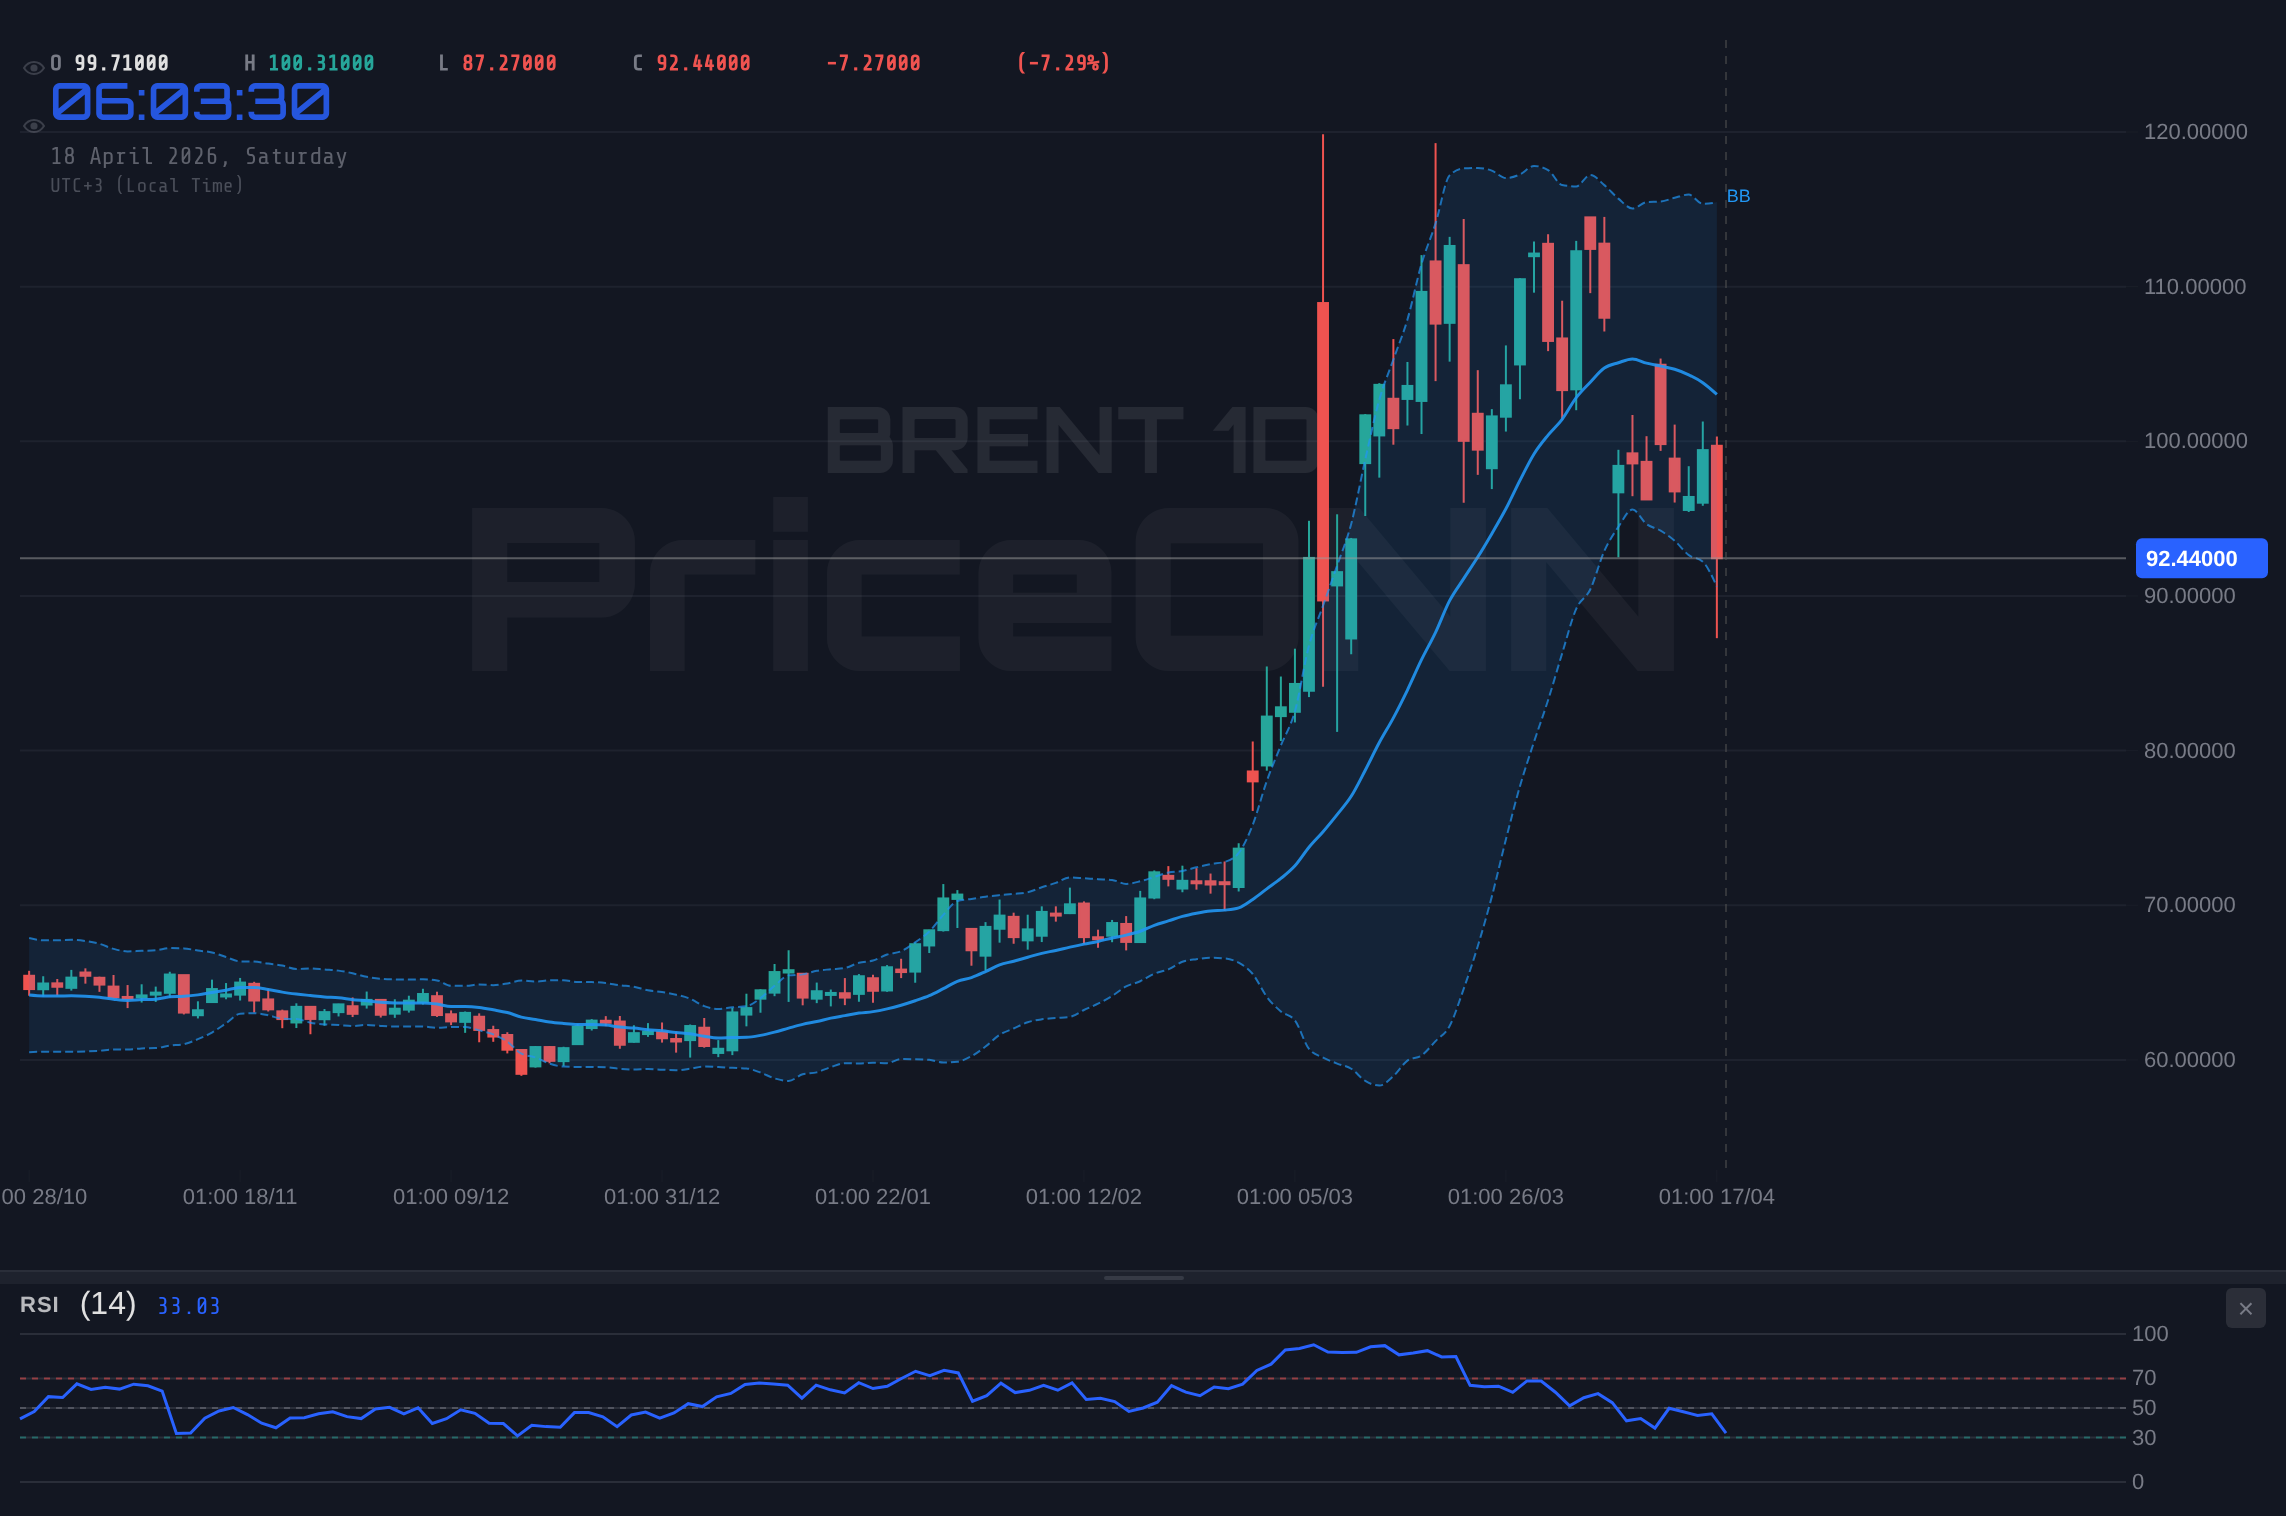
BRENT 4H Chart
On Friday, the DXY tested support around the Pivot level of 97.830. The 1-hour chart showed a bullish sentiment (RSI 56.8, Stoch %K 72.0), while the 4-hour and daily charts exhibited bearish signals (4H RSI 47.8, 1D RSI 40.6; 4H Stoch %K 48.1, 1D Stoch %K 15.3; 4H MACD negative, 1D MACD negative). The Bollinger Bands on the daily chart showed the price trading near the lower band (97.410), reinforcing the bearish sentiment for the day.
EUR/USD saw some volatility, ultimately closing the week slightly lower at 1.17634, a daily loss of 0.12%. The weekly sentiment was mixed. The 1-hour chart showed a bearish RSI (38.7) and a strongly oversold Williams %R (-97.6), suggesting potential for a short-term bounce. However, the 4-hour and daily charts displayed bullish signals with RSI values of 58.2 and 60.9, respectively. The MACD histogram was neutral across all timeframes, indicating a lack of strong momentum. The pair traded near the daily Pivot of 1.17889, finding support at S1 (1.17546) and resistance at R1 (1.18115).
GBP/USD experienced a slight depreciation, closing the week down 0.06% at 1.35160. The technical indicators presented a mixed picture. The 1-hour chart showed bearish signals with RSI at 41.9 and Williams %R at -84.4. Conversely, the 4-hour and daily charts exhibited stronger bullish sentiment, with RSI at 57.0 and 58.5, respectively. The MACD was neutral across timeframes. The pair hovered around the daily Pivot of 1.35445, with key levels including S1 at 1.34953 and R1 at 1.35736.
USD/JPY depreciated by 0.31% for the week, closing at 158.63. The overall sentiment leaned bearish, particularly on the shorter timeframes. The 1-hour RSI was 46.7, and the 4-hour RSI was 42.8, indicating a lack of upward momentum. The daily RSI at 49.0 was approaching neutral. MACD histograms were negative across the 1-hour, 4-hour, and daily charts, reinforcing the bearish bias. The ADX at 1.0 on all timeframes suggested a lack of strong trend. The pair traded below the daily Pivot of 158.89, with support at S1 (158.48) and resistance at R1 (159.52).
AUD/USD posted a gain of 0.11%, closing at 0.71672. The technical indicators showed a divergence between short-term and longer-term timeframes. The 1-hour chart presented a bearish signal with RSI at 46.2 and a deeply oversold Williams %R (-83.9). However, the 4-hour and daily charts exhibited bullish momentum, with RSI at 64.6 and 64.9, respectively, and CCI at 141.0 on the 4-hour. MACD histograms were neutral. The pair traded just below the daily Pivot of 0.71689, with resistance at R1 (0.71865) and support at S1 (0.71416).
NZD/USD registered a loss of 0.09%, closing at 0.58818. The technical picture was mixed. The 1-hour chart indicated bearish sentiment with RSI at 44.0 and Williams %R at -84.6. In contrast, the 4-hour and daily charts showed bullish signs, with RSI at 59.4 and 56.0, respectively. The MACD histograms were neutral across timeframes. The pair traded around the daily Pivot of 0.58964, facing resistance at R1 (0.59117) and finding support at S1 (0.58719).
Resistance
Price
R3
0.59515
R2
0.59362
R1
0.59117
Pivot
0.58964
Support
Price
S1
0.58719
S2
0.58566
S3
0.58321
Fib 61.8%
0.59000
Precious Metals
Gold (XAUUSD)
Gold experienced a strong bullish week, closing up 0.91% at 4,834.08. The daily sentiment was strongly bullish, with RSI at 53.9 and Stoch %K at 75.0, indicating upward momentum. The weekly RSI at 58.9 also suggested a positive trend. The MACD histogram on the daily chart was significantly positive (+33.66), supporting the bullish outlook, though the weekly MACD histogram was negative (-64.71). Bollinger Bands on the daily showed the price pushing towards the upper band (4,935.17). Gold successfully tested and moved above the daily Pivot of 4,800.49, with R1 at 4,828.04 acting as immediate resistance and then support. The 61.8% Fibonacci retracement level stood at 4,914.68.
Silver also saw significant gains, closing the week up 3.32% at 80.997. The daily chart displayed strong bullish signals, with RSI at 58.6 and Stoch %K at 81.3, indicating buying pressure. The weekly RSI at 57.2 reinforced this positive sentiment. The daily MACD histogram was positive (+1.26), supporting the upward move, although the weekly histogram was negative (-2.07). The price traded above the daily Pivot of 79.080, pushing towards R1 at 80.130. The upper Bollinger Band on the daily chart was at 81.250. The 61.8% Fibonacci retracement level was at 74.480.
Resistance
Price
R3
82.920
R2
81.870
R1
80.130
Pivot
79.080
Support
Price
S1
77.350
S2
76.290
S3
74.560
Fib 61.8%
74.480
Energy Markets
Brent Crude
Brent Crude experienced a sharp decline, closing the week down 6.93% at 92.54. The weekly sentiment was bearish, with RSI at 59.4, but the daily and 4-hour charts showed increasing weakness. The daily RSI was 43.9, and the 4-hour RSI was 35.2, both indicating selling pressure. The MACD histogram on the daily chart was negative (-2.34), confirming the downward move, while the weekly histogram was positive (+2.75). The price fell below the daily Pivot of 98.85 and tested support S1 (96.41) and S2 (93.40). The Bollinger Bands on the daily showed the price trading near the lower band (90.63).
Resistance
Price
R3
107.31
R2
104.30
R1
101.86
Pivot
98.85
Support
Price
S1
96.41
S2
93.40
S3
90.96
Fib 61.8%
87.24
WTI Crude
WTI Crude followed Brent lower, closing the week down 6.71% at 86.42. The bearish sentiment was evident across multiple timeframes. The daily RSI was 43.1, and the 4-hour RSI was 32.0, both in oversold territory and signaling strong selling pressure. The weekly RSI at 57.3 suggested a potential longer-term uptrend, but short-term momentum was clearly downwards. The daily MACD histogram was negative (-2.70), reinforcing the bearish outlook. The price broke below the daily Pivot of 92.61 and approached S1 (90.45) and S2 (88.27). The daily Bollinger Bands showed the price near the lower band (82.78).
Resistance
Price
R3
99.13
R2
96.95
R1
94.79
Pivot
92.61
Support
Price
S1
90.45
S2
88.27
S3
86.11
Fib 61.8%
83.89
Cryptocurrency Update
Bitcoin (BTCUSD)
Bitcoin posted a healthy gain of 2.75%, closing the week at 77,296. The daily sentiment was bullish, with RSI at 69.4, nearing overbought territory, and Stoch %K at 86.8, confirming strong buying momentum. The weekly RSI at 45.1 suggested a more neutral stance on the longer timeframe. The daily MACD histogram was strongly positive (+754.62), indicating robust upward pressure. The price traded above the daily Pivot of 74,691 and tested resistance R1 (76,063). The 61.8% Fibonacci retracement level was at 68,883.
Resistance
Price
R3
78,273
R2
76,901
R1
76,063
Pivot
74,691
Support
Price
S1
73,853
S2
72,481
S3
71,643
Fib 61.8%
68,883
Ethereum (ETHUSD)
Ethereum also performed well, gaining 3.00% and closing the week at 2,417.92. The daily chart showed bullish signals with RSI at 67.0, approaching overbought conditions, and Stoch %K at 83.0. The weekly RSI was 45.7, suggesting a more neutral longer-term outlook. The daily MACD histogram was positive (+25.97), supporting the recent upward move. The price was trading above the daily Pivot of 2,336.06 and tested resistance R1 (2,389.81). The 61.8% Fibonacci retracement level was at 2,073.53.
The S&P 500 closed the week higher by 0.74%, finishing at 6,573. The daily sentiment was mixed, with RSI at 45.4, indicating a lack of strong bullish momentum. However, the 1-hour and 4-hour charts showed buying pressure (RSI 71.0 and 62.8 respectively), and the MACD histogram on the 4-hour was positive (+27.63). The daily MACD histogram was negative (-6.48), suggesting caution. The price traded above the daily Pivot of 6,458, with resistance at R1 (6,605) and support at S1 (6,377). The 50% Fibonacci retracement level was at 6,661.
Resistance
Price
R3
6,833
R2
6,686
R1
6,605
Pivot
6,458
Support
Price
S1
6,377
S2
6,231
S3
6,150
Fib 61.8%
6,744
Nasdaq 100
The Nasdaq 100 index rallied strongly, gaining 1.45% to close at 26,683. The daily sentiment was overwhelmingly bullish, with RSI at 75.3 approaching overbought territory and Stoch %K at 98.1. The weekly RSI at 64.0 also supported a positive trend. The daily MACD histogram was strongly positive (+303.07). The index traded above the daily Pivot of 26,272, with resistance at R1 (26,430). The 38.2% Fibonacci retracement level was at 25,216.
Resistance
Price
R3
26,715
R2
26,558
R1
26,430
Pivot
26,272
Support
Price
S1
26,145
S2
25,987
S3
25,859
Fib 61.8%
24,287
Dow Jones 30
The Dow Jones Industrial Average showed robust performance, gaining 1.74% to close at 49,471. The daily sentiment was strongly bullish, with RSI at 69.5 and Stoch %K at 94.1. The weekly RSI at 59.5 also indicated a positive trend. The daily MACD histogram was very strong (+352.32). The index moved above the daily Pivot of 48,541 and tested resistance R1 (48,752). The 61.8% Fibonacci retracement level was at 48,332.
Resistance
Price
R3
49,091
R2
48,880
R1
48,752
Pivot
48,541
Support
Price
S1
48,413
S2
48,202
S3
48,074
Fib 61.8%
48,332
Economic Calendar Impact
The past week's economic releases provided several key insights that influenced market movements:
U.S. Initial Jobless Claims: The actual figure of 207k was below the forecast of 213k, indicating a stronger labor market than anticipated. This data point, released on Thursday, likely contributed to the mixed sentiment for the USD.
U.S. Philadelphia Fed Manufacturing Index: This index significantly exceeded expectations, coming in at 26.7 against a forecast of 10.3. This strong reading on Thursday suggested robust manufacturing activity in the region and provided support for the US dollar earlier in the week, though its impact waned by Friday.
Eurozone Consumer Price Index (CPI) YoY: The actual inflation rate of 2.6% was slightly above the forecast of 2.5%. This higher-than-expected inflation could put pressure on the European Central Bank to maintain a hawkish stance, potentially supporting the Euro.
U.K. Gross Domestic Product (GDP) MoM: The UK economy showed surprising resilience with a 0.5% MoM GDP growth, significantly beating the forecast of 0.1%. This positive economic surprise on Wednesday provided a boost to the British Pound.
U.S. Crude Oil Inventories: A larger-than-expected drawdown of -0.913 million barrels compared to a forecast of 2.1 million barrels indicated a decrease in crude oil stockpiles. This data, released on Wednesday, initially supported oil prices but was overshadowed by broader market sentiment and geopolitical shifts later in the week.
U.S. Producer Price Index (PPI) MoM: The PPI came in lower than expected at 0.5%, compared to a forecast of 1.1%. This indicated cooling inflationary pressures at the producer level, which could influence future Federal Reserve policy decisions and put downward pressure on the dollar.
U.S. Existing Home Sales: The figure of 3.98 million was slightly below the forecast of 4.07 million, suggesting a minor slowdown in the housing market. This data, released on Tuesday, contributed to the mixed picture for the US dollar.
Week in Summary
The week of April 13-17, 2026, was marked by a clear divergence in market performance. Gold emerged as a significant winner, breaking through key resistance levels and benefiting from a weaker US dollar. The dollar itself faced pressure from a combination of positive economic surprises in other major economies and less-than-stellar US data. Energy markets were notably weak, with both Brent and WTI crude oil prices plummeting due to inventory data and perceived easing of geopolitical tensions surrounding the Strait of Hormuz. Stock markets, particularly the tech-heavy Nasdaq and the blue-chip Dow Jones, demonstrated resilience and ended the week with solid gains, indicating a generally positive risk appetite among investors. Cryptocurrencies followed the broader risk-on sentiment, with Bitcoin and Ethereum posting gains. The economic calendar provided a mixed bag of data, with stronger-than-expected GDP from the UK and robust US manufacturing data, but also signs of cooling inflation in the US PPI and a slight slowdown in US existing home sales.
Key Themes:
Safe-Haven Demand for Gold: Gold's strong performance underscored its role as a preferred safe-haven asset amidst global economic uncertainties and currency fluctuations.
Oil Price Correction: The sharp sell-off in oil was a significant event, driven by supply-side data and a de-escalation of geopolitical risks, impacting commodity-linked currencies.
US Dollar Weakness: The DXY's decline suggested a shift in investor sentiment away from the dollar, influenced by global economic data and interest rate expectations.
Resilient Equities: Despite some headwinds, major stock indices showed strength, particularly in the technology and industrial sectors.
Overall market sentiment leaned cautiously optimistic, with traders digesting a complex mix of geopolitical developments and economic indicators.
Disclaimer: This content is for informational and educational purposes only and does not constitute investment advice, financial recommendation, or an offer to buy or sell any financial instrument. Past performance does not guarantee future results. Always do your own research and consult a licensed financial advisor before making investment decisions.
Track markets in real-time
AI-powered analysis, technical indicators and real-time price data.
We are looking for writers who produce market analysis, macro commentary, and data-driven content. Reach readers in 10 languages through our multilingual publishing platform.