

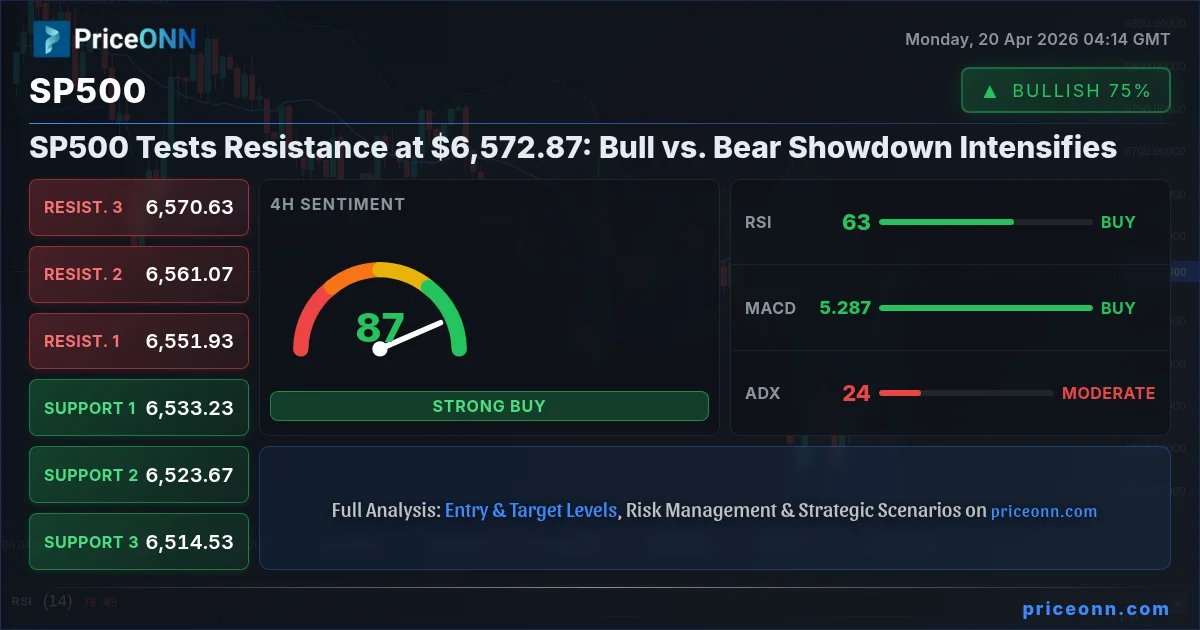
The battleground is set around the $6,572.87 mark for the SP500, as bulls and bears engage in a fierce tug-of-war. With the index currently testing critical resistance levels, the market is at a pivotal juncture, demanding a closer look at the technical landscape and the underlying sentiment. This isn't just another trading day; it's a potential inflection point that could dictate the market's direction for weeks to come. The current price, $6,572.87, is more than just a number - it's a psychological barrier and a technical hurdle that both sides are desperately trying to overcome or defend. Understanding the nuances of this standoff is crucial for any trader aiming to navigate the choppy waters ahead.
- The SP500 is currently trading at $6,572.87, hovering near a key resistance level.
- On the 1-hour chart, RSI at 70.95 signals potential overbought conditions, suggesting selling pressure may emerge.
- The 4-hour ADX at 24.23 indicates a moderate uptrend, but Stochastic's overbought reading (K=97.85, D=86.96) on the 4H chart warns of a potential pullback.
- The daily chart shows a bearish trend (ADX: 47.51), with support at $6,377.47, contrasting with the short-term upward momentum.
- DXY's rise to 97.99 adds pressure on risk assets like the SP500, indicating a potential headwind for further upside.
The tension is palpable. On one side, the bulls are pushing, fueled by a desire to break through the $6,572.87 ceiling and set new highs. They point to the short-term upward momentum observed on the 1-hour and 4-hour charts, where the trend strength indicators like ADX suggest a prevailing direction, albeit with conflicting signals in oscillators. The SP500's ability to climb towards resistance levels like $6,568.73 and $6,577.27 on the 1H chart, and $6,551.93 on the 4H chart, demonstrates resilience. However, the daily timeframe paints a more cautious picture, with a prevailing downward trend and a significant support level identified at $6,377.47. This divergence across timeframes creates the perfect environment for a heated debate: is this a temporary pause before a renewed rally, or is the market poised for a correction?
Let's dissect the arguments. The bullish case hinges on the SP500's recent performance and the potential for continued economic expansion. Bulls will highlight the positive signals from the 1-hour chart, where the ADX stands at 49.72, indicating a strong uptrend, and the MACD shows positive momentum. While the RSI is high at 70.95, suggesting overbought conditions, it hasn't necessarily signaled an immediate reversal. Historically, RSI values in the high 70s can persist in strong uptrends before a significant pullback. They might also point to the Nasdaq100's 1-hour trend strength (ADX: 26.66) and Dow Jones 30's 4-hour bullish trend (ADX: 21.49) as signs of broader market strength. The argument is that the market is simply consolidating before the next leg up, and any dip presents a buying opportunity to target higher resistance levels, such as $6,589.83 on the 1H chart or even $6,605.07 if momentum truly ignites.
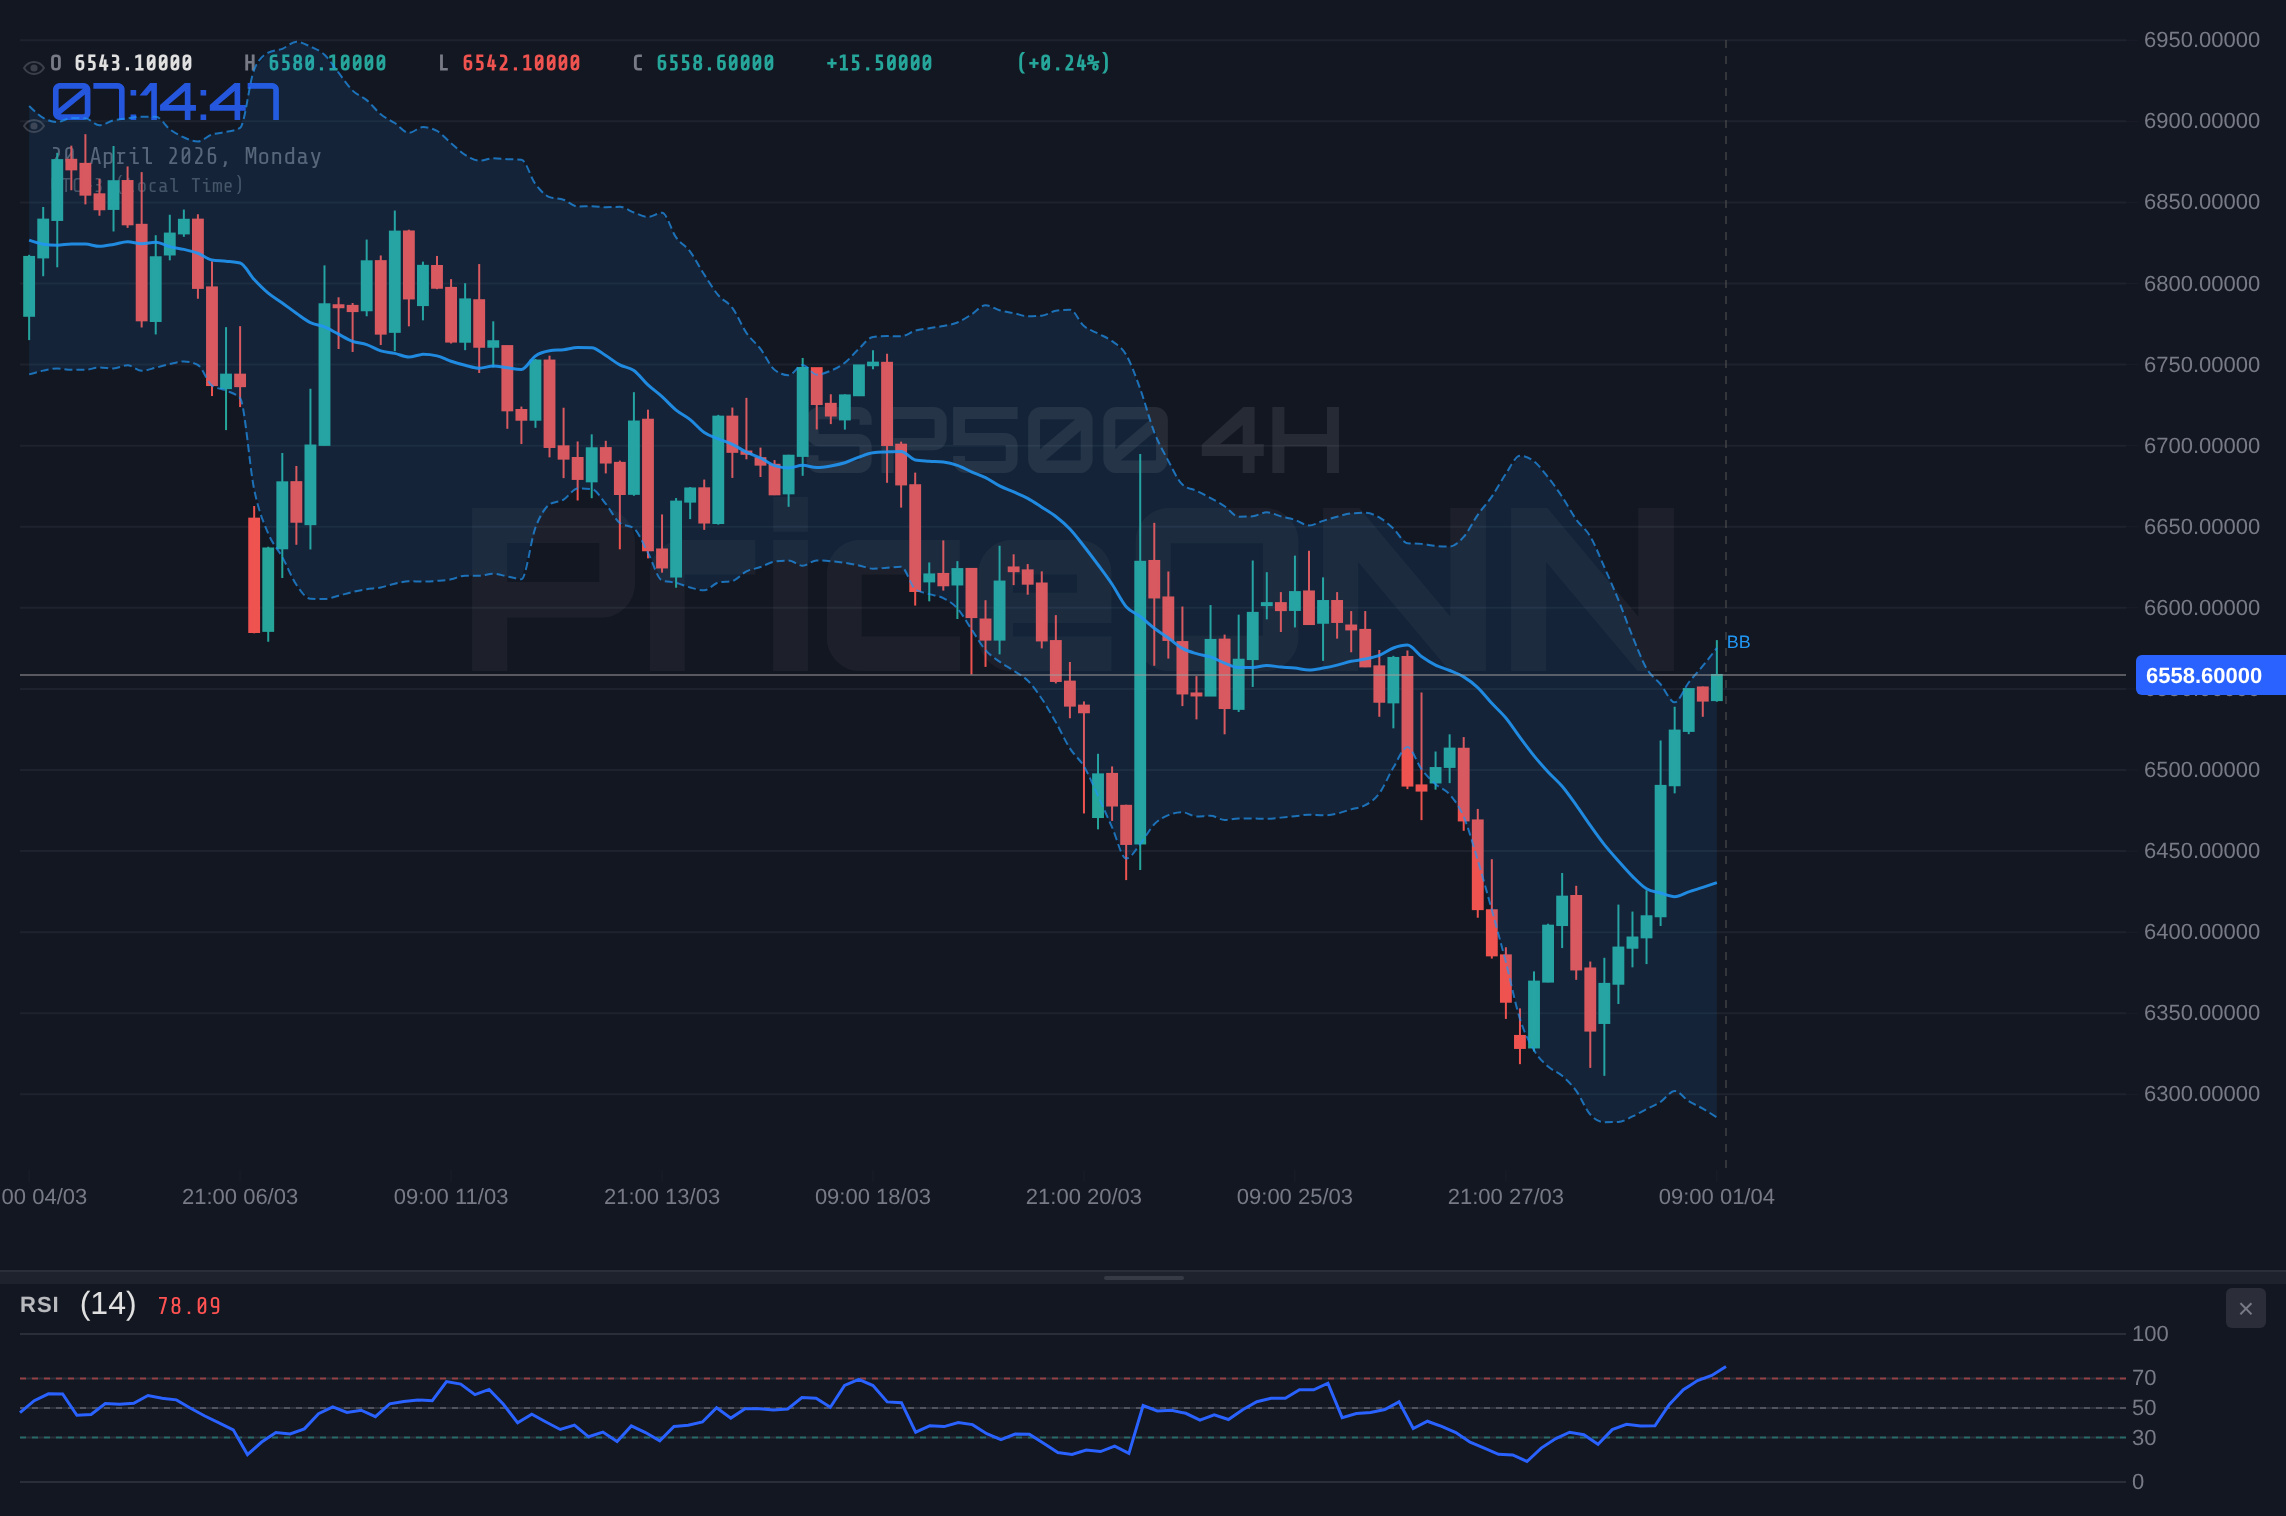
However, the bearish narrative is gaining traction, supported by several concerning technical indicators and broader market correlations. The daily chart presents a starkly different picture, with an ADX reading of 47.51 signifying a strong downtrend, and key support at $6,377.47. This longer-term perspective suggests that the recent upward moves might be mere retracements within a larger bearish structure. Furthermore, the Dollar Index (DXY) is currently at 97.99 and showing signs of strength on the 1-hour and 4-hour charts, which typically exerts downward pressure on risk assets like the SP500. The fact that WTI crude oil prices have seen a significant jump (4.33% to $90.06), while potentially signaling inflation, also adds a layer of uncertainty and potential headwinds for equities. The RSI on the 1-hour chart, while high, is coupled with a MACD that shows negative momentum, and a Stochastic oscillator that is starting to dip after a brief rise, hinting that the upward push might be losing steam.
The conflicting signals across different timeframes and indicators are precisely what make this level so critical. On the 4-hour chart, while the ADX is moderate at 24.23, the Stochastic oscillator is flashing a bearish signal with K=97.85 and D=86.96, indicating extreme overbought conditions that often precede a reversal. The Bollinger Bands on the 1-hour chart are also trading below the middle band, reinforcing the short-term bearish sentiment. Even the Nasdaq100, often a bellwether for tech-heavy sentiment, shows mixed signals: strong 4-hour uptrend and daily overbought conditions (RSI 73.26), but negative momentum on the 1-hour chart. This complexity suggests that a decisive break above the $6,572.87 resistance is far from guaranteed and could be a trap for unwary buyers.
Delving deeper into the technicals, the 1-day RSI at 45.35 is in neutral territory but trending downwards, further supporting the bearish outlook from the longer timeframe. While the MACD histogram is positive on the 1-day chart, suggesting some underlying buying interest, its position relative to the signal line and the overall downtrend indicated by ADX at 47.51 cannot be ignored. The Stochastic on the daily chart, while showing a bullish crossover (K=42.97, D=29.88), is coming from oversold levels and needs to overcome significant resistance to confirm a sustained reversal. This interplay of indicators paints a picture of a market at a crossroads, where short-term optimism clashes with long-term structural weakness.
The correlation with the broader market environment cannot be overstated. The DXY's current price of 97.99, and its upward bias on shorter timeframes, acts as a significant headwind. A stronger dollar generally makes US assets less attractive to foreign investors and can signal tighter global liquidity conditions, both of which are detrimental to equity markets like the SP500. Coupled with the surge in oil prices, which could reignite inflation concerns and prompt aggressive central bank action, the macro backdrop is far from universally supportive for the bulls. The recent news regarding the Strait of Hormuz adds another layer of geopolitical risk, potentially impacting energy prices and broader market sentiment, although its direct impact on the SP500's immediate price action may be limited unless it escalates significantly.
Considering the conflicting signals, the most probable scenario, based on the current technical confluence, leans towards a bearish outcome or at least a period of consolidation. The resistance at $6,572.87 appears formidable, especially given the bearish indicators on the daily timeframe and the strength of the DXY. A failure to decisively break and hold above this level could lead to a sharp sell-off, targeting the support levels identified. The key will be how the market reacts in the immediate hours and days. A close below the 1-hour support at $6,547.63 could signal the beginning of a move downwards, while a sustained push above $6,577.27 might embolden buyers, but the daily trend remains a significant counter-argument.
Bearish Scenario: Resistance Holds, Reversal Looms
65% ProbabilityNeutral Scenario: Consolidation Around Resistance
25% ProbabilityBullish Scenario: Breakout Above Resistance
10% ProbabilityThe technical indicators provide a mixed bag, but the weight of evidence leans towards caution. The daily chart's bearish trend, coupled with the DXY's strength and the RSI hovering in overbought territory on the 1-hour chart, suggests that the path of least resistance might be downwards. While the bulls have managed to push the price to this critical resistance zone, the lack of sustained momentum and conflicting signals across timeframes indicate that a significant breakout is unlikely without a strong catalyst. Traders should remain vigilant, watching for a clear break of either the support at $6,547.63 or the resistance at $6,577.27 to confirm the next directional move.
The ADX indicator across the board provides a particularly interesting narrative. On the 1-hour chart, ADX at 49.72 screams strong uptrend, yet the RSI at 70.95 and Stochastic's cautionary signals suggest this strength might be waning rapidly. Conversely, the daily ADX at 47.51 points to a robust downtrend, implying that the short-term bullish attempts are likely just noise within a larger bearish structure. This divergence is the crux of the current market indecision. For the bulls to regain control, they need to not only break $6,572.87 but also see the daily trend indicators begin to shift positively, which is not currently evident. The RSI on the daily chart at 45.35 is also far from confirming a bullish reversal.
The Stochastic oscillator's behavior is also noteworthy. On the 1-hour chart, it shows a bullish signal (%K > %D), but on the 4-hour chart, it's showing a bearish signal (%K
The correlation with other markets provides further context. The DXY's slight uptick to 97.99 is a classic bearish signal for equities, as a stronger dollar typically implies tighter financial conditions or risk aversion. The surge in oil prices (WTI at $90.06, Brent at $96.46) adds to the inflation narrative, which could pressure central banks to maintain hawkish stances or even tighten further, acting as a drag on stock market valuations. While rising oil prices can sometimes correlate with economic strength, the current backdrop suggests it might be more of a supply-driven shock or geopolitical premium, which is less constructive for broad market sentiment.
Considering the confluence of factors - daily bearish trend, high RSI on intraday charts, overbought Stochastic on the 4-hour, and a strengthening DXY - the probability leans towards a bearish scenario playing out. The $6,572.87 resistance is likely to hold, leading to a retest of lower support levels. The immediate target on the downside would be the 1-hour support at $6,547.63. A decisive break below this level could accelerate the move towards the more significant daily support at $6,377.47. However, the market is complex, and a strong catalyst could shift sentiment rapidly. For now, caution is the prevailing sentiment, and traders should be prepared for potential downside.
The debate between the bulls and bears at this $6,572.87 resistance level is a microcosm of the broader market's uncertainty. While short-term indicators might offer glimpses of optimism, the longer-term technical picture and macro correlations suggest that the bears have a stronger hand currently. Patience will be key; waiting for a clear break above resistance with sustained momentum or a decisive fall below support will be crucial for defining the next move. Trading against the prevailing daily trend is a risky endeavor, and the current data suggests that the trend remains firmly to the downside until proven otherwise.
Economic Calendar Impact and Market Sentiment
The economic calendar for the coming week presents several high-impact events that could significantly influence the SP500's trajectory. While specific dates for some key USD releases are not yet confirmed in the provided data, the general expectation of significant data points like Retail Sales and Manufacturing PMI readings adds a layer of anticipated volatility. For instance, if upcoming U.S. Retail Sales data, which previously showed a forecast of 1.4% versus a previous 0.6%, comes in stronger than expected, it could bolster the argument for a resilient economy, potentially supporting the SP500. Conversely, weaker-than-expected figures, especially amid rising inflation concerns hinted at by oil price surges, could fuel fears of stagflation or a potential economic slowdown, thereby pressuring the index.
Similarly, Manufacturing PMI data, with a forecast of 50.1 against a previous 49.8, will be closely watched. A reading above 50 typically indicates expansion in the manufacturing sector, which could be a positive signal for equities. However, the market's reaction will depend heavily on how it aligns with broader inflation and interest rate expectations. If strong economic data leads investors to anticipate more aggressive monetary policy from the Federal Reserve, it could paradoxically act as a headwind for stocks due to higher borrowing costs and reduced liquidity. The current DXY strength at 97.99 already hints at a potentially tightening global monetary environment, making any further hawkish signals from economic data particularly impactful.
The geopolitical backdrop, particularly concerning the Strait of Hormuz, adds another layer of complexity. While the immediate impact on the SP500 might be indirect, any significant escalation in tensions could trigger a flight to safety, benefiting assets like gold (currently at $4,794.66) and potentially weighing on riskier assets like stocks. The oil price surge (WTI at $90.06) is a tangible manifestation of these geopolitical risks and their potential inflationary consequences. Traders will be closely monitoring news flow from this region, as it could quickly shift market sentiment and override technical signals. The interplay between economic data, central bank policy expectations, and geopolitical events creates a volatile environment where clear technical breaks are essential for confirming directional bias.
The conflicting signals from the technical indicators - bullish short-term momentum versus bearish long-term trends, overbought oscillators on intraday charts versus neutral daily readings, and a strengthening dollar - all point towards a market grappling with uncertainty. The upcoming economic data releases and any significant geopolitical developments will likely act as catalysts, potentially forcing a resolution to the current stalemate around the $6,572.87 resistance level. Until then, a cautious approach, focusing on risk management and waiting for clearer signals, appears to be the most prudent strategy for navigating this complex market environment.
Frequently Asked Questions: SP500 Analysis
What happens if SP500 breaks above the $6,589.83 resistance level?
A decisive close above $6,589.83 on the 1-hour chart, confirmed by increasing volume, would invalidate the immediate bearish outlook. This bullish scenario targets $6,605.07 as the first objective, potentially extending towards the $6,685.83 resistance level found on the 4-hour chart.
Should I buy SP500 at current levels around $6,572.87 given the RSI at 70.95?
Buying at current levels is risky due to the high RSI (70.95) on the 1-hour chart and the proximity to resistance. The 10% probability bullish scenario suggests potential upside, but a safer approach would be to wait for a confirmed breakout above $6,589.83 or a pullback to support levels.
Is the ADX at 47.51 on the daily chart a strong sell signal for SP500?
An ADX reading of 47.51 on the daily chart indicates a strong downtrend, which supports the bearish case. While not a direct sell signal on its own, it confirms that the prevailing longer-term momentum is downwards, making rallies less likely to sustain.
How will the upcoming U.S. Retail Sales data affect SP500 around the $6,572.87 level?
Stronger-than-expected Retail Sales data (forecast 1.4%) could initially boost SP500, but may also trigger fears of Fed tightening, capping gains near $6,572.87. Weaker data could increase downside pressure, targeting support levels below $6,500.
Track markets in real-time
AI-powered analysis, technical indicators and real-time price data.
Join Our Telegram Channel
Breaking market news, AI analysis and trading signals instantly.
Join Channel