

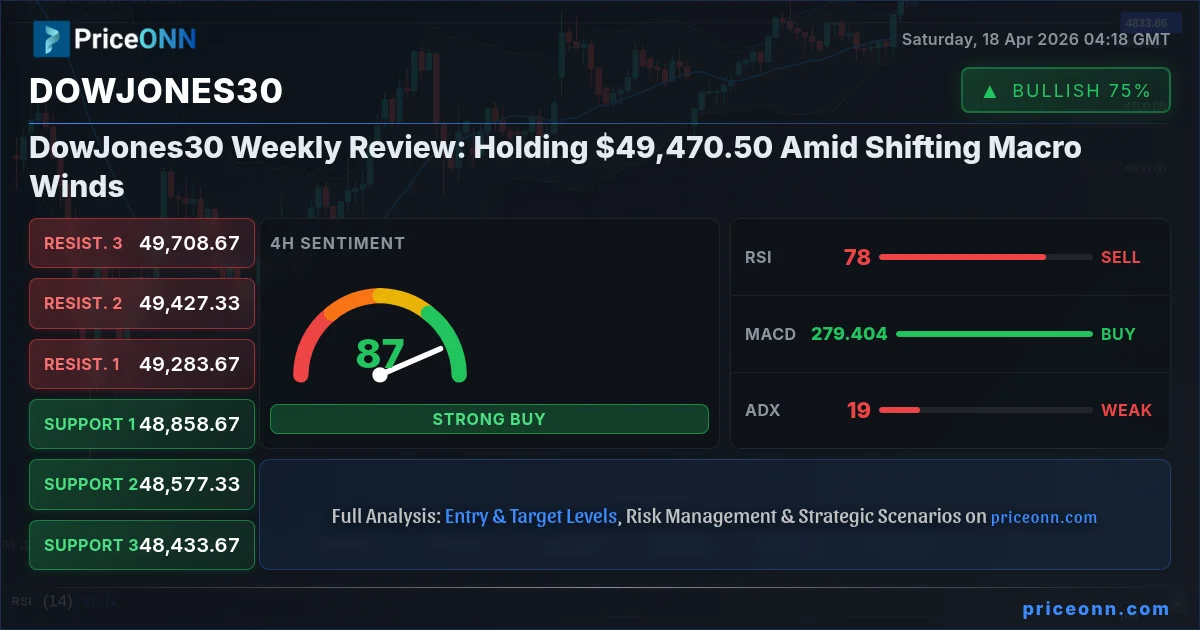
The past week saw the Dow Jones Industrial Average (DJIA) navigate a complex landscape, ultimately closing at $49,470.50 with a solid 1.74% gain. This upward momentum, however, occurred against a backdrop of mixed economic signals and shifting investor sentiment, suggesting that the path forward may not be a straight line. While the index managed to hold its ground and even push higher, the underlying economic currents and the implications of upcoming data releases warrant a closer look. This review will dissect the key events of the past week, analyze the technical levels that defined the trading range, and provide a forward-looking perspective on what to expect in the coming trading sessions. Understanding the interplay between macroeconomic drivers and market reactions is crucial for deciphering the Dow's next move.
- The DowJones30 closed at $49,470.50, marking a 1.74% weekly gain, driven by a late-week rally.
- Critical support for the DJIA sits at $48,413.33, tested implicitly by the week's trading range; resistance looms at $48,752.33.
- While the 1D RSI at 69.49 suggests bullish momentum, the 1H RSI at 73.42 signals potential overbought conditions, indicating caution is needed.
- The DXY's retreat to 97.90 provided some relief to risk assets, but its next move will be crucial for the Dow's correlation.
Market Dynamics and Key Drivers
Last week's trading on the Dow Jones Industrial Average was a tale of two halves. Early in the week, caution prevailed as investors digested a mixed bag of economic data and awaited further clarity on central bank policy. However, a significant shift occurred towards the latter part of the week, seemingly triggered by a combination of factors including a slight easing in geopolitical tensions and a more dovish-than-expected tone from some economic indicators. This late-week surge propelled the Dow to its closing price of $49,470.50, a level that represents a significant psychological barrier as well as a key technical point. The weekly gain of 1.74% indicates a resilient market, but the underlying volatility and the rapid shifts in sentiment highlight the fragile nature of the current economic recovery. We observed a notable correlation with broader US equity indices, with the S&P 500 and Nasdaq also posting gains, underscoring a general risk-on sentiment that emerged towards the week's end.
The strength of the US dollar, as measured by the DXY, also played a role. While the DXY experienced a slight dip to 97.90 towards the end of the week, its earlier strength had exerted some pressure on risk assets. This inverse relationship is a well-established market dynamic; a stronger dollar often makes US exports more expensive and can signal tighter financial conditions, potentially dampening enthusiasm for equities. However, the recent decline in the DXY, even if modest, provided some breathing room for the Dow. The interplay between the dollar's trajectory and the Federal Reserve's monetary policy stance remains a paramount concern for market participants. Any indication of a shift in Fed policy, whether dovish or hawkish, can dramatically influence both currency markets and equity valuations, and this will be a key focus in the upcoming week.
Furthermore, the performance of other risk assets, such as Bitcoin, offered a broader gauge of market sentiment. While Bitcoin saw some consolidation around the $75,000 mark, its general upward trend has, at times, coincided with a risk-on environment that also benefits the Dow. The cryptocurrency market's recovery, despite its inherent volatility, can be seen as a barometer for overall investor appetite for risk. When Bitcoin is showing resilience or upward momentum, it often correlates with a broader acceptance of risk, which can translate into positive flows for traditional equity markets like the Dow Jones. This interconnectedness means that developments in the crypto space, even if seemingly distant, can provide subtle clues about the prevailing market mood and potential future direction for major indices.
Sectoral Performance and Key Contributors
Delving deeper into the Dow Jones' constituents, the past week's performance was not uniform across all sectors. While the index closed higher, the gains were driven by a select few industries, highlighting a market that is not yet fully breadth-driven. The energy sector, despite its significant price movements in recent weeks, showed signs of stabilization, with WTI crude hovering around $86.42 and Brent crude near $92.54. These levels, while volatile, indicate that the immediate inflationary pressures from oil prices might be easing, providing some relief to the broader economy. A stable or declining energy price environment is generally supportive of consumer spending and corporate margins, which are crucial for the Dow's components.
Conversely, the technology sector, a significant weight in the Dow Jones and particularly in the Nasdaq 100, showed robust strength. The Nasdaq 100's impressive 1.45% gain to 26682.75, with its RSI at 72.58 suggesting overbought conditions on the hourly chart, points to strong investor confidence in tech valuations. This strength in tech often acts as a leading indicator for the broader market, including the Dow. Companies involved in artificial intelligence, cloud computing, and semiconductors have been particularly in focus, attracting significant capital inflows. This sector-specific strength has been a key contributor to the Dow's overall positive performance, demonstrating the outsized impact that a few high-growth industries can have on the blue-chip index.
Other sectors, such as industrials and financials, showed more muted performance. While there were pockets of strength, the overall trend was less pronounced compared to technology. This divergence suggests that while the market has a positive bias, investors are still being selective, favoring companies with strong growth prospects and resilient business models. The financial sector, in particular, is sensitive to interest rate expectations. With the Federal Reserve's policy remaining a key variable, the banking and financial services companies within the Dow will be closely watching any signals that might indicate a shift in the interest rate environment. Their performance will be a critical barometer for the broader economic outlook.
Technical Analysis: Levels to Watch
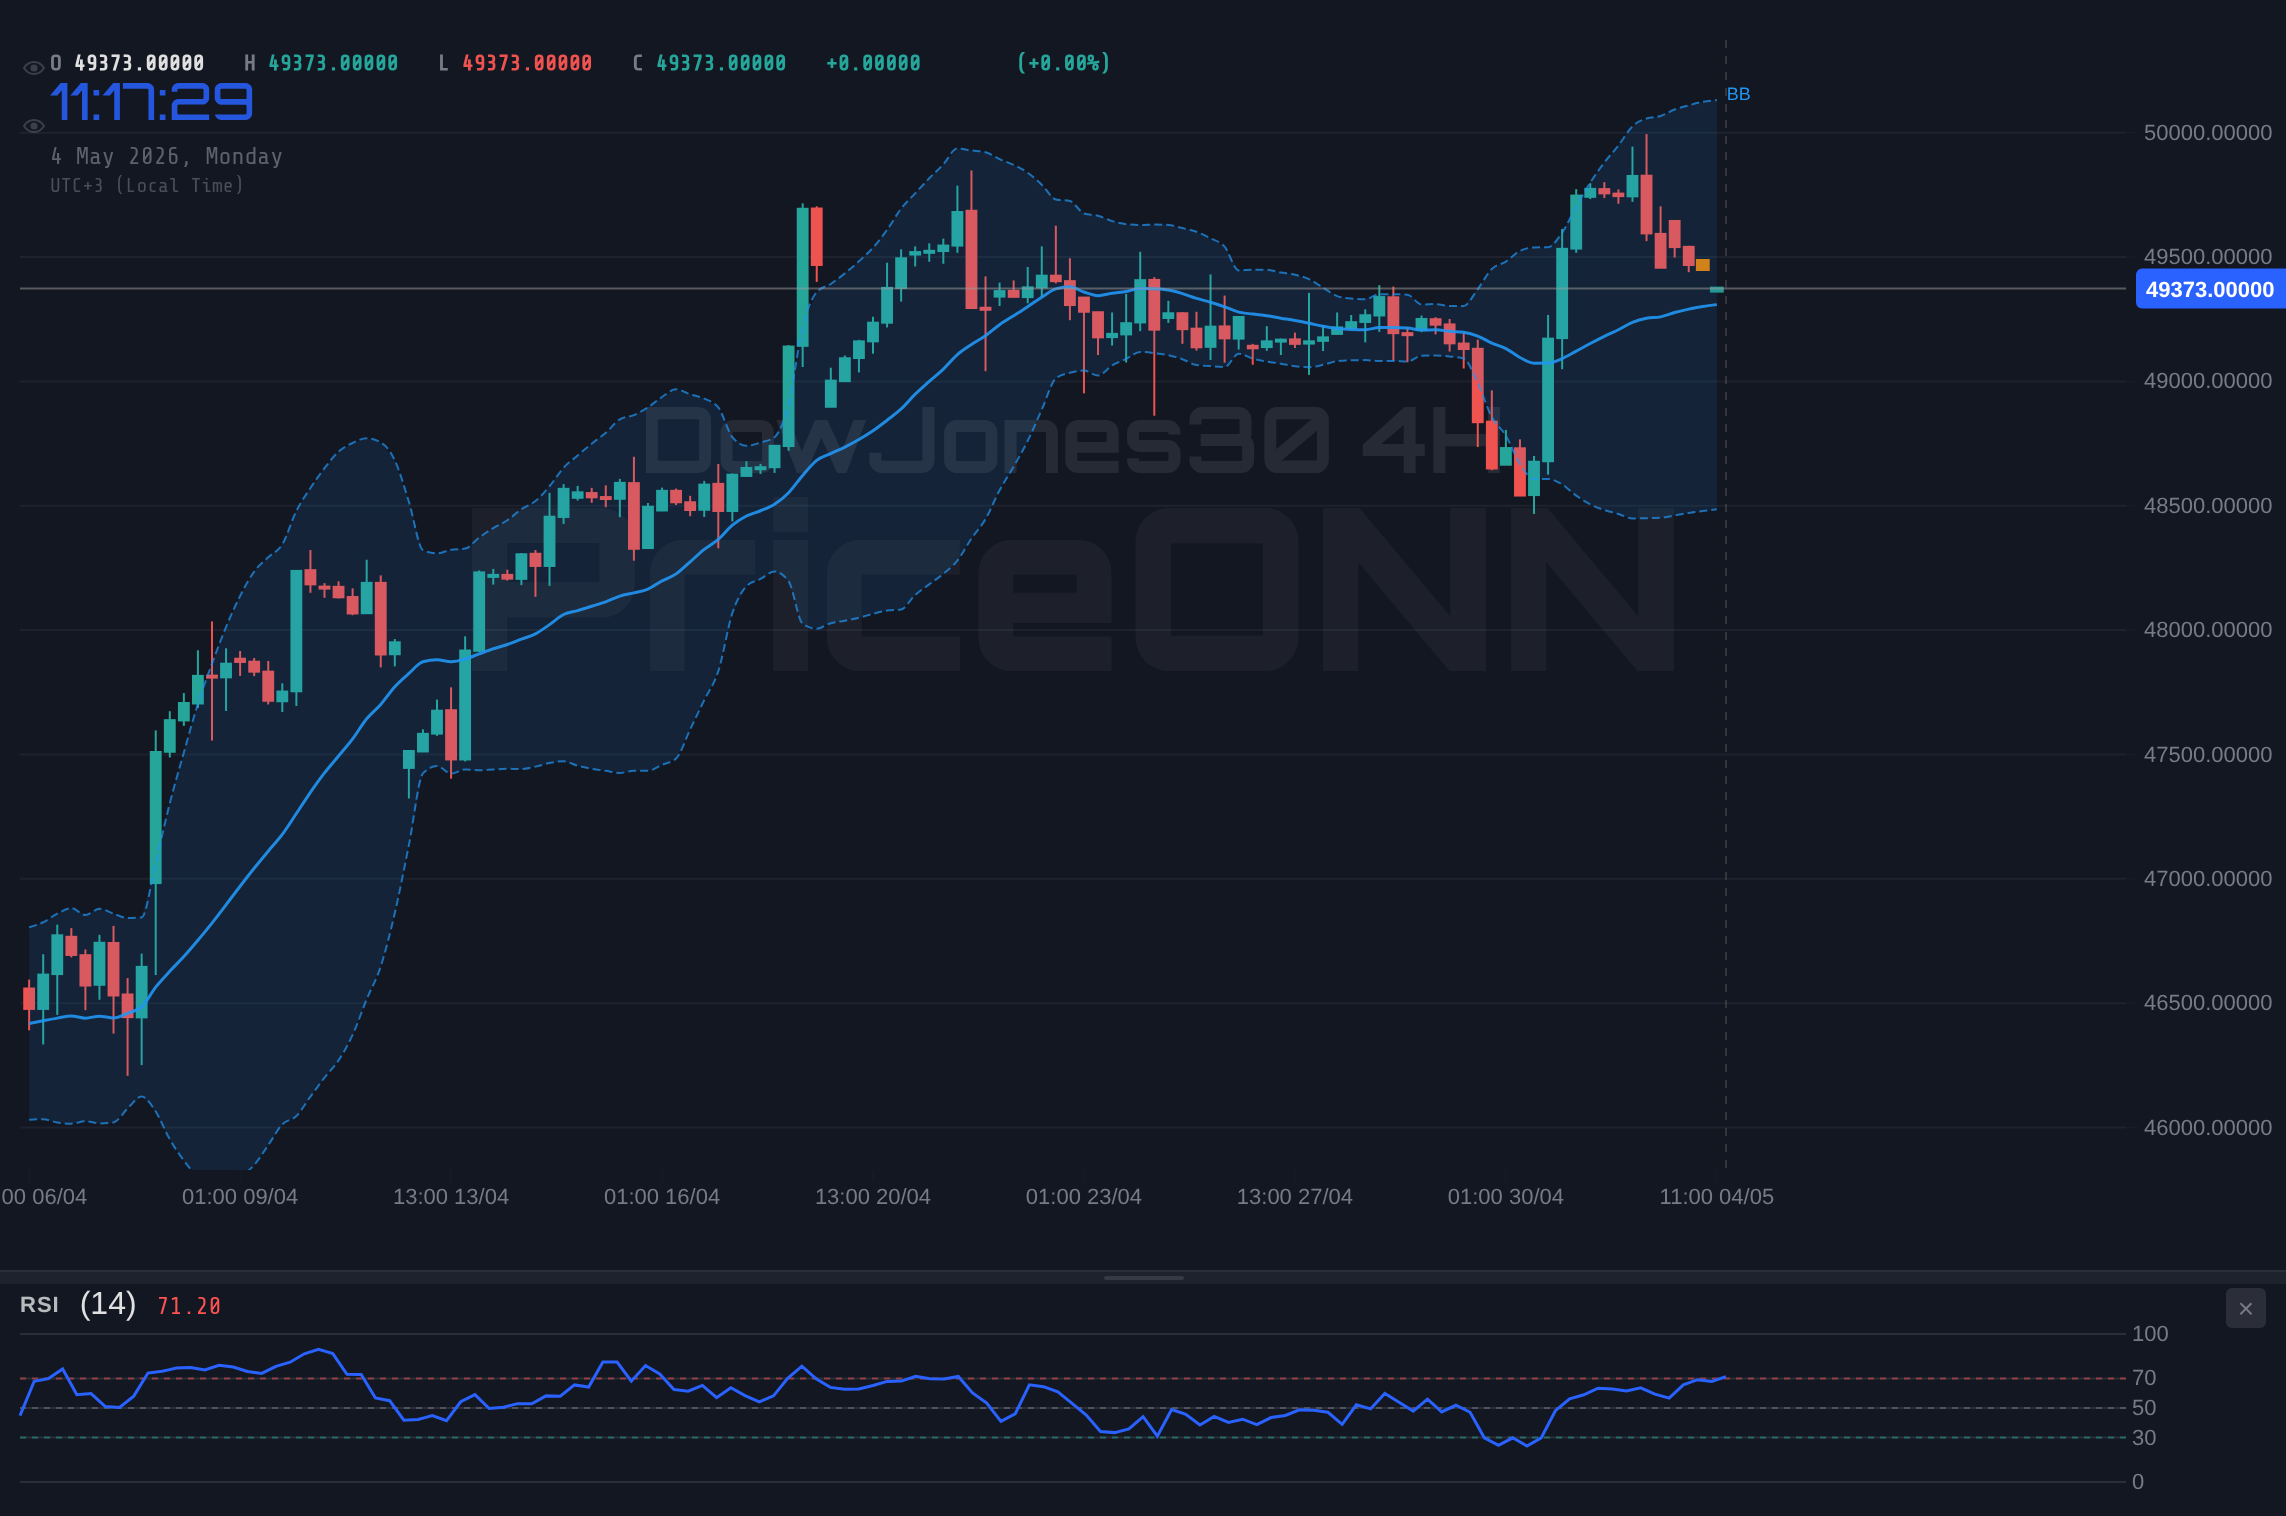
From a technical perspective, the Dow Jones Industrial Average's journey last week was characterized by a strong push higher towards the week's close. The index finished at $49,470.50, having navigated through a range that tested both its upper and lower boundaries. On the daily chart, the RSI stands at a healthy 69.49, indicating strong bullish momentum without being excessively overbought. However, the hourly RSI at 73.42 presents a more cautious picture, suggesting that the recent surge might have pushed the index into short-term overbought territory, potentially leading to some consolidation or profit-taking in the immediate future. This divergence in RSI readings across different timeframes is a classic sign of a market at a critical juncture, where conviction is high but caution is warranted.
The ADX indicator provides further context. On the 1-hour chart, the ADX is at 43.4, signaling a strong upward trend. However, on the 4-hour and daily charts, the ADX readings are lower (18.84 and 24.92, respectively), indicating a weaker trend strength over longer timeframes. This discrepancy suggests that while the current intraday momentum is strong, the longer-term trend might be consolidating or losing some of its conviction. This is not necessarily a bearish sign, but it implies that the sustainability of the current rally will depend on continued positive catalysts and a lack of significant headwinds.
Key levels remain paramount. The immediate resistance for the Dow Jones is at $48,752.33, a level that was approached and, in some intraday trading, potentially breached, but not confirmed by the daily close. Holding above this level would be crucial for further upside potential. On the downside, the primary support level to watch is $48,413.33. A decisive break below this level, especially on significant volume, could signal a shift in sentiment and potentially trigger a deeper correction. The historical price action around these levels suggests they are significant psychological and technical barriers that traders will be closely monitoring in the upcoming week. The tight range observed on the 4-hour chart, with ADX at 18.84, also points towards a potential period of consolidation before the next significant move.
Economic Calendar and Forward-Looking Expectations
The economic calendar for the upcoming week is packed with high-impact events that are likely to dictate market direction. Investors will be keenly watching the release of key inflation data, including CPI and PCE figures, which will provide crucial insights into the Federal Reserve's potential path forward regarding interest rates. The current market pricing, as reflected in Fed Fund Futures, suggests a growing probability of a Fed pause or even a pivot towards rate cuts later in the year, but any deviation from these expectations could trigger significant market volatility. The actual figures released will be compared against forecasts, and any surprises could lead to sharp movements in the Dow Jones, as well as in currency markets and commodities.
Employment data will also be in focus. Following recent figures that showed some cooling in the labor market, the upcoming Non-Farm Payrolls (NFP) report will be closely scrutinized. A stronger-than-expected NFP reading could reignite inflation concerns and push back expectations of Fed rate cuts, potentially pressuring the Dow. Conversely, a weaker report might reinforce the narrative of an economic slowdown, which paradoxically could be seen as positive for equities if it increases the likelihood of accommodative monetary policy. The market's reaction will likely depend on the degree of the deviation from forecasts and the overall narrative surrounding economic growth and inflation.
Furthermore, several high-profile speeches from central bank officials are scheduled. These pronouncements often provide subtle clues about future policy direction and can significantly influence market sentiment. Investors will be looking for any hints regarding the Fed's stance on inflation, employment, and the overall health of the economy. The Treasury yield curve, particularly the spread between short-term and long-term yields, will also be a critical indicator to monitor, as its shape often provides a forward-looking view of economic expectations and potential recession risks. The confluence of these data points will create a dynamic environment for traders.
Key upcoming events include the release of USD CPI and PCE data, which will be crucial for inflation assessment, and the Non-Farm Payrolls report, offering insights into labor market strength. Additionally, statements from Federal Reserve officials will be closely monitored for policy direction cues.
Geopolitical Landscape and Risk Appetite
The geopolitical backdrop continues to be a significant factor influencing market sentiment and risk appetite. While some of the immediate tensions that dominated headlines in previous weeks may have somewhat receded, the underlying geopolitical risks remain elevated. The ongoing conflict in Eastern Europe, coupled with simmering tensions in the Middle East, continues to cast a shadow over global economic stability. These geopolitical factors have a direct impact on energy prices, supply chains, and overall investor confidence, all of which can ripple through to indices like the Dow Jones.
The price of oil, for instance, remains a sensitive indicator of geopolitical stability. Fluctuations in crude prices, influenced by OPEC+ decisions and regional conflicts, can directly impact inflation expectations and corporate costs. The current levels for WTI and Brent crude suggest that while the immediate supply shock fears may have subsided, the market remains on edge, ready to react to any new developments. A sustained rise in oil prices could reignite inflation concerns, potentially forcing central banks to adopt a more hawkish stance, which would be detrimental to equity markets. Conversely, stable or declining oil prices could provide a tailwind for the Dow.
The correlation between the US Dollar Index (DXY) and risk assets like the Dow Jones remains a critical relationship to monitor. As the DXY showed some weakness, retreating to 97.90, it provided a supportive environment for equities. However, the dollar's trajectory is heavily influenced by Fed policy expectations and global risk sentiment. Should geopolitical concerns escalate, we could see a renewed flight to safety, strengthening the dollar and putting pressure on the Dow. Therefore, a balanced assessment of both geopolitical risks and the Fed's policy outlook is essential for understanding the Dow's potential movements.
Navigating the Week Ahead: Scenarios and Strategy
Looking ahead, the Dow Jones Industrial Average stands at a pivotal point, having closed the week at $49,470.50. The technical indicators present a mixed picture, with strong intraday momentum but signs of potential overbought conditions on shorter timeframes. The upcoming economic data releases and central bank commentary will be the primary catalysts determining the next significant move. Several scenarios could unfold:
Bearish Scenario: Correction Looming?
40% ProbabilityBullish Scenario: Rally Continues
55% ProbabilityConsolidation Phase: Choppy Trading
5% ProbabilityThe probability assigned to each scenario reflects the current technical picture and the potential impact of anticipated economic events. The bullish scenario holds a slight edge, contingent on positive economic data and a continued dovish stance from the Fed. However, the bearish scenario remains a significant risk, particularly if inflation proves stickier than expected or if geopolitical risks re-emerge forcefully. Traders should exercise prudent risk management, using the defined support and resistance levels as guideposts. Patience will be key; waiting for clear confirmation of a trend before committing significant capital is always advisable. The market's ability to digest upcoming data without significant negative reactions will be the ultimate test.
As we look towards the close of the trading week and prepare for the next, it's clear that the Dow Jones Industrial Average is at a crucial juncture. The $49,470.50 closing price is a testament to the market's resilience, but the underlying economic and geopolitical currents are far from settled. The interplay between inflation data, labor market figures, and central bank policy will undoubtedly shape the narrative in the coming days. Traders and investors alike must remain vigilant, closely monitoring the key technical levels and economic releases. The market is dynamic, and opportunities often arise from uncertainty. By staying informed, managing risk effectively, and waiting for clear setups, participants can navigate these choppy waters and position themselves for potential gains.
Frequently Asked Questions: DowJones30 Analysis
What happens if the DowJones30 closes below $48,413.33 support this week?
A close below the $48,413.33 support level would invalidate the bullish outlook and likely trigger a move towards the next support at $48,201.67. This would signal increasing bearish sentiment, potentially driven by concerning economic data or hawkish Fed commentary.
Should I consider buying the DowJones30 at current levels of $49,470.50, given the RSI at 73.42 on the 1H chart?
Buying at $49,470.50 requires caution due to the 1-hour RSI at 73.42 indicating overbought conditions. A more prudent approach would be to wait for a pullback towards support levels like $48,413.33 or for confirmation of continued bullish momentum above $48,752.33.
Is the RSI at 69.49 on the daily chart a sell signal for the DowJones30 right now?
An RSI of 69.49 on the daily chart suggests strong bullish momentum but is not yet in the extreme overbought territory typically associated with a sell signal. It indicates the uptrend is healthy, but traders should watch for divergence or a move above 70 for potential caution.
How will upcoming US CPI and NFP data affect the DowJones30 this week?
Higher-than-expected CPI and strong NFP data could increase inflation concerns, potentially leading the Fed to maintain a hawkish stance and causing the DowJones30 to retreat from current levels. Conversely, weaker data might support a dovish Fed outlook, benefiting the index.
Track markets in real-time
AI-powered analysis, technical indicators and real-time price data.
Join Our Telegram Channel
Breaking market news, AI analysis and trading signals instantly.
Join Channel