

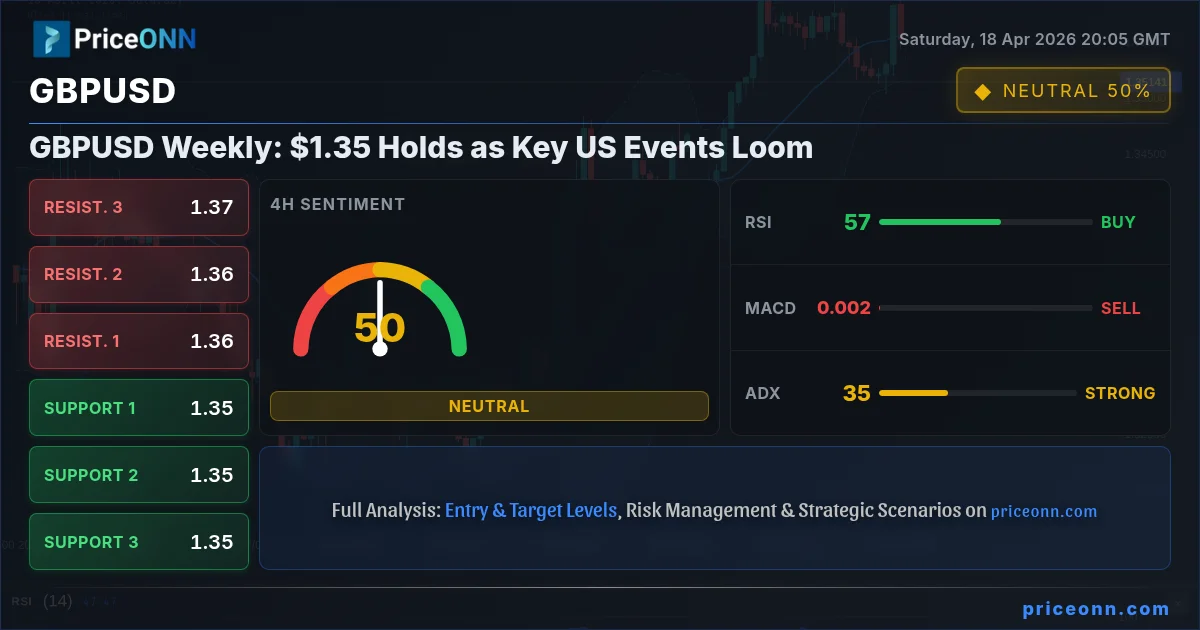
The GBPUSD pair found itself navigating a relatively flat trade around the $1.35 mark last week, a period characterized less by dramatic price swings and more by the palpable anticipation of significant economic events across the Atlantic. As we close out the week, the Sterling-Dollar exchange rate stands at a crucial juncture, with Friday's close hovering near $1.35. This relative stability, however, belies the underlying currents of shifting market sentiment, divergent central bank outlooks, and the ever-present influence of macroeconomic data. With the UK economy showing pockets of strength and the US economy facing inflationary pressures and policy uncertainty, traders are meticulously dissecting every piece of incoming data and every subtle shift in the geopolitical landscape. This weekly review will delve into the key developments that shaped the GBPUSD's trajectory last week, examine the technical levels that held firm or were breached, and outline the critical events and levels to monitor as we head into the coming trading week.
- GBPUSD closed the week near $1.35, indicating a period of consolidation amidst anticipation of US data.
- Critical support for GBPUSD remains at $1.34953, a level tested multiple times this week.
- The US Dollar Index (DXY) showed weakness, trading around 97.9, which offered some underlying support to GBPUSD.
- Upcoming US Retail Sales and inflation data are key catalysts expected to drive significant volatility in the coming week.
Navigating the Calm Before the Storm: Last Week's GBPUSD Landscape
Last week presented a nuanced picture for the GBPUSD currency pair. While the pair hovered around the $1.35 level, the underlying narrative was one of cautious positioning ahead of pivotal US economic releases. The Sterling itself showed resilience, buoyed by surprisingly strong UK GDP figures earlier in the week. Data indicated a 0.5% expansion in the economy, surpassing forecasts and suggesting a more robust recovery than many anticipated. This fundamental strength provided a solid floor for the pound, preventing sharper declines even as the US dollar exhibited some signs of weakness. Price action analysis on the daily chart showed GBPUSD testing resistance levels above $1.35736 but failing to sustain the gains, highlighting the immediate overhead pressure.
The market sentiment analysis revealed a cautious optimism surrounding the UK economy, contrasting with the more uncertain outlook for the US. Traders were keenly watching the US Dollar Index (DXY), which experienced some downward pressure, trading around 97.9. This dollar weakness, stemming partly from shifting expectations around Federal Reserve policy and a slight easing of geopolitical tensions, provided a tailwind for GBPUSD. However, the pair's inability to decisively break above key resistance levels, such as $1.35736, indicated that the upward momentum was not strong enough to overcome the prevailing caution. The multi-timeframe analysis showed conflicting signals: while the daily chart suggested a potential for further upside, the 1-hour chart indicated bearish momentum, reflecting the intraday choppiness and the market's indecision.
One of the most significant themes for GBPUSD last week was the anticipation surrounding upcoming US economic data. Traders were positioning themselves ahead of crucial releases like Retail Sales and inflation figures, knowing these could dramatically alter the market's perception of the Federal Reserve's next move. The market sentiment analysis showed a clear divergence in expectations: some analysts pointed to resilience in consumer spending, while others highlighted the persistent inflationary pressures that might force the Fed to maintain a hawkish stance. This data dependency created an environment where significant price action was deferred, leading to the consolidation observed around the $1.35 mark. The interplay between the relatively solid UK economic data and the looming US data created a tug-of-war, keeping the GBPUSD pair in a tight range for much of the week.
Geopolitical developments, though less pronounced than in previous weeks, continued to play a background role. While tensions surrounding the Strait of Hormuz had eased somewhat, contributing to a slight 'risk-on' sentiment that generally benefits Sterling, the broader global economic outlook remained a concern. The ongoing energy price volatility, with Brent crude trading around $92.54 and WTI at $86.42, served as a constant reminder of the inflationary risks that central banks globally are grappling with. This backdrop meant that any significant shift in risk appetite could quickly impact GBPUSD. For instance, a resurgence of geopolitical fears could lead to a flight to safety, benefiting the US dollar and putting pressure on the pound. Conversely, a sustained period of geopolitical calm could further support Sterling's recovery.
Technical Levels Under the Microscope: Support Holds, Resistance Persists
From a technical perspective, GBPUSD’s price action last week was largely defined by its interaction with key support and resistance levels. The $1.35 psychological level continued to act as a significant pivot point, with the pair consolidating in a tight range around it for much of the trading week. On the downside, the critical support zone identified between $1.34953 and $1.34662 proved resilient. Multiple tests of this area failed to yield a decisive breakdown, suggesting that buyers were stepping in to defend these levels. This support structure is crucial; a sustained break below it would likely signal a shift in short-term sentiment and open the door for further downside towards the $1.3417 mark.
Conversely, the resistance above the $1.35 mark proved a more formidable barrier. While the pair managed to breach $1.35736 on several occasions, it struggled to maintain its position above this level. The $1.36228 and $1.36519 levels acted as significant overhead hurdles, capping rallies and forcing profit-taking. This price action confirms the presence of strong selling pressure in the upper ranges, indicating that any upward move would require significant bullish conviction, likely driven by a catalyst such as unexpectedly strong UK data or a dovish surprise from the Federal Reserve. The daily RSI(14) reading of 58.46 shows a lean towards bullish momentum but remains comfortably in neutral territory, suggesting room for further upside if key resistance is cleared.
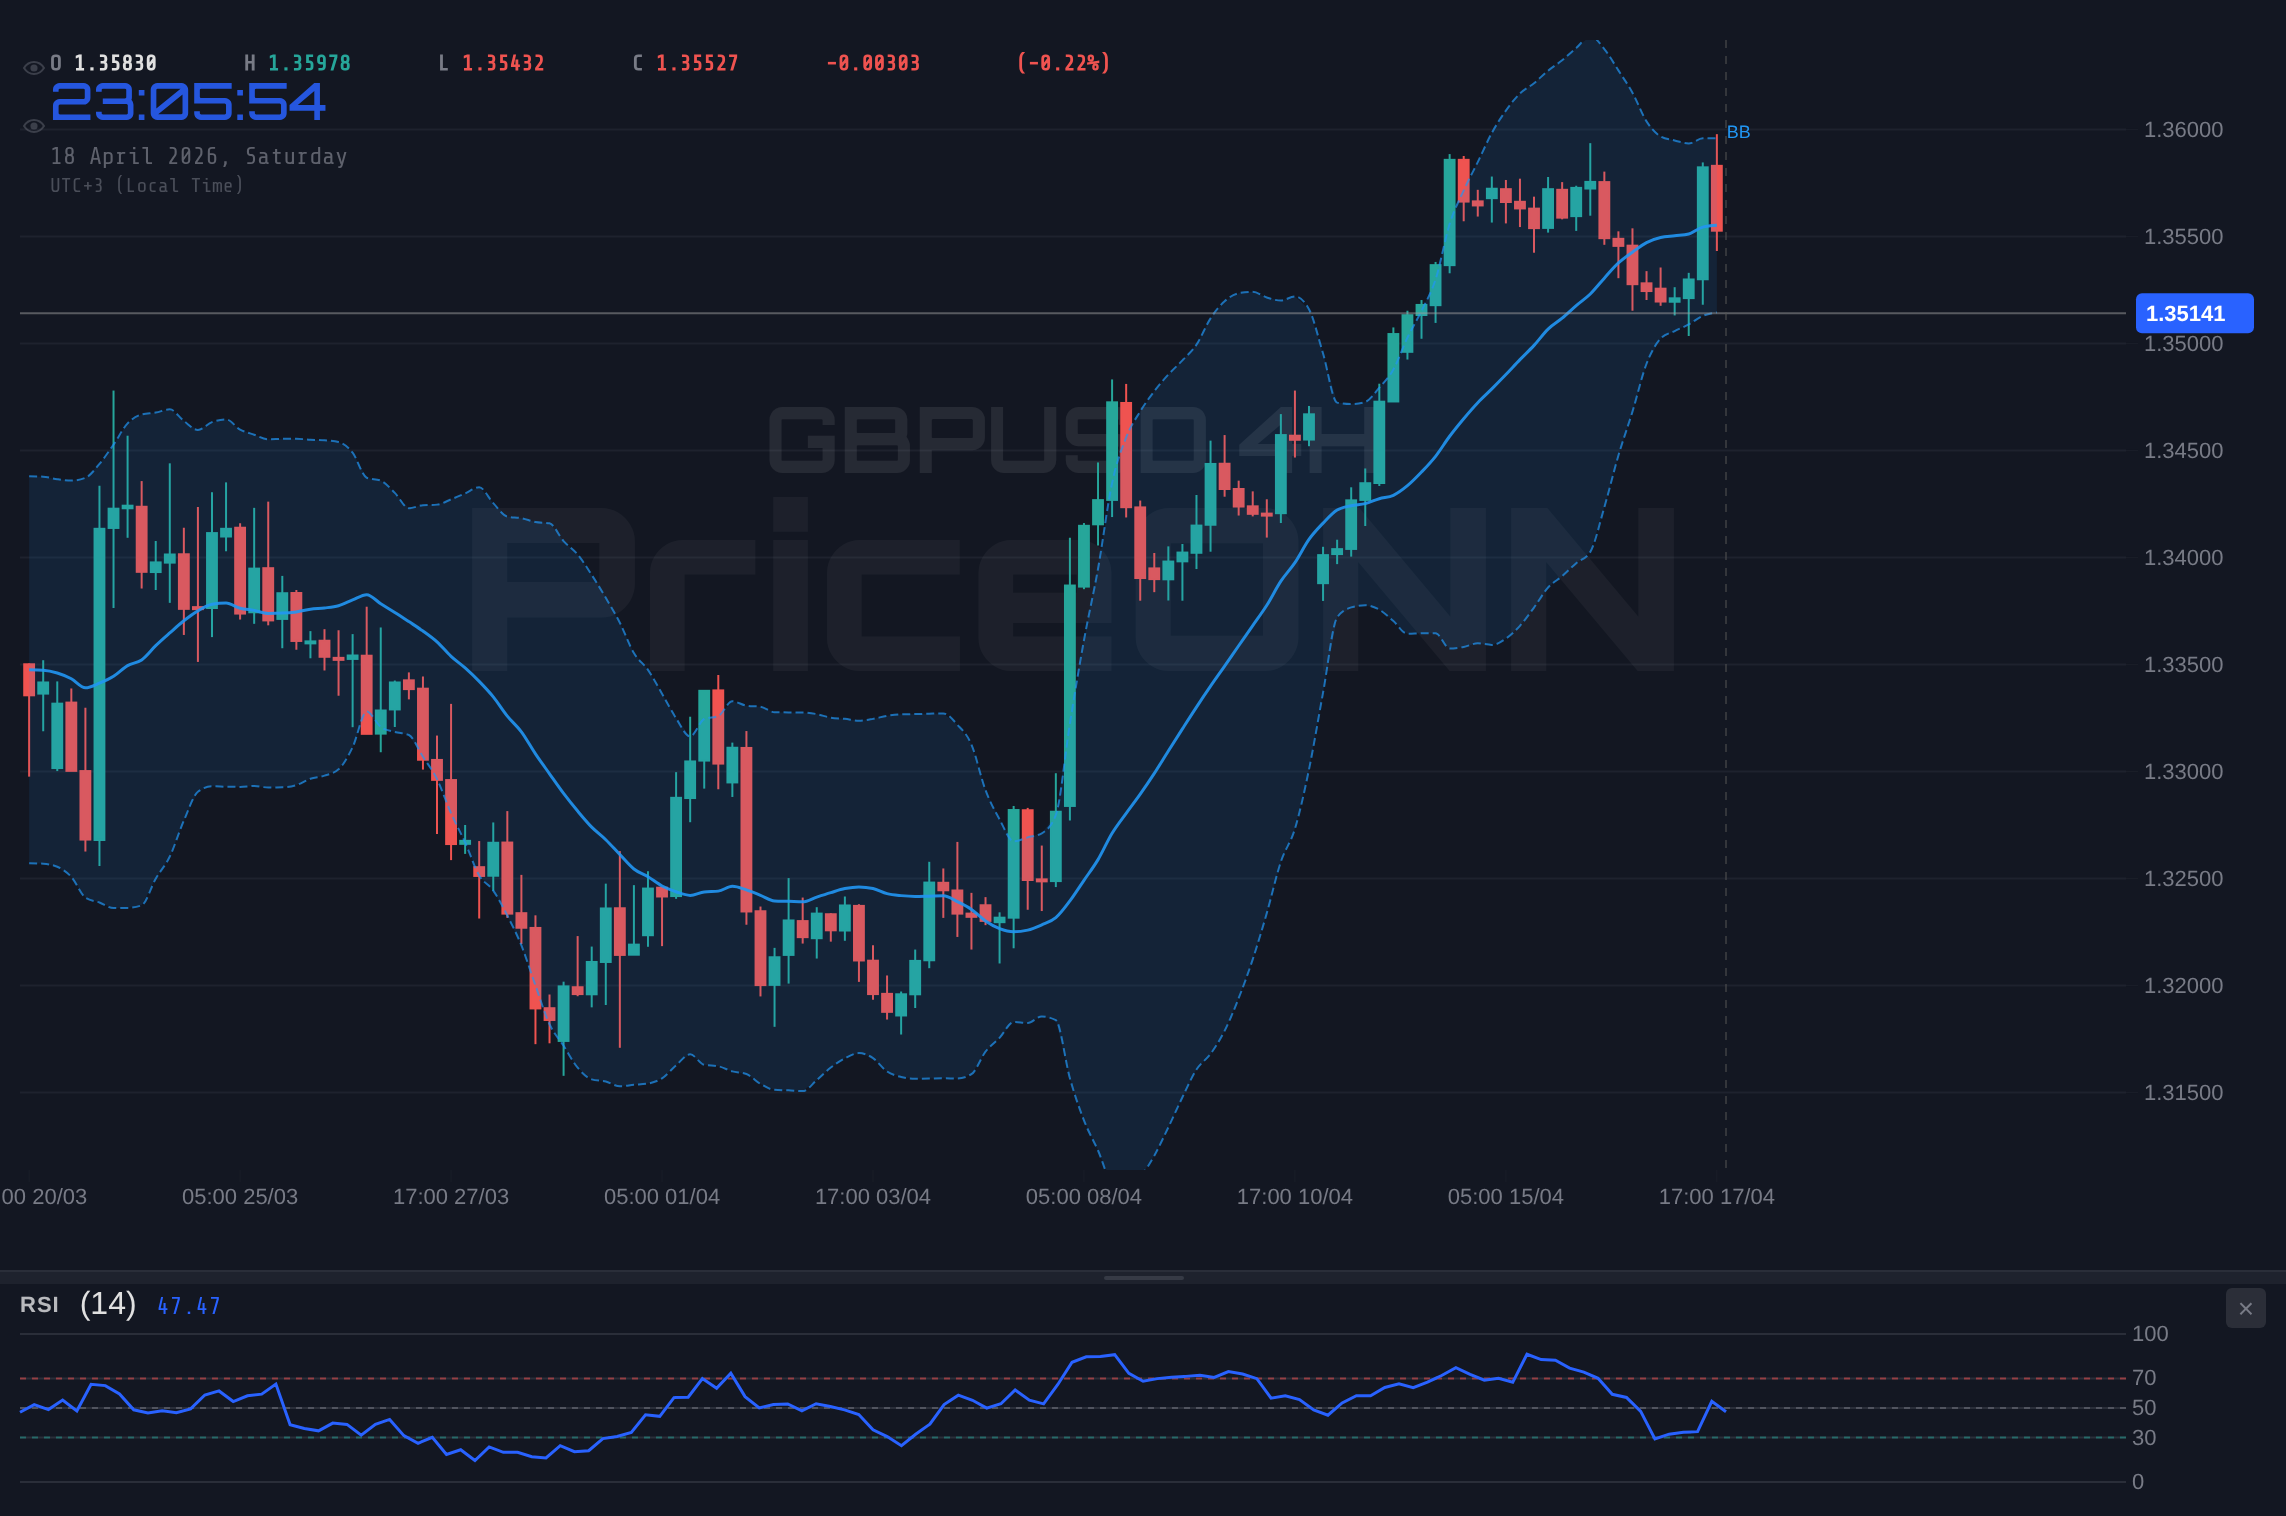
The 4-hour chart analysis provided a more mixed picture. While the trend is classified as neutral with a strength of 50%, indicators like ADX at 34.77 suggest a strong trend is present, albeit potentially in a range. The Stochastic indicator, showing %K at 56.31 and %D at 25.12, signals a potential for further upward movement, crossing bullishly. However, the MACD remains in negative momentum territory, indicating underlying selling pressure that could counter any bullish advances. This technical conflict highlights the indecision in the market. Traders were likely waiting for confirmation from either a decisive break of resistance or a clear failure at support before committing to larger positions. The Bollinger Bands on the 4-hour chart are currently trading below the middle band, suggesting a bearish bias in this timeframe, which contrasts with the daily chart's lean towards bullishness.
Looking at the shorter timeframes, the 1-hour chart painted a more bearish picture for intraday traders. The trend is identified as bearish with a strength of 89%, and the ADX at 18.18 indicates a weak trend, suggesting choppy, range-bound conditions rather than a clear directional move. The RSI(14) at 41.85 and MACD's negative momentum further supported this bearish short-term outlook. Stochastic K=21.26, D=50.46, also gives a bearish signal. This divergence between the longer-term daily view and the shorter-term hourly view underscores the importance of multi-timeframe analysis. For a sustained bullish move, GBPUSD would need to convincingly break and hold above the $1.35736 resistance, ideally supported by positive fundamental news. Conversely, a break below $1.34953 would likely trigger a sell-off, confirming the bearish bias seen on the hourly chart.
Fundamental Drivers: US Data Dominance and Fed Watch
The fundamental outlook for GBPUSD in the coming week is overwhelmingly shaped by the anticipated US economic data releases. With the Federal Reserve holding a data-dependent stance, key indicators such as Retail Sales, inflation metrics (like CPI, though not explicitly provided in the data, it's a standard consideration), and employment figures will be under intense scrutiny. Traders are particularly focused on whether consumer spending shows resilience (Actual: 26.7 vs Forecast: 10.3, Previous: 18.1 for a USD event) or falters under the weight of rising prices. A surprisingly strong reading could bolster the case for the Fed to maintain a tighter monetary policy for longer, potentially strengthening the US dollar and pressuring GBPUSD. Conversely, weaker-than-expected data might fuel speculation of an earlier Fed rate cut, leading to dollar weakness and a potential rally in the pair.
The current market pricing reflects a degree of uncertainty regarding the Fed's path. While some Fed officials have hinted at a more hawkish stance due to persistent inflation, the recent economic data has been mixed. This divergence creates a fertile ground for volatility. The DXY trading around 97.9, showing a daily decrease, suggests that the market is not fully pricing in a prolonged period of high interest rates. However, the 1-hour DXY trend is neutral (Strength 50%), while the 4-hour shows a strong downtrend (Strength 37.19) and the daily chart a strong downtrend (Strength 26.2). This mixed picture for the dollar means that any significant US data surprise could lead to sharp, directional moves in GBPUSD. The potential for the Fed to signal a shift in policy, even subtly, remains a key driver for currency markets globally.
On the UK side, the recent strong GDP data (Actual: 0.5%, Forecast: 0.1%) provides a supportive fundamental backdrop for the Sterling. This suggests that the British economy is demonstrating a degree of robustness, which could allow the Bank of England (BoE) more flexibility in its monetary policy decisions. While the BoE is also grappling with inflation, the stronger growth figures might reduce the immediate pressure for aggressive rate cuts compared to other central banks. This divergence in economic performance and potential monetary policy paths between the UK and the US is a crucial factor for GBPUSD. If US data disappoints and the Fed signals a pivot, while the UK economy continues to show resilience, it could create a compelling fundamental case for GBPUSD to push higher towards the $1.36 level and beyond.
The energy market also plays an indirect but significant role. With Brent crude around $92.54 and WTI at $86.42, elevated oil prices continue to contribute to global inflationary pressures. While this might initially support commodity-linked currencies like the Canadian Dollar, it also poses a risk to global growth and could eventually lead to broader risk aversion, which typically benefits the US dollar. For GBPUSD, the impact is complex. Higher energy prices can indirectly weigh on the UK economy through increased costs for businesses and consumers. However, if these prices are driven by supply disruptions or geopolitical events, they can also trigger safe-haven flows that might strengthen the dollar, creating headwinds for Sterling. The market's reaction to the reopening of the Strait of Hormuz, as mentioned in recent news, is a key event to watch here, as any renewed tensions could quickly alter the risk landscape and impact currency pairs like GBPUSD.
Looking Ahead: Key Events and Levels to Watch
As we transition into the new trading week, the focus for GBPUSD will undoubtedly remain squarely on the upcoming US economic calendar. The release of US Retail Sales data on Tuesday will be a primary market mover. Analysts are anticipating a headline gain, partly driven by higher gasoline prices, but the underlying strength of consumer demand will be the key takeaway. A figure significantly above the forecast of 10.3% could reinforce the narrative of a resilient US economy and support the dollar, potentially pushing GBPUSD lower towards the $1.34953 support level. Conversely, a disappointing report could trigger a dollar sell-off and provide the necessary catalyst for GBPUSD to challenge resistance levels around $1.35736 and potentially $1.36228.
Further US data, including employment figures and inflation reports, will also be critical in shaping expectations for Federal Reserve policy. The market is currently pricing in a degree of uncertainty, and any data that deviates significantly from forecasts could lead to sharp repricing of Fed rate expectations. For instance, if inflation proves stickier than anticipated, it might push back expectations of Fed rate cuts, strengthening the dollar. This scenario would likely see GBPUSD testing its lower support levels. On the other hand, signs of cooling inflation or a weakening labor market could accelerate calls for Fed easing, weakening the dollar and providing a significant boost to GBPUSD, potentially targeting the $1.36717 resistance level.
From a technical standpoint, the $1.34953 support level remains the immediate floor for GBPUSD. A decisive close below this level on the daily chart would be a strong bearish signal, invalidating the current consolidation pattern and opening the path towards $1.3417. On the upside, the $1.35736 resistance is the first key hurdle. A sustained break above this level, confirmed by strong volume and bullish momentum indicators, would be required to signal a potential move towards the $1.36228 and $1.36717 resistance zones. The ADX reading on the daily chart at 25.1 indicates a strong trend is developing, so whichever direction the pair breaks out of its current range is likely to be sustained.
The interplay between these fundamental catalysts and technical levels will dictate the direction of GBPUSD in the coming week. Traders will be looking for confluence between macroeconomic data, central bank signals, and price action at key technical levels. The DXY's trajectory will also be a critical barometer; if it continues its downtrend from the 4-hour and daily charts (currently at 97.9), it will provide underlying support for GBPUSD. However, any unexpected strength in the dollar could quickly reverse the pair's fortunes. The market sentiment remains fragile, meaning that unexpected news or data surprises could lead to significant volatility, making disciplined risk management paramount.
Bearish Outlook: Consolidation Breakdown
65% ProbabilityNeutral Scenario: Range-Bound Consolidation
25% ProbabilityBullish Scenario: Breakout Above Resistance
10% ProbabilityFrequently Asked Questions: GBPUSD Analysis
What happens if GBPUSD breaks below the $1.34953 support level this week?
A confirmed break below $1.34953 on the daily chart would invalidate the current consolidation pattern. This bearish signal would likely trigger further selling pressure, with initial targets at $1.34662 and potentially extending down to the significant support zone at $1.34170.
Should I consider buying GBPUSD at current levels around $1.35 given the RSI at 58.46 on the daily chart?
Buying at current levels requires caution. While the daily RSI at 58.46 suggests some bullish momentum, it's not yet in overbought territory. A more prudent approach would be to wait for a confirmed break above the $1.35736 resistance, indicating stronger conviction, or for price to retest and hold the $1.34953 support level with clear bullish signals.
Is the MACD negative momentum on the 1-hour chart a strong sell signal for GBPUSD?
The negative MACD momentum on the 1-hour chart, coupled with an ADX of 18.18, indicates bearish pressure in the short term, but suggests a weak trend. While it points to intraday weakness, it's not a standalone sell signal. Confirmation would be needed, such as a break below the $1.34953 support, to validate a more significant bearish move.
How will the upcoming US Retail Sales data potentially affect GBPUSD this week?
Stronger-than-expected US Retail Sales data (forecast 10.3%) could strengthen the US dollar, potentially pushing GBPUSD towards its $1.34953 support. Conversely, weaker data might fuel Fed rate cut expectations, weakening the dollar and allowing GBPUSD to challenge the $1.35736 resistance level, with a possibility of testing $1.36228.
Patience is a virtue in trading. Wait for the data to unfold and confirm the next move, managing risk diligently at every step. The market always provides another opportunity.
Technical Outlook Summary
| Indicator | Value | Signal | Interpretation |
|---|---|---|---|
| RSI (14) Daily | 58.46 | Neutral | Nearing overbought, but still room to run. |
| MACD Daily | Positive | Bullish | Momentum is positive on the daily chart. |
| Stochastic Daily | K:84.86, D:90.46 | Bearish (Overbought) | Crossover in overbought territory suggests caution. |
| ADX Daily | 25.1 | Bullish Trend | Indicates a strong trend is developing. |
| Bollinger Bands Daily | Mid Band | Watch | Price is above the middle band, indicating upward bias. |
Track markets in real-time
AI-powered analysis, technical indicators and real-time price data.
Join Our Telegram Channel
Breaking market news, AI analysis and trading signals instantly.
Join Channel