

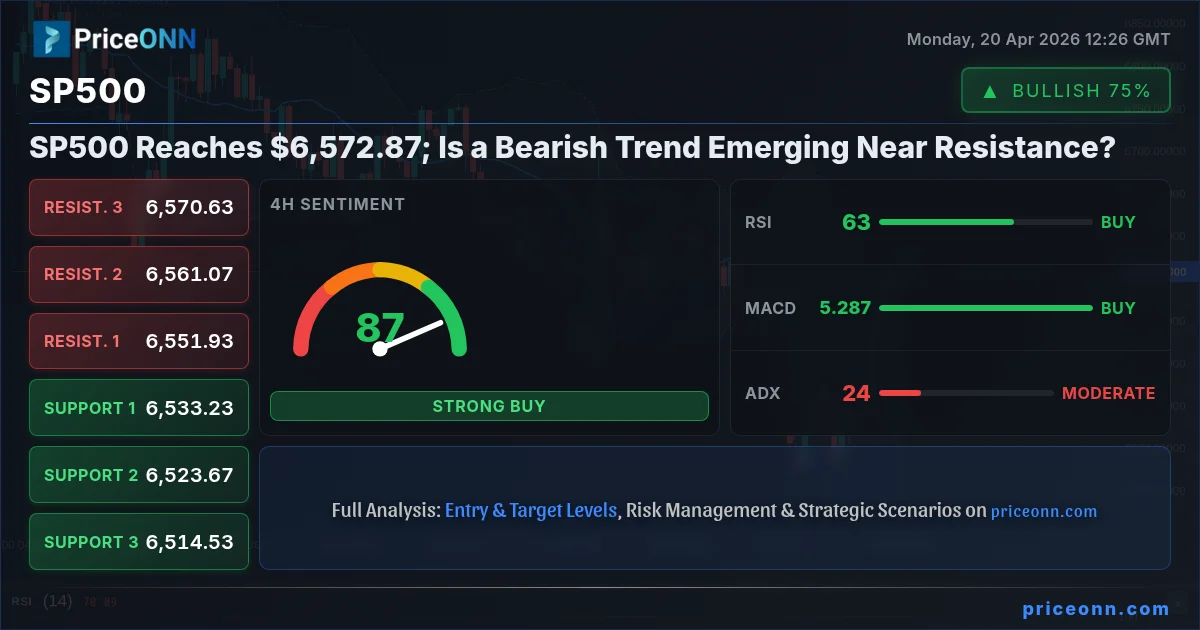
The S&P 500 (SP500) is currently navigating a critical juncture, trading at $6,572.87. This level places the index precariously close to resistance, while technical indicators present a complex picture of underlying momentum. The recent price action, coupled with broader market correlations and geopolitical undercurrents, suggests that while bullish sentiment has been dominant, the market is now at a crucial pivot point where caution may be warranted. Understanding the interplay between risk appetite, inflation expectations, and central bank policy will be key to deciphering the SP500's next move. This analysis delves into the multi-timeframe technicals, intermarket dynamics, and potential scenarios shaping the outlook for this key US equity index.
- RSI at 67.36 on the 1-hour chart signals approaching overbought conditions, suggesting potential selling pressure.
- Critical resistance sits at $6,577.27, a level the SP500 is currently testing after a strong upward move.
- ADX readings of 49.72 on the 1-hour and 24.23 on the 4-hour chart indicate a strong trend is in place, but the conflict suggests potential for a pullback or consolidation.
- Fed rate expectations and ongoing geopolitical tensions in the Middle East are influencing SP500 correlations with the DXY and Brent crude prices, creating a complex risk sentiment environment.
Navigating the SP500's Current Technical Landscape
The S&P 500’s journey to $6,572.87 has been characterized by robust upward momentum, particularly evident in the 1-hour and 4-hour timeframes where the trend strength signals are overwhelmingly bullish. However, as the index approaches the $6,577.27 resistance mark, a more nuanced view emerges. The 1-hour RSI standing at 70.95 is a classic warning sign of overbought territory, indicating that the bulls might be running out of steam and that a period of consolidation or even a short-term pullback is becoming increasingly probable. This divergence between the strong uptrend and the overbought oscillator is a common pattern that traders watch closely for potential reversals or significant pullbacks. The fact that this is occurring near a key resistance level amplifies the caution required.
Further complicating the picture is the ADX indicator. On the 1-hour chart, the ADX at 49.72 screams a very strong trend, but this is a high reading that often precedes a market top or a significant correction. Conversely, the 4-hour ADX at 24.23 suggests a moderately strong trend, which aligns better with a continuation scenario but still lacks the conviction for an aggressive breakout. This discrepancy in ADX readings across different timeframes highlights the indecision present at these elevated levels. It suggests that while the short-term momentum has been powerful, the conviction for a sustained move higher is waning, especially as the price grapples with significant overhead resistance. The market is essentially at a crossroads, with conflicting signals demanding careful risk management.
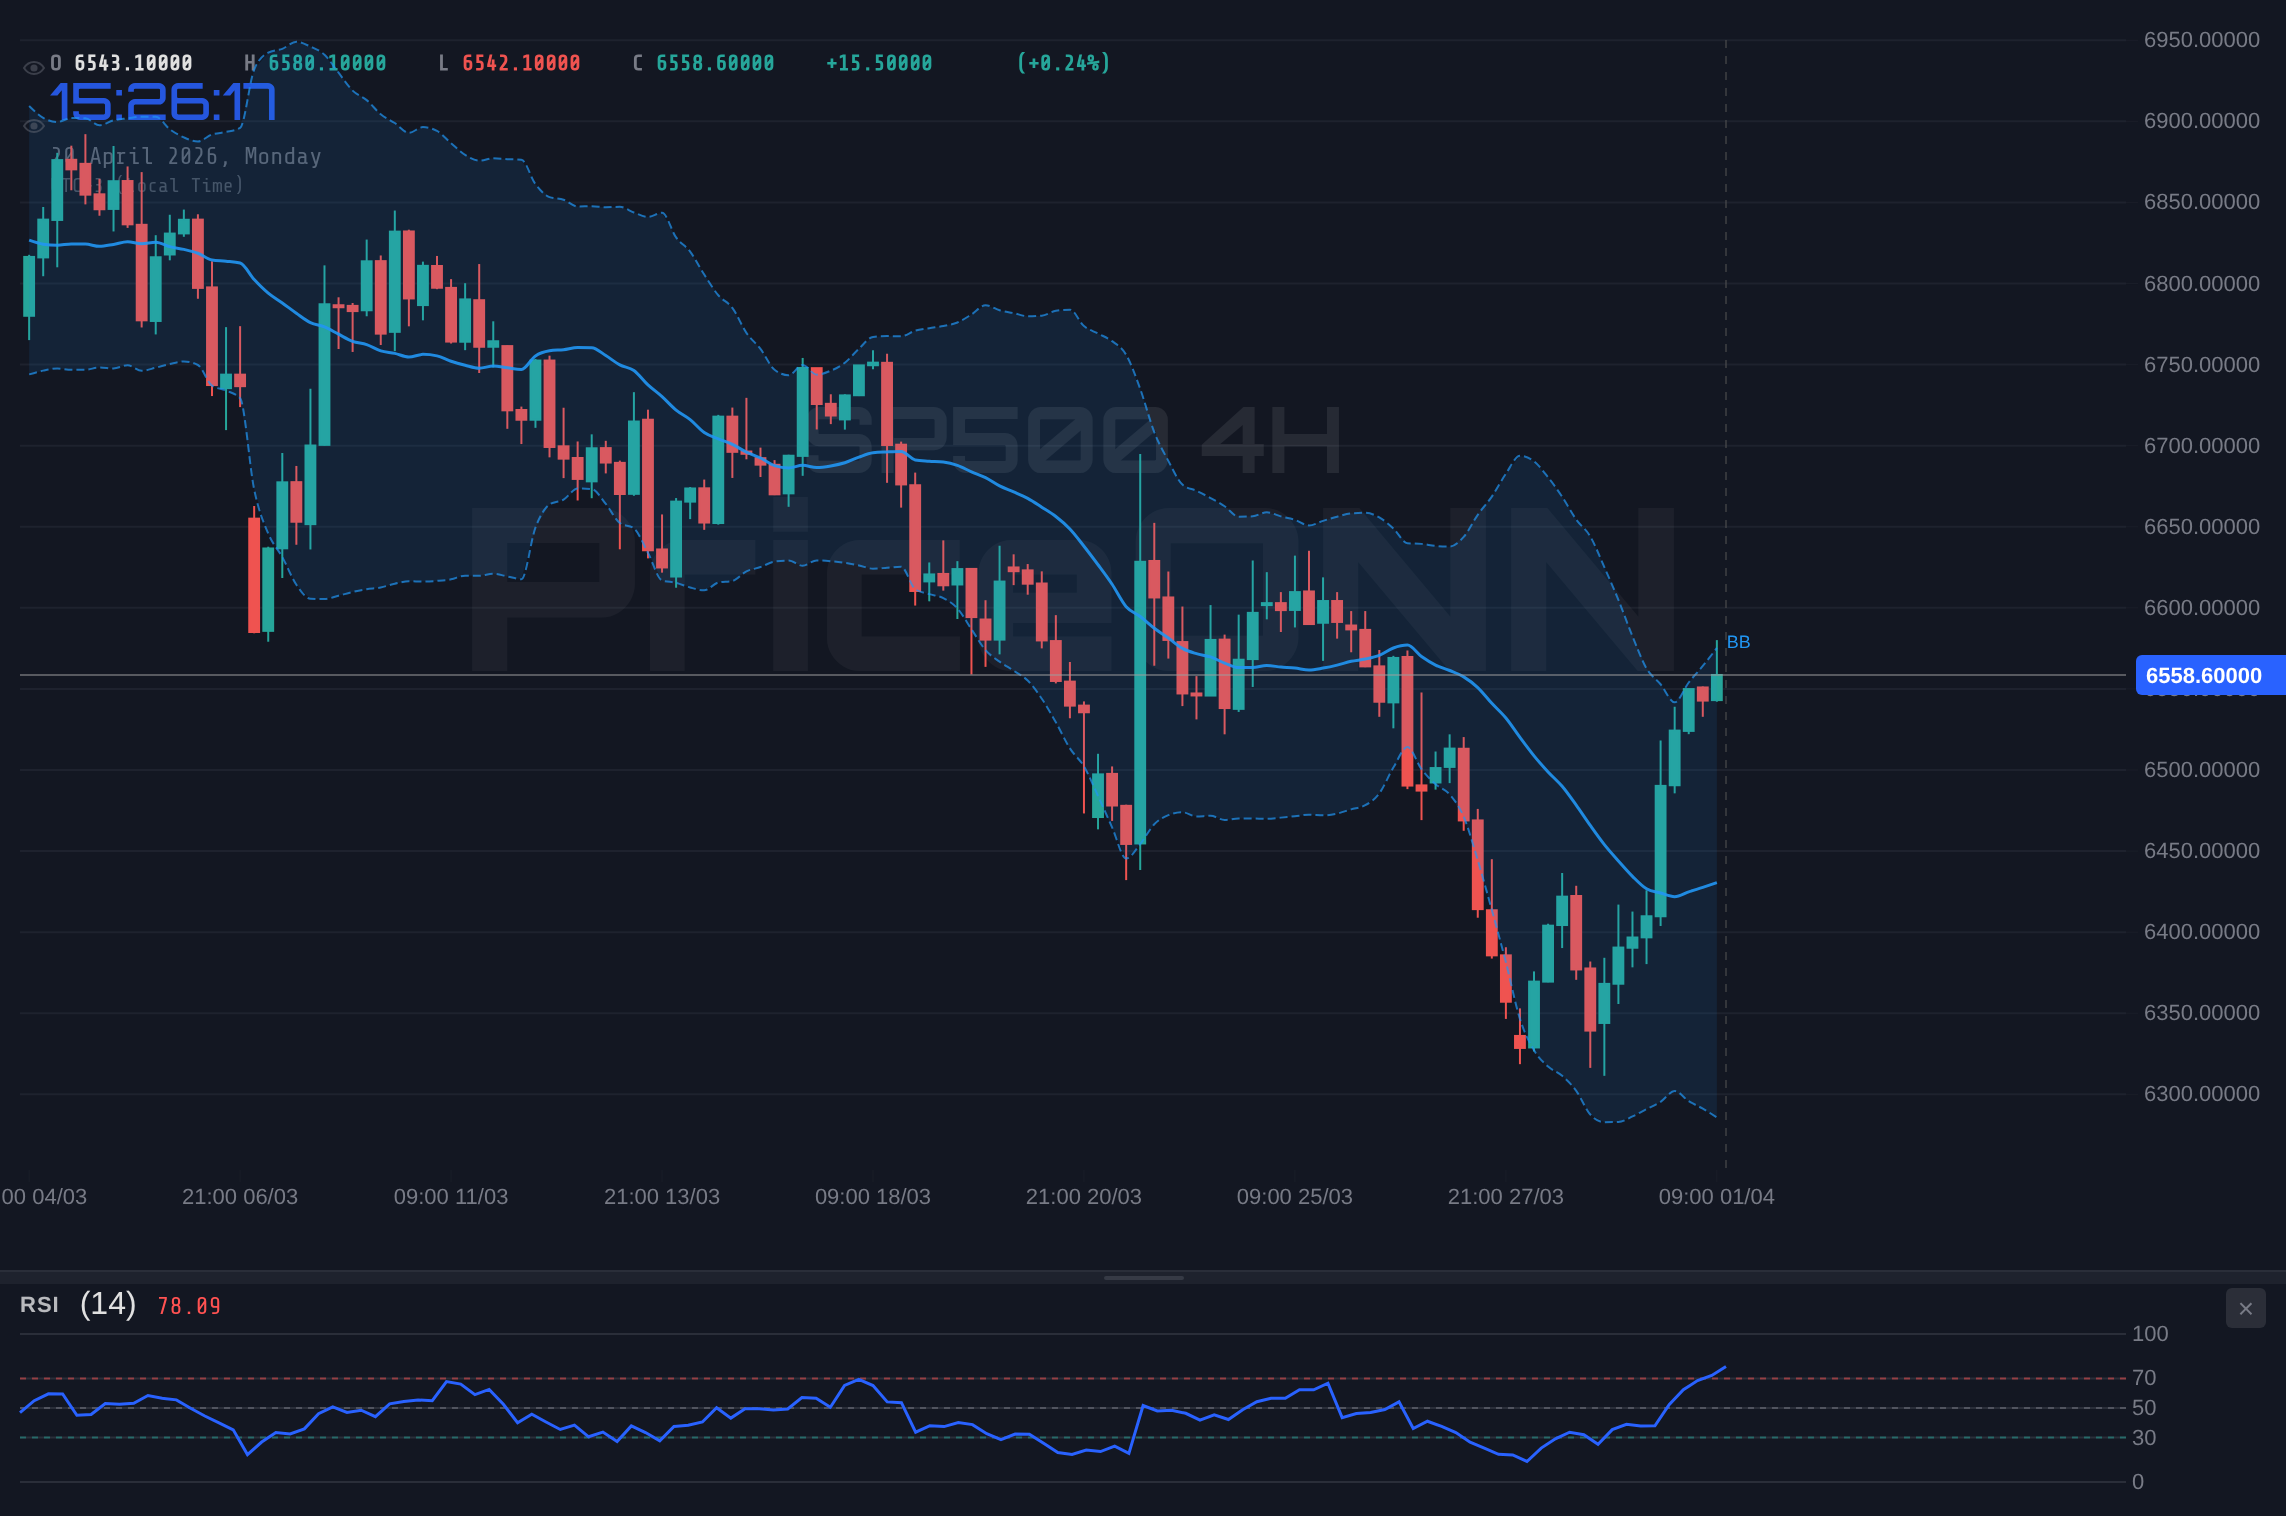
Intermarket Dynamics: The Dollar, Oil, and Risk Sentiment
The performance of the S&P 500 cannot be viewed in isolation. Its correlation with other major markets provides crucial context. The Dollar Index (DXY) is currently trading at 97.98, showing a slight upward bias in the 1-hour timeframe but a neutral stance overall, with the 4-hour showing strength and the daily indicating a downtrend. A strengthening dollar often exerts downward pressure on US equities, as it makes American goods more expensive for foreign buyers and can signal tighter global liquidity. However, in this instance, the DXY's mixed signals suggest its influence might be tempered. The recent news of easing Middle East tensions initially weakened the dollar, but renewed US-Iran tensions have provided some support, creating a volatile environment for currency markets that can spill over into equities.
Meanwhile, Brent crude oil is surging, currently priced at $95.93, with a significant 3.78% daily gain. This sharp rise, fueled by fears of a Strait of Hormuz closure and escalating Middle East tensions, is a potent inflation signal. Higher oil prices typically translate to higher energy costs for businesses and consumers, potentially dampening economic growth and increasing inflationary pressures. This scenario could complicate the Federal Reserve's policy decisions, forcing them to weigh inflation concerns against economic slowdown risks. For the SP500, rising oil prices present a double-edged sword: they can boost energy sector stocks but may also signal broader economic headwinds and increased costs for many other companies, potentially capping upside potential at these resistance levels.
The overall risk sentiment appears to be shifting. While the SP500 and Nasdaq 100 have shown strength, their RSI readings are flirting with overbought territory, and the Dow Jones 30 is showing a daily downtrend. This mixed picture suggests that while there's still some appetite for risk assets, the market is becoming increasingly cautious. Geopolitical flare-ups, like those in the Middle East, can quickly shift sentiment from risk-on to risk-off, leading investors to seek safe-haven assets. This backdrop of rising oil prices, a potentially strengthening dollar, and elevated equity valuations creates a complex tapestry of risks and opportunities for the S&P 500 as it tests key resistance.
Examining Key Price Levels and Trading Scenarios
The immediate focus for SP500 traders is the resistance zone around $6,577.27. A decisive break above this level, supported by strong volume and confirmation from other indicators like a falling RSI or a shift in the ADX, could signal a continuation of the bullish trend. If the SP500 can convincingly clear this hurdle, the next significant resistance levels to watch would be $6,589.83 and potentially higher targets around $6,605.07 on the daily chart. Such a move would likely require a significant catalyst, perhaps a dovish surprise from the Fed or a de-escalation of geopolitical tensions, leading to a renewed surge in risk appetite.
Conversely, failure to break through the $6,577.27 resistance could lead to a sharp pullback. The immediate support level to monitor on the 1-hour chart is $6,568.73. A break below this could signal the start of a corrective move, with traders looking towards the 4-hour support at $6,561.07 and then the more significant daily support at $6,547.63. If the selling pressure intensifies, we could see a test of the lower support levels identified on the daily chart, such as $6,526.53 or even $6,514.53. This scenario would be exacerbated by rising oil prices, a strengthening dollar, or negative economic data releases that heighten recession fears.
A neutral or consolidation scenario is also plausible. If the SP500 fails to break resistance but also holds above the immediate support levels, we could enter a period of range-bound trading. This would likely occur if conflicting economic data or geopolitical news keeps market participants on the sidelines, waiting for clearer direction. In such a scenario, traders might look for opportunities to trade within the established range, selling near resistance and buying near support, while keeping a close eye on the ADX readings, which currently show a mixed trend strength across timeframes. This consolidation could eventually lead to a larger breakout, but the direction would depend heavily on the catalysts that emerge.
Bearish Scenario: Resistance Holds, Pullback Ensues
65% ProbabilityNeutral Scenario: Consolidation Around Resistance
25% ProbabilityBullish Scenario: Breakout Above Resistance
10% ProbabilityEconomic Calendar and Market Impact
Looking at the economic calendar, the current week is critical for shaping market sentiment. The US economy is showing signs of deceleration, with Q4 GDP revised down and early 2026 data pointing towards continued weakness. This backdrop makes upcoming high-impact data releases particularly sensitive. For instance, the US Non-Farm Payrolls (NFP) data, expected to show a reading of 212k compared to the previous 207k, will be closely scrutinized. A figure significantly above forecast could reignite inflation fears and potentially strengthen the dollar, while a miss could signal economic distress and boost risk appetite, albeit with concerns about corporate earnings.
Similarly, upcoming inflation indicators, such as the Consumer Price Index (CPI) and Personal Consumption Expenditures (PCE) price index, will be pivotal. Forecasts for CPI and PCE remain elevated, with expected figures of 1.4% and 1.3% respectively, compared to previous readings of 0.6% and 0.5%. If these inflation prints come in higher than anticipated, it could pressure the Federal Reserve to maintain a hawkish stance or even consider further tightening, which would typically be bearish for equities like the SP500. Conversely, any sign of cooling inflation could provide a significant tailwind for the market, potentially leading to a rally as rate cut expectations resurface.
The interplay between these economic releases and the ongoing geopolitical tensions creates a volatile environment. While easing tensions might have initially supported risk assets, the resurgence of US-Iran friction and the impact of rising oil prices on inflation expectations mean that market participants must remain vigilant. The Federal Reserve's reaction function to both economic data and geopolitical shocks will be paramount. Traders will be dissecting every word from Fed officials and futures markets, like the CME FedWatch tool, for clues on future monetary policy. Any indication of a more hawkish outlook could put the SP500's current rally under pressure, especially as it stands at these resistance levels.
Conclusion: A Cautious Outlook Near Resistance
The SP500, currently trading at $6,572.87, finds itself at a critical resistance zone. While the overall trend on the 4-hour chart remains bullish, the 1-hour indicators, particularly the RSI at 70.95, are flashing warning signs of overbought conditions. The conflicting signals from different timeframes and the broader market context – rising oil prices, a mixed dollar, and geopolitical uncertainties – suggest that the path of least resistance might be downwards in the short term, or at best, a period of consolidation. The ADX readings further emphasize this ambiguity, showing strong trend signals on one hand and moderate or weak trends on the other.
For traders, this environment calls for discipline and patience. The high probability scenario points towards a potential pullback, with key support levels to watch at $6,568.73 and $6,561.07. A decisive break below these could open the door for further downside. However, a strong breakout above $6,577.27, though currently less probable, cannot be entirely discounted and would require significant catalysts. The upcoming economic data releases, especially inflation figures and employment numbers, will be crucial in determining whether the bulls can overcome the resistance or if the bears will seize control. Risk management remains paramount in navigating these choppy waters.
| Indicator | Value | Signal | Interpretation |
|---|---|---|---|
| RSI (14) | 67.36 | Neutral | Approaching overbought territory, potential for pullback |
| MACD Histogram | -15.20 | Bearish | Negative momentum suggests weakening bullish conviction |
| Stochastic | K=65.73, D=73.5 | Bearish | %K |
| ADX | 49.72 | Bullish | Very strong trend, but high reading may precede reversal |
| Bollinger | Middle Band | Watch | Price above middle band, but resistance test is crucial |
Frequently Asked Questions: SP500 Analysis
What happens if SP500 fails to break above $6,577.27 resistance?
If SP500 fails to break above $6,577.27 and closes below $6,568.73, a bearish scenario is likely, targeting $6,561.07 and potentially $6,547.63. This is invalidated if price closes above $6,589.83.
Should I buy SP500 at current levels of $6,572.87 given the RSI at 70.95?
Buying at current levels of $6,572.87 with an RSI at 70.95 carries significant risk due to overbought conditions near resistance. A more prudent approach would be to wait for a confirmed breakout above $6,577.27 or a pullback to support levels around $6,561.07.
Is the RSI at 70.95 a sell signal for SP500 right now?
An RSI of 70.95 on the 1-hour chart suggests overbought conditions and is often interpreted as a warning signal for potential selling pressure or a short-term reversal, especially when near resistance. However, it's not a definitive sell signal without further confirmation like a bearish MACD crossover or a break below key support.
How will rising oil prices affect SP500 this week?
With Brent crude at $95.93, rising oil prices could fuel inflation concerns, potentially leading the Fed to adopt a more hawkish stance. This could pressure the SP500, especially as it tests resistance at $6,577.27. However, higher oil prices also benefit energy stocks, creating sector-specific divergence within the index.
Track markets in real-time
AI-powered analysis, technical indicators and real-time price data.
Join Our Telegram Channel
Breaking market news, AI analysis and trading signals instantly.
Join Channel