

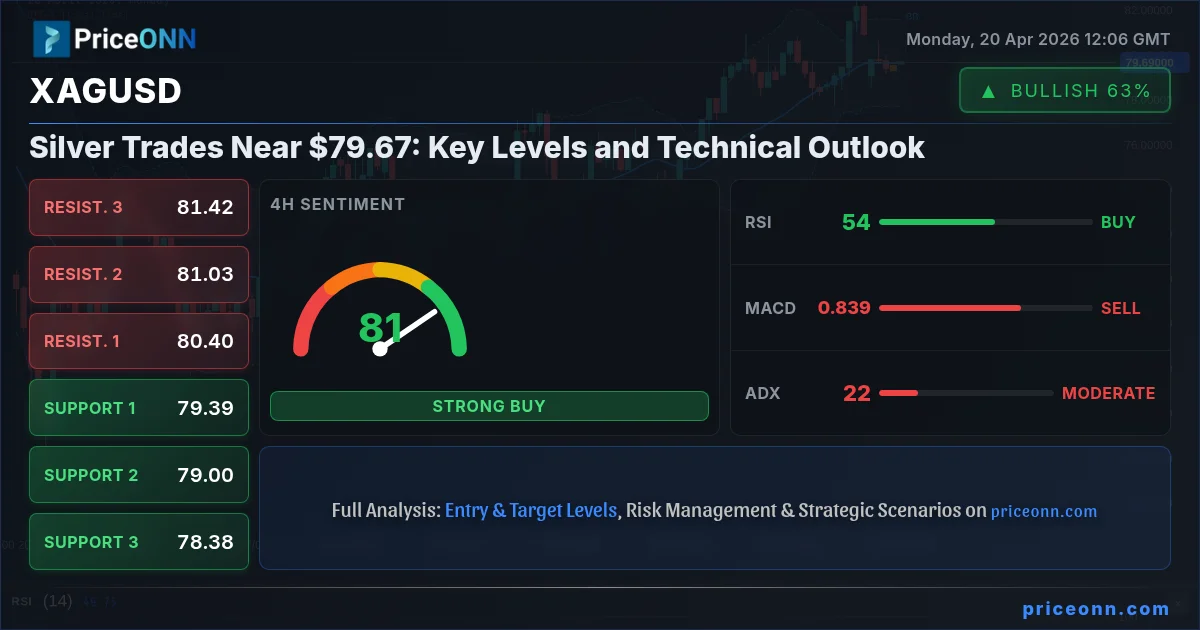
The silver market is currently a study in contrasts, with XAGUSD trading at $79.67, a level that encapsulates both cautious optimism and underlying pressure. For traders watching the precious metals closely, this price point isn't just a number; it's a critical juncture where conflicting technical signals and potential macro shifts are vying for dominance. Having tracked XAGUSD's movements, it's clear that the recent price action, while appearing somewhat subdued on the surface, is brimming with subtle cues about its next potential direction. This isn't a market for the faint of heart, but for those who understand the nuances of price action and indicator confluence, opportunities are certainly present.
- RSI at 47.77 on the 1H chart signals bearish pressure, while the 1D RSI at 55.57 indicates a neutral to slightly bullish lean.
- Critical support for XAGUSD is identified at $78.13, a level that has historically provided a floor during periods of uncertainty.
- Resistance looms at $83.39 on the daily chart, a significant hurdle that needs to be cleared for a sustained upward move.
- The ADX on the 1H chart is 20.7, suggesting a moderate downtrend, yet the 4H ADX at 21.72 points to a strengthening upward trend, creating a conflicting picture.
Navigating the Silver Landscape: A Technical Deep Dive
The 1-Hour Chart: A Battleground of Signals
Looking at the 1-hour timeframe for XAGUSD, the picture is decidedly mixed, reflecting the immediate tug-of-war between buyers and sellers. The current price of $79.67 is nestled within a neutral trend, with the ADX at 20.7 indicating a moderate downtrend in force, yet the overall signal leans towards a 'SELL' based on the aggregated indicator readings. The RSI(14) at 47.77 hovers below the 50 mark, suggesting some downward momentum, while the Stochastic oscillator (%K=21.1, %D=33.45) reinforces this bearish sentiment with a clear sell signal as %K dips below %D. This aligns with the Bollinger Bands, which are positioned below the middle band, indicating price contraction and a potential for further downside. However, the MACD is showing negative momentum, but it's crucial to note that it remains below its signal line, which can sometimes precede a reversal if the price action supports it. The aggregate signal of 'SELL' (2 Buy, 6 Sell, 0 Neutral) on this timeframe demands caution, suggesting that short-term traders might find more opportunity on the sell side, but the overall trend strength is not yet convincing.
The 4-Hour Chart: Shifting Towards Bullish Momentum
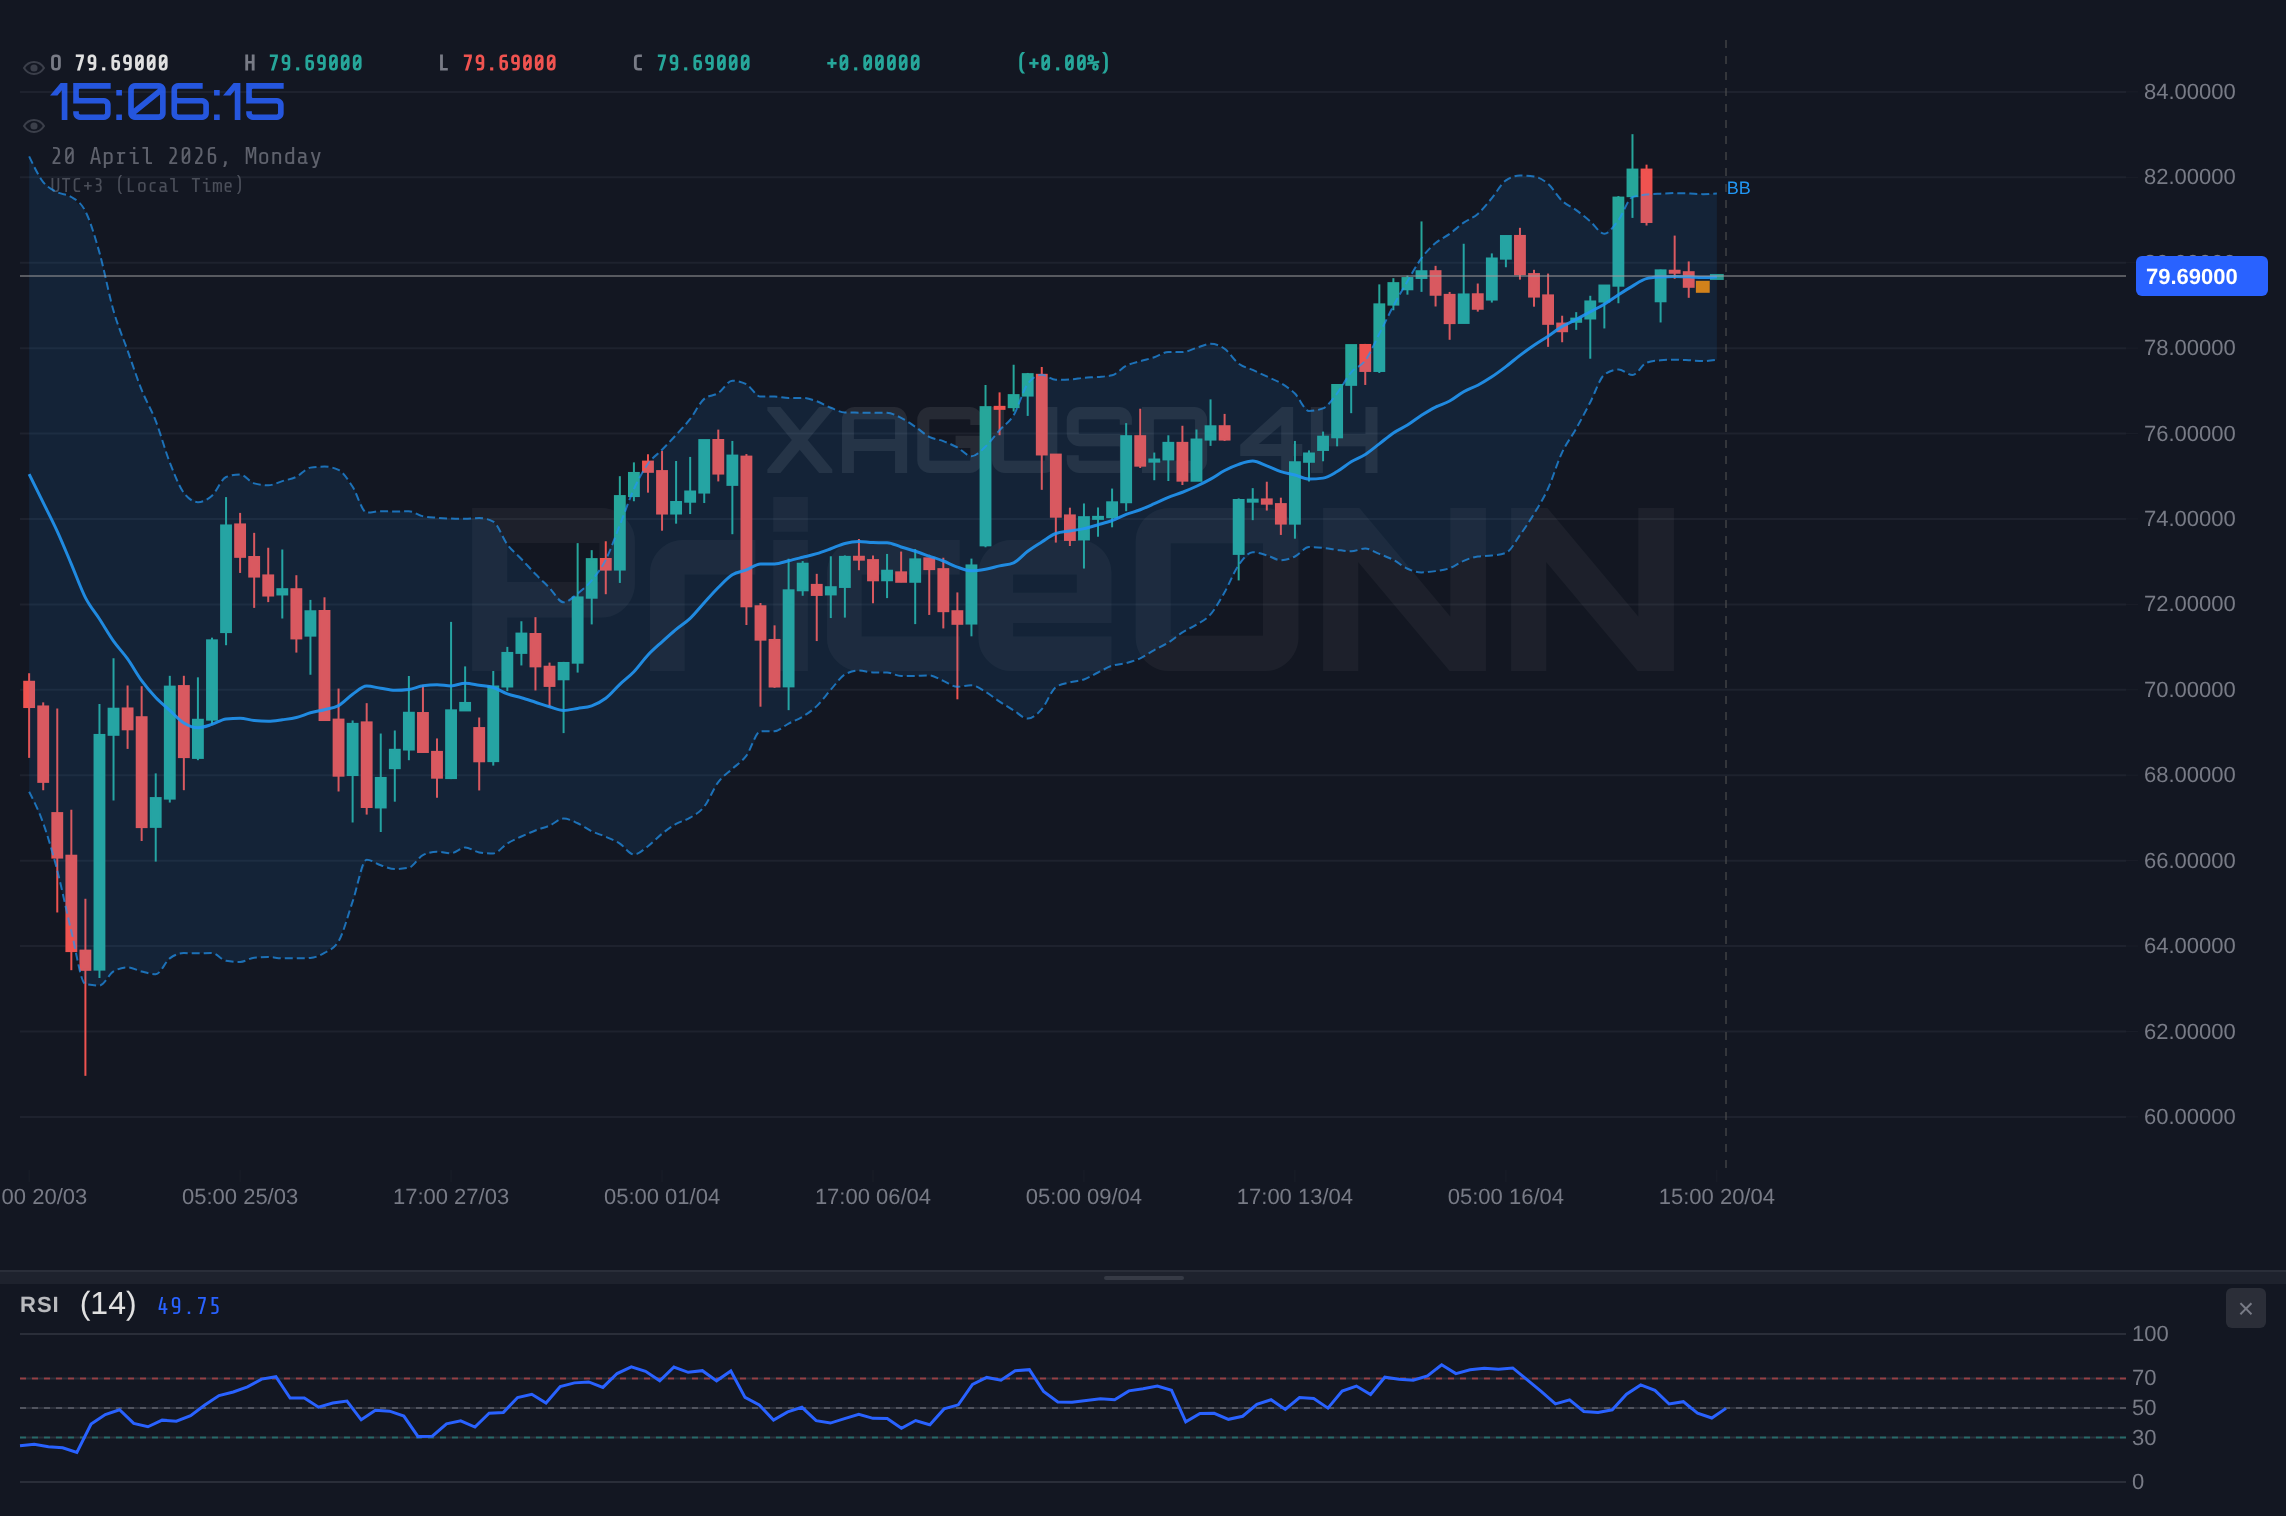
As we expand our view to the 4-hour chart, the narrative begins to shift. The trend is now categorized as 'Uplifting' with a strong conviction of 91%, and the ADX at 17.72 suggests a weaker trend, but importantly, the overall signal flips to 'SELL' (3 Buy, 5 Sell, 0 Neutral). This timeframe presents a more complex picture. While the trend strength is high, the ADX value indicates a lack of strong directional commitment, implying that the current upward move might be susceptible to pullbacks or consolidation. The RSI(14) is at 53.96, just above the neutral 50 level, hinting at a slight bullish bias, but this is tempered by the Stochastic oscillator, which presents a clear 'SELL' signal (%K=38.16, %D=62.22). The MACD also shows negative momentum, remaining below its signal line. Despite these bearish indicators on the shorter timeframes, the overall trend classification and the aggregate signal of 'SELL' on this chart suggest that while immediate upside might be capped, the longer-term direction might still favor sellers if key resistance levels hold. The support levels at $79.39, $79.00, and $78.38 become crucial watch points.
The Daily Chart: A Foundation for Potential Upside
Transitioning to the daily chart, the sentiment for XAGUSD becomes more nuanced, revealing a neutral trend with 50% conviction, but with a surprising 'BUY' aggregate signal (7 Buy, 1 Sell, 0 Neutral). This divergence between the shorter-term bearish signals and the daily chart's overall positive leaning is where the real trading opportunity lies. The RSI(14) at 55.57 sits comfortably in the neutral zone, showing a slight upward inclination, which is often a precursor to a more significant move. The MACD is firmly in positive momentum, trading above its signal line, a classic bullish indicator. Similarly, the Bollinger Bands are above the middle band, suggesting an upward bias. However, the Stochastic oscillator provides a conflicting 'SELL' signal (%K=76.51, %D=82.25), indicating that while the trend might be upwards, the immediate conditions are leaning towards overbought territory on this timeframe, potentially signaling a pause or minor pullback before further gains. The ADX at 21.21 confirms a moderate downtrend strength, which seems counterintuitive to the overall 'BUY' signal, highlighting the complex interplay of indicators. The key resistance levels to watch on this daily chart are $83.39, $85.83, and $88.65.
Correlation Analysis: The Dollar's Shadow and Equities' Mood
Understanding XAGUSD's price action in isolation is only half the battle; its correlation with broader market forces is paramount. The Dollar Index (DXY), currently at 97.95, is a significant factor. A rising DXY typically exerts downward pressure on gold and silver, as they are often priced in dollars, making them more expensive for holders of other currencies. Currently, the DXY is showing a mixed picture across timeframes: a potential bearish trend on the 1H (ADX 17.58), neutral on the 4H (ADX 31.81), and a bearish trend on the daily (ADX 26.24). This complexity means the dollar's influence on silver is not straightforward today. If the dollar were to strengthen significantly, it would likely add headwinds to XAGUSD. Conversely, any dollar weakness could provide a tailwind. We also need to consider the mood of the equity markets, represented by the SP500 and Nasdaq100. The SP500 is showing a strong bullish trend on the 1H (ADX 49.72) and 4H (ADX 24.23) but a strong bearish trend on the daily (ADX 47.51). The Nasdaq100 exhibits a very strong bullish trend on the 4H (ADX 53.82) and a strong bullish trend on the daily (ADX 29.83), but a moderate downtrend on the 1H (ADX 20.81). This mixed equity signal suggests that risk appetite is not uniformly strong across all timeframes. If risk-off sentiment were to dominate, we might see a flight to perceived safe-haven assets like silver, even if the dollar is also firming up.
Geopolitical Undercurrents and Their Impact on Silver
Recent news highlights a complex geopolitical landscape that significantly influences precious metals. Reports indicate that crude oil prices, both Brent and WTI, have surged, with Brent nearing $100 and WTI around $90.15. This surge is attributed to fears of supply disruptions, particularly with the Strait of Hormuz reportedly closed and escalating tensions between the US and Iran. Such geopolitical flare-ups typically increase demand for safe-haven assets like gold and, by extension, silver. While gold experienced a downward gap on Friday due to fading ceasefire hopes, the broader escalating tensions could still provide underlying support for silver if they intensify. The news that US forces intercepted an Iranian cargo ship adds a layer of immediate risk. Furthermore, the US dollar's recent weakening, linked to easing Middle East tensions and economic headwinds, could also provide a boost to silver. The interplay between rising oil prices (inflationary pressure) and potential dollar weakness creates a supportive environment for commodities, and silver often benefits from both factors, provided broader market sentiment doesn't turn decisively risk-averse.
The Critical Juncture at $78.13: Support and Resistance Dynamics
The interplay of support and resistance levels is crucial for understanding XAGUSD's immediate path. On the 1-hour chart, immediate support is found at $79.07, followed by $78.90 and $78.61. Resistance is noted at $79.52, $79.81, and $79.98. These levels suggest a tight range for short-term trading. However, the daily chart paints a broader picture, with key support identified at $78.13. This is a significant level; a decisive break below it could signal a deeper correction. Conversely, on the upside, the daily resistance stands at $83.39. This level represents a substantial barrier, and a sustained move above it would likely confirm a broader bullish trend. The 4-hour chart aligns with this, showing resistance at $80.40, $81.03, and $81.42. The current price of $79.67 is hovering just below the 1-hour resistance, indicating that sellers are currently defending this immediate zone. For silver to regain bullish momentum, breaking through these near-term resistance points and ultimately challenging the $83.39 daily resistance will be key. Failure to hold the $78.13 support level, however, would open the door for a move towards the next daily support at $75.31.
Scenario 1: The Bearish Breakout
The current technical indicators, particularly on the shorter timeframes, suggest a plausible path towards the downside. If XAGUSD fails to hold the immediate support levels and breaks decisively below the crucial $78.13 mark on the daily chart, a more significant sell-off could ensue. This scenario is supported by the bearish signals from the 1-hour RSI and Stochastic, and the overall 'SELL' aggregate signal on the 1H timeframe. The geopolitical tensions, while potentially supportive of safe havens, could also lead to broader market instability if they escalate further, prompting a flight from riskier assets. A break below $78.13 could trigger stop-loss orders, accelerating the decline. The invalidation of this scenario would occur if price decisively closes back above $79.81, negating the bearish breakdown.
Scenario 2: The Bullish Consolidation and Rise
Conversely, the daily chart's underlying strength and the positive MACD momentum hint at a potential for recovery. If XAGUSD manages to consolidate around the current levels, perhaps finding support near $79.07 or even holding the critical $78.13 level, it could set the stage for a move higher. The bullish signals from the 1-day RSI and MACD, coupled with the overall 'BUY' aggregate signal on the daily chart, provide a foundation for this optimism. A catalyst, such as further dollar weakness or a significant escalation in oil prices that fuels inflation fears, could drive silver prices upwards. The key trigger for this scenario would be a sustained hold above $79.81, followed by a decisive break above the daily resistance at $83.39. The invalidation would be a close below $78.13.
Scenario 3: The Neutral Sideways Grind
Given the conflicting signals across different timeframes and the mixed macroeconomic backdrop, a period of consolidation is also a strong possibility. XAGUSD could remain range-bound between the immediate resistance around $79.81 and the support at $79.07, or even within the broader daily range defined by $78.13 and $83.39. This neutral scenario is often characterized by lower volatility and indecisive price action, where indicators might fluctuate without providing clear directional conviction. The ADX values across different timeframes, ranging from 17.72 to 21.72, support the idea of a lack of strong trend. This sideways movement could persist until a clearer catalyst emerges, either from a major economic data release or a significant geopolitical development. The trigger for this scenario would be the failure of price to break decisively above $79.81 or below $79.07 in the short term.
The Trader's Perspective: What to Watch Now
For active traders, the current environment demands a tactical approach. The immediate focus should be on the $79.81 resistance and the $79.07 support on the 1-hour chart. A break above $79.81 could signal a short-term move towards $80.40, a key resistance on the 4-hour chart. Conversely, a break below $79.07 might lead to a test of the $78.13 daily support. The divergence between the 1-hour and daily RSI readings is particularly noteworthy. While the 1-hour RSI at 47.77 suggests weakness, the 1-hour Stochastic's position at 21.1 indicates oversold conditions, which could precede a bounce. The daily RSI at 55.57, however, offers a more stable, neutral-to-bullish outlook. Traders should be looking for confirmation: a clear break of these immediate levels, coupled with broader market trends (like DXY movement or equity market direction), will be essential for making informed decisions. Patience is key here; waiting for a decisive signal rather than anticipating a move can prevent costly errors.
The Path Forward: Navigating Uncertainty with Discipline
Silver's current position at $79.67 presents a complex trading puzzle. The mixed signals across timeframes, the conflicting indicator readings, and the volatile geopolitical backdrop mean that predicting a definitive short-term direction is challenging. However, the underlying support at $78.13 on the daily chart and the potential for upside if key resistances are breached offer a degree of optimism for longer-term positions. The key takeaway for any trader is the necessity of risk management. Setting appropriate stop-losses, understanding the invalidation points for each scenario, and managing position size according to volatility are non-negotiable. The market is constantly evolving, and while current data points to a degree of uncertainty, disciplined trading strategies can turn these challenging conditions into opportunities. The next few days will be critical in determining whether silver breaks out of its current range or continues its sideways consolidation.
Bearish Scenario: Downside Pressure Mounts
45% ProbabilityBullish Scenario: Reclaiming Higher Ground
40% ProbabilityNeutral Scenario: Range-Bound Consolidation
15% ProbabilityIn volatile markets, clarity comes not from predicting the future, but from respecting the levels and managing risk with unwavering discipline.
Frequently Asked Questions: XAGUSD Analysis
What happens if XAGUSD breaks below the critical $78.13 daily support level?
A decisive break below $78.13 could trigger a sell-off towards the next major daily support at $75.31, potentially invalidating any bullish outlook.
Should I buy XAGUSD at current levels near $79.67 given the mixed RSI signals?
Caution is advised. While the 1D RSI is neutral-to-bullish, the 1H RSI at 47.77 suggests weakness. Look for confirmation, like a hold above $79.81, before entering long positions.
Is the Stochastic sell signal at 76.51/82.25 on the daily chart a strong indicator for XAGUSD?
This signal suggests overbought conditions on the daily chart, potentially indicating a short-term pullback or consolidation is due, despite the overall bullish trend.
How will the rising oil prices and DXY movements affect XAGUSD this week?
Rising oil prices could fuel inflation fears, supporting silver, while a strengthening DXY (currently mixed) could pressure it. Traders should monitor both as key macro drivers impacting XAGUSD.
Track markets in real-time
AI-powered analysis, technical indicators and real-time price data.
Join Our Telegram Channel
Breaking market news, AI analysis and trading signals instantly.
Join Channel