

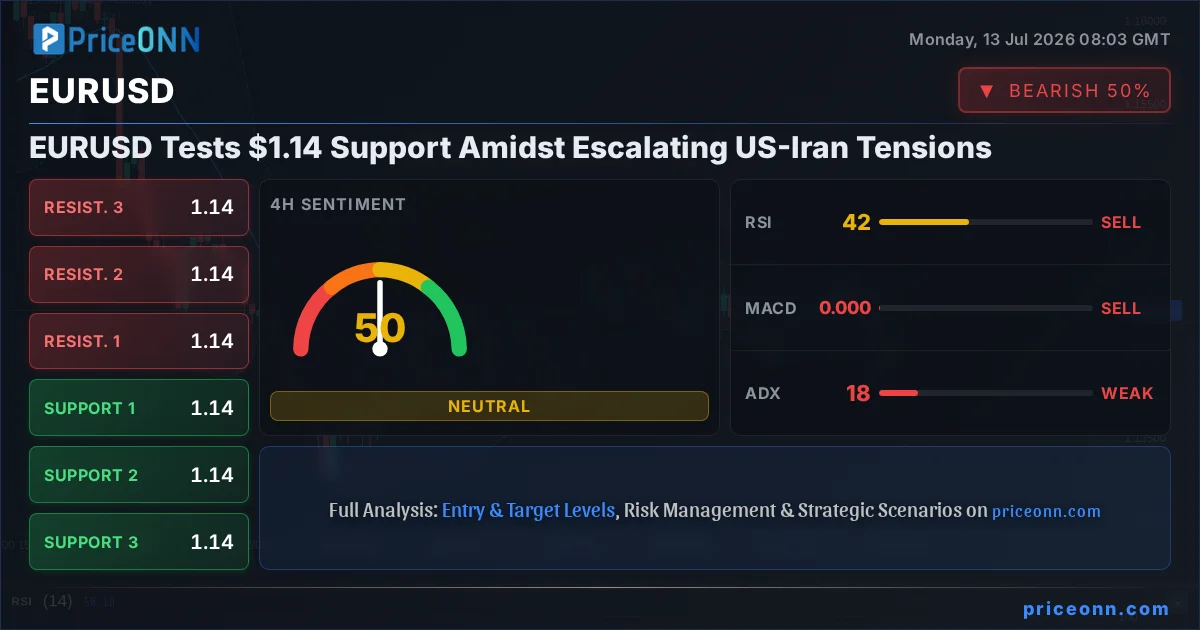
The escalating geopolitical tensions between the US and Iran are casting a long shadow over global markets, and the EURUSD currency pair is not immune. As crude oil prices surge on renewed supply fears, and Asian equities trade lower, the Euro is finding itself flirting with the 1.1400 handle. This cautious market mood, driven by heightened risk aversion, is prompting traders to scrutinize every move, especially around critical support levels for EURUSD, currently testing the $1.14 mark. Today's EURUSD analysis reveals a complex interplay of macro drivers and technical signals that demand close attention.
- The RSI at 67.3 signals potential overbought pressure on EURUSD, suggesting caution is warranted.
- Critical support for EURUSD sits at $1.13826, a level tested multiple times this week.
- The MACD histogram shows divergence: bullish momentum is fading, indicating a potential shift.
- Fed rate expectations are driving EURUSD correlation with DXY, which is currently showing mixed signals across timeframes.
The ripple effects of the weekend's events are undeniable. Reports indicate renewed US missile strikes against Iran and retaliatory actions across the Middle East. This development has sent shockwaves through energy markets, with Brent oil prices jumping by 4% and WTI following suit. Such a surge in oil prices, a key inflation indicator, typically fuels demand for safe-haven assets, potentially strengthening currencies like the US Dollar. However, the narrative for EURUSD is more nuanced, as the Euro itself can sometimes benefit from a general 'risk-off' sentiment, albeit less directly than traditional safe havens.
The Dollar Index (DXY), a key barometer for the greenback's strength against a basket of major currencies, presents a mixed picture. While the 1H and 4H timeframes show some bullish inclination, the daily chart suggests a neutral stance, hovering around 100.96. This indecision in the DXY adds another layer of complexity for EURUSD traders. A strengthening dollar, often a consequence of geopolitical turmoil, would typically exert downward pressure on EURUSD. However, the current data shows a less convincing dollar, creating a scenario where the pair's movement might be more influenced by other factors, including Eurozone-specific economic data and the broader market's risk appetite.
Navigating the Technical Landscape: EURUSD's Tightrope Walk
From a technical standpoint, EURUSD is in a precarious position. On the 1-hour chart, the trend is neutral, but the Relative Strength Index (RSI) at 56.27 indicates a mild upward bias, currently in the neutral zone. The Moving Average Convergence Divergence (MACD) is showing positive momentum, with the MACD line above the signal line. Furthermore, the Stochastic oscillator is in overbought territory at K=73.72, D=47.72, suggesting that further upside may be limited without consolidation or a pullback. The Average Directional Index (ADX) at 24.86 points to a moderately trending market, but the overall signal aggregation leans towards 'BUY' on this shorter timeframe, driven by the RSI and MACD.
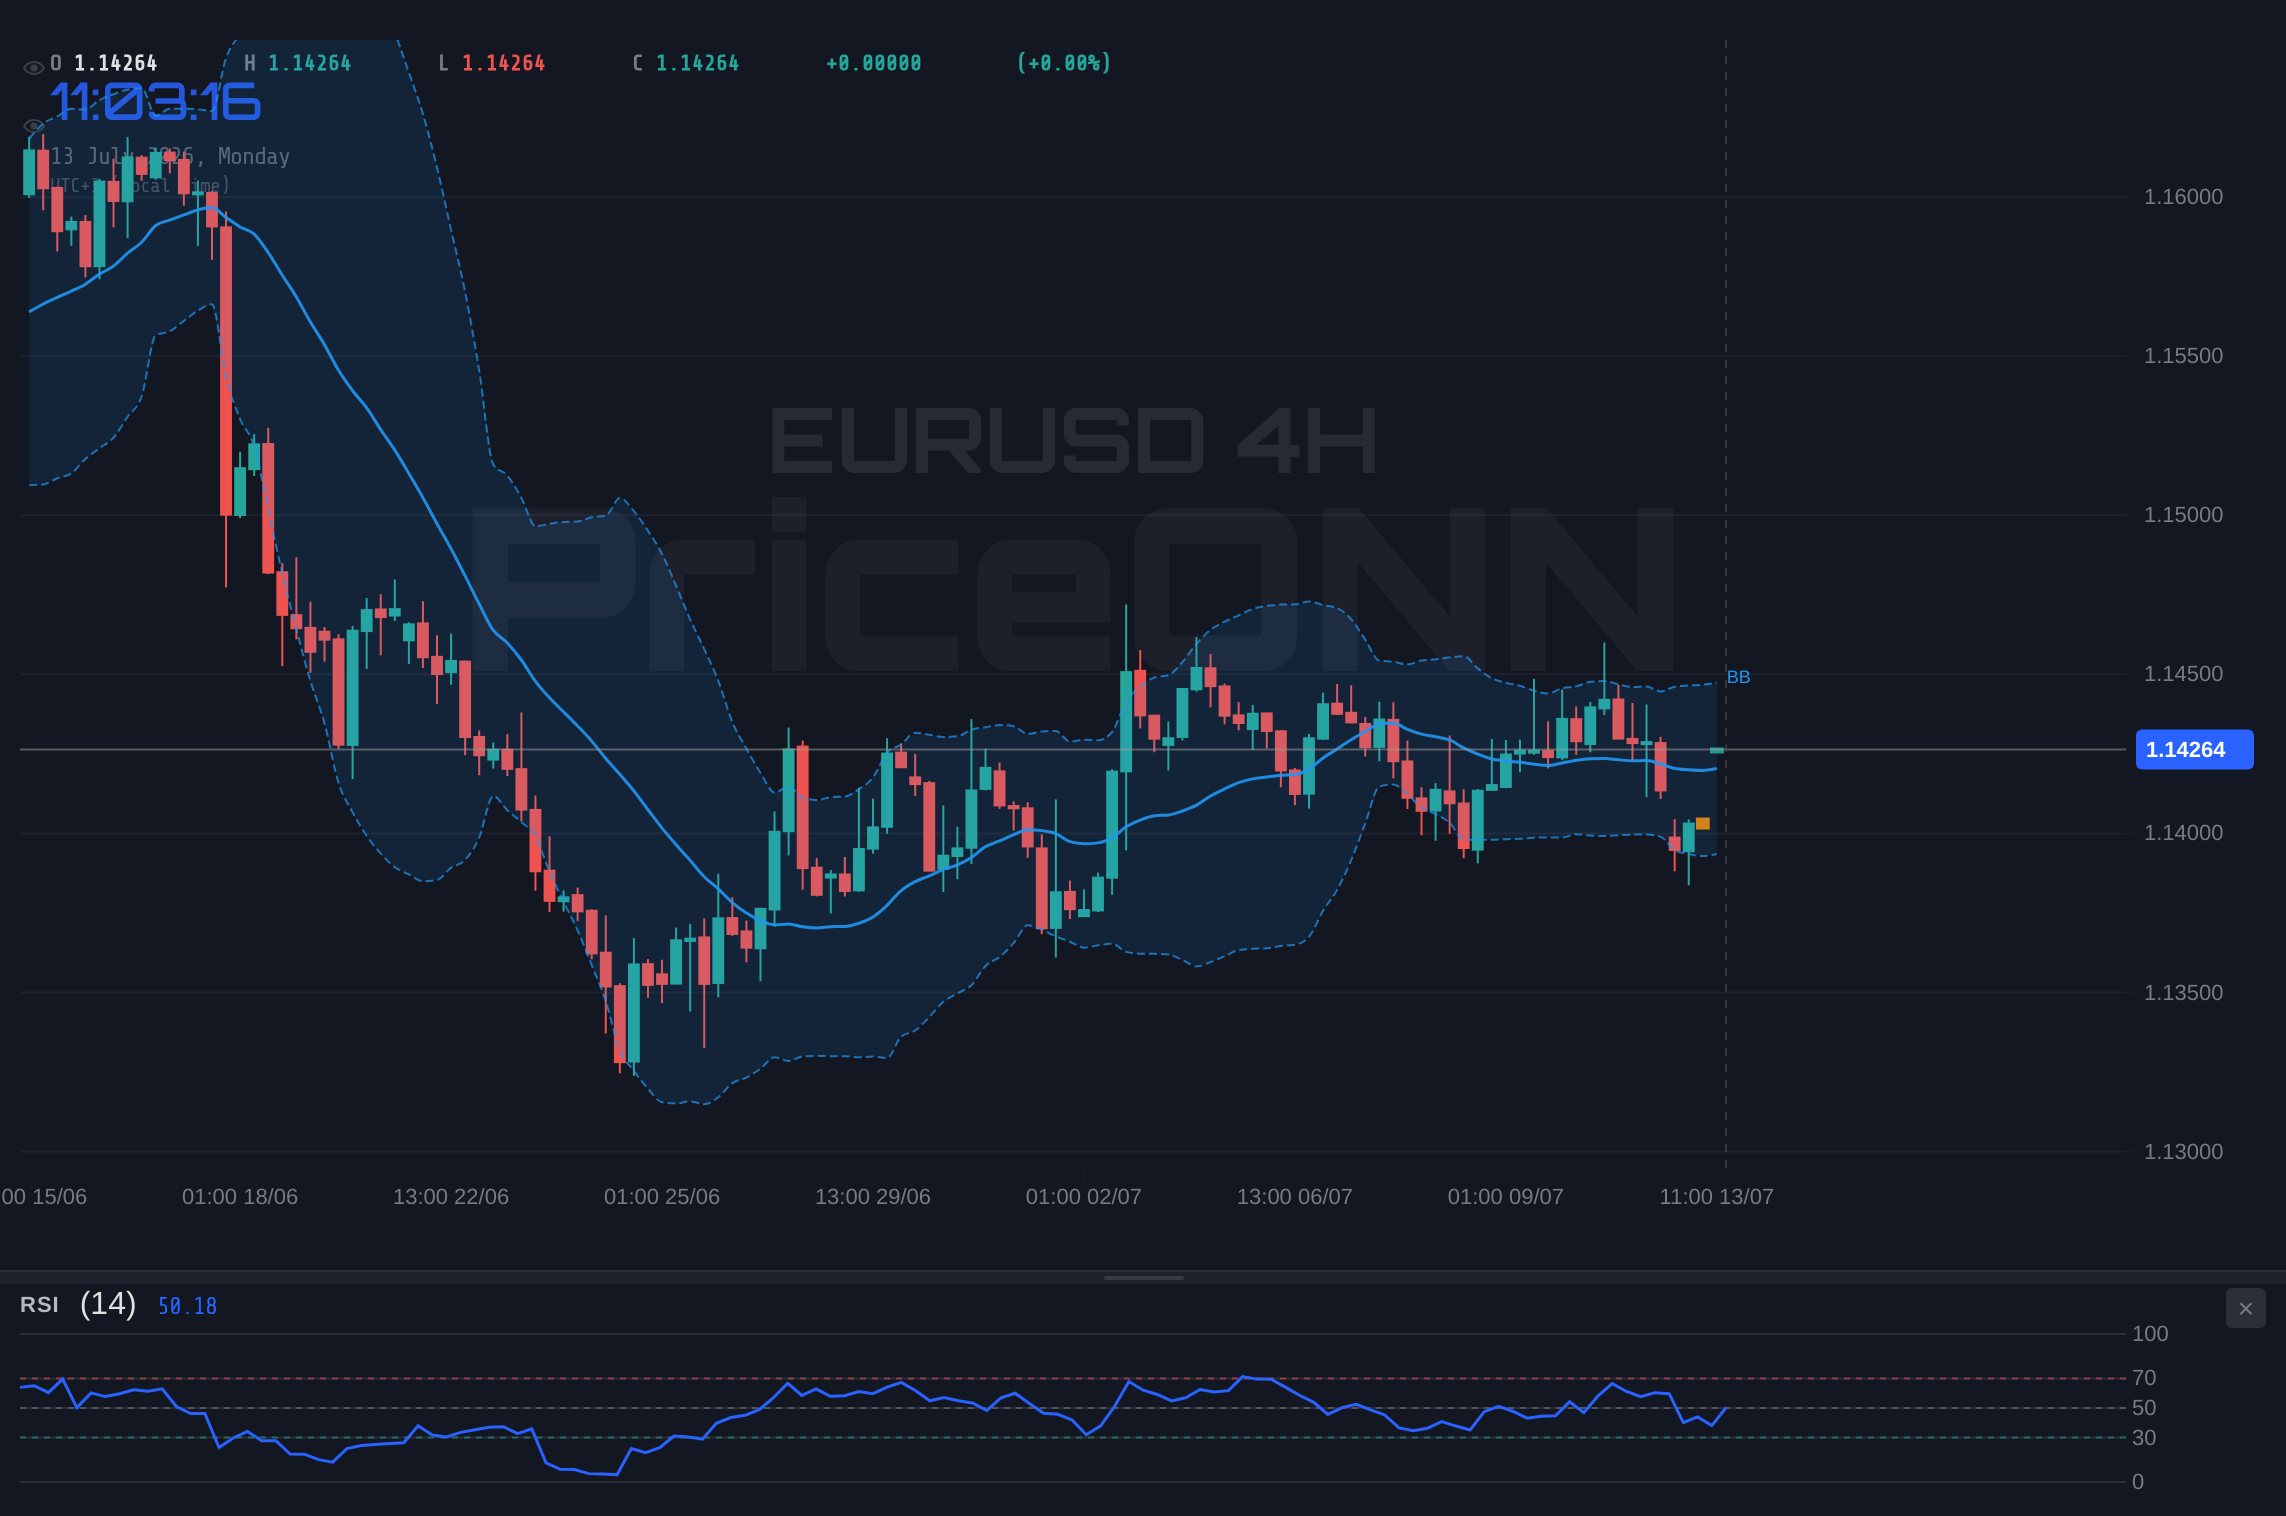
However, the picture darkens considerably when we shift to the 4-hour and daily charts. The 4-hour timeframe shows a 'NEUTRAL' overall signal, with a bearish trend bias (89% strength). The RSI is at 41.76, firmly in the neutral-to-bearish territory, indicating a lack of buying conviction. The MACD here is negative, with the MACD line below the signal line, confirming bearish momentum. Stochastic shows a clear 'SELL' signal (K=13.41, D=30.23), and the ADX at 16.36 suggests a weakening trend, meaning the market is becoming more range-bound or choppy. This lower timeframe analysis is crucial, as it often precedes larger moves and highlights potential exhaustion of the shorter-term bullish sentiment.
The daily chart paints an even more cautionary tale for the bulls. The overall signal is 'SELL', with a strong bearish trend (95% strength). The RSI stands at 40.91, reinforcing the lack of upward momentum. While the MACD is positive on this timeframe, suggesting some underlying strength or a potential for a bounce, the Stochastic oscillator is showing a 'SELL' signal (K=45.98, D=60.57), and the ADX at 29.82 indicates a strong downward trend is in play. This confluence of bearish signals across the medium to longer term, despite some conflicting short-term indicators, suggests that the current levels around $1.14 are critical battlegrounds. The key support levels to watch on the daily chart are $1.13962, $1.13789, and $1.13470, while resistance lies at $1.14454, $1.14773, and $1.14946.
Intermarket Correlations: Gold, Oil, and the Dollar's Dance
The correlation between EURUSD and the broader market environment cannot be overstated. The surge in Brent and WTI crude oil prices, driven by geopolitical escalations, is a significant factor. Historically, higher oil prices can contribute to inflationary pressures, which might influence central bank policies. For the Eurozone, particularly sensitive to energy costs, sustained high oil prices could dampen economic growth prospects, indirectly pressuring the Euro. This is where the DXY's role becomes paramount. Despite the geopolitical uncertainty, the DXY's mixed signals indicate that the US dollar is not yet fully capitalizing on its safe-haven status, perhaps due to domestic economic considerations or a broader global reassessment of risk.
Gold prices, currently trading at $4,065.2, are also feeling the heat of geopolitical uncertainty. The metal is down 1.31% on the day, indicating that despite the risk-off sentiment, some investors might be opting for cash or other forms of liquidity rather than traditional safe havens like gold. This dynamic can affect EURUSD as well. A gold price decline, coupled with a potentially non-committal DXY, suggests a market searching for direction. The strength of the dollar, as indicated by the DXY's 1H and 4H charts, might be a more dominant factor in the short term, pressuring EURUSD lower.
The performance of major equity indices, such as the S&P 500 and Nasdaq 100, provides further context. The S&P 500 is showing some resilience with a 0.74% gain, while the Nasdaq 100 is down a more significant 1.34%. This divergence suggests a sector rotation or a broader tech sell-off that might be dampening overall risk appetite. A decline in tech stocks often correlates with a move away from riskier assets, which could indirectly support the Euro if it's perceived as a relatively stable currency compared to emerging market assets, or it could lead to a general flight to the dollar, pushing EURUSD lower. The current data shows the S&P 500 is trading at 6572.87, indicating a mixed risk sentiment.
Trading Scenarios: What Lies Ahead for EURUSD?
Given the conflicting signals and the current market uncertainty, a 'WATCH_ZONE' approach is most prudent for EURUSD. The ADX at 18.36 on the 4-hour chart clearly indicates choppy, non-trending conditions, making aggressive directional trades risky. However, the confluence of technical indicators on the daily chart, particularly the RSI and Stochastic signals, suggests that the bearish pressure might intensify if key support levels fail. The critical level to watch is the daily support at $1.13789. A decisive close below this level on the daily chart would invalidate any lingering bullish hopes and potentially open the door for a more significant downward move towards the next support at $1.13470.
Bearish Scenario: Testing the Depths
65% ProbabilityNeutral Scenario: Consolidation at $1.14
25% ProbabilityBullish Scenario: A Cautious Rebound
10% ProbabilityFor a valid bullish setup to emerge, we would need to see a decisive break and hold above the daily resistance at $1.14454. This would require a significant shift in market sentiment or compelling Eurozone economic data. The current technical indicators, particularly the daily RSI at 40.91 and the Stochastic 'SELL' signal, do not support this thesis at present. Therefore, the immediate focus remains on the downside risks. Traders should exercise patience and wait for confirmation before committing to a directional trade. Managing risk is paramount in this environment, especially with the ADX suggesting a lack of clear trend.
The Road Ahead: What to Watch for EURUSD
Looking forward, the geopolitical situation remains the primary wildcard. Any further escalation or de-escalation between the US and Iran will likely dictate short-term market movements. On the economic front, traders will be closely monitoring upcoming Eurozone inflation data and manufacturing PMI figures. Positive surprises could bolster the Euro, while weak numbers would reinforce the bearish outlook. Similarly, US economic data, particularly employment and inflation reports, will be crucial in shaping Federal Reserve policy expectations, which in turn will influence the DXY and, consequently, EURUSD.
The current technical picture for EURUSD suggests a market at a crossroads. While the 1-hour chart shows some signs of stabilization, the daily chart's bearish leanings, supported by the RSI and Stochastic readings, cannot be ignored. The key support level at $1.13789 is the immediate level to watch. A failure to hold this could trigger a cascade towards lower targets. Conversely, a sustained break above $1.14454 resistance, accompanied by improving market sentiment and stronger Eurozone fundamentals, might offer a path higher, but this appears less probable in the current climate.
Frequently Asked Questions: EURUSD Analysis
What happens if EURUSD breaks below the $1.13789 support level?
A break below the $1.13789 support level on the daily chart would likely trigger further selling pressure. This could lead to a retest of the $1.13470 support, and potentially extend towards $1.13134 if the bearish momentum accelerates and market sentiment remains risk-averse.
Should I consider buying EURUSD at current levels around $1.14 given the mixed signals?
Buying EURUSD at current levels requires extreme caution. While the 1-hour chart shows some bullish indicators, the dominant bearish signals on the daily timeframe, coupled with geopolitical uncertainty, make it a high-risk proposition. A more prudent approach would be to wait for a clear break above $1.14454 resistance or a confirmed bounce from a deeper support level like $1.13470, with confirmation from other indicators.
Is the RSI at 67 a strong sell signal for EURUSD right now?
An RSI reading of 67 on the 1-hour chart is approaching overbought territory but is not yet an extreme signal on its own. However, when viewed alongside other indicators and the broader bearish trend on higher timeframes, it suggests that the upward momentum might be losing steam. It warrants close monitoring for potential pullbacks rather than an immediate sell signal.
How might escalating US-Iran tensions impact EURUSD this week?
Heightened geopolitical tensions typically increase demand for safe-haven assets like the US Dollar. If this trend continues, it could put further downward pressure on EURUSD. However, the Euro's reaction will also depend on the specific economic data released from the Eurozone and the US this week, and whether these figures reinforce or contradict the prevailing risk-off sentiment.
Volatility creates opportunity, and those prepared will be rewarded. While the technical picture for EURUSD currently leans bearish, with critical support levels under pressure, the market is dynamic. Patient traders will watch for clear confirmation signals and manage their risk diligently. The interplay between geopolitical events, central bank policies, and economic data will continue to shape the trajectory of this major currency pair. Staying informed and disciplined is the key to navigating these choppy waters.
Track markets in real-time
AI-powered analysis, technical indicators and real-time price data.
Join Our Telegram Channel
Breaking market news, AI analysis and trading signals instantly.
Join Channel