

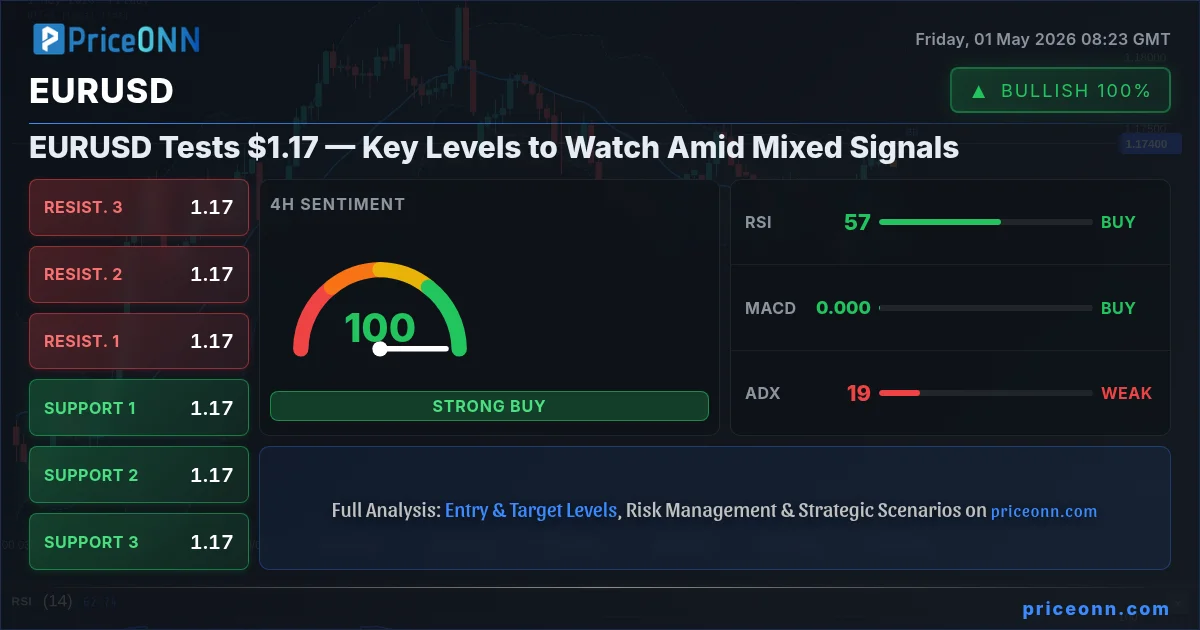
The EURUSD pair is currently navigating a critical juncture, trading around the $1.1736 mark. This pivotal level comes as the US Dollar Index (DXY) shows signs of weakness, retreating towards the 98.00 handle. While this might seem like a straightforward opportunity for the Euro to gain further ground, the technical indicators are painting a more nuanced picture. The confluence of conflicting signals across various timeframes necessitates a deep dive into the market dynamics to understand the true potential direction of this major currency pair. This analysis will dissect the intricate interplay of technical indicators, macroeconomic drivers, and intermarket correlations to provide a comprehensive outlook for EURUSD.
- EURUSD is consolidating gains near $1.1736 as the DXY retreats towards 98.00 following mixed US data.
- On the 4-hour chart, ADX at 18.64 indicates a choppy, ranging market, making directional trades risky without further confirmation.
- A decisive daily close above the $1.1762 resistance level is needed to confirm a bullish continuation, targeting $1.1848.
- Conversely, a break below the $1.1675 support could signal a deeper correction, opening the door for a move towards $1.1588.
- The current technical setup warrants a 'WATCH_ZONE' approach, emphasizing patience and risk management until clearer signals emerge.
Navigating the Choppy Waters: EURUSD's Current Stance
The EURUSD pair's current position around $1.1736 reflects a complex market environment where short-term fluctuations are creating a degree of uncertainty. The recent dip in the US Dollar Index (DXY) to approximately 98.10, influenced by softer-than-expected Q1 US economic growth figures and renewed concerns about Japanese currency intervention, has provided some relief to the Euro. However, this relief appears to be tempered by a lack of strong conviction from market participants. The 1-hour chart for EURUSD shows RSI at 61.08, indicating a moderately bullish sentiment, yet the MACD is lurking below its signal line, suggesting that the upward momentum might be waning. Furthermore, the Stochastic Oscillator, with %K at 42.24 and %D at 36.8, is trending upwards, but not yet in overbought territory, adding another layer to the mixed technical picture. This delicate balance suggests that while the Euro has found some breathing room, breaking decisively higher will require more than just a weaker dollar.
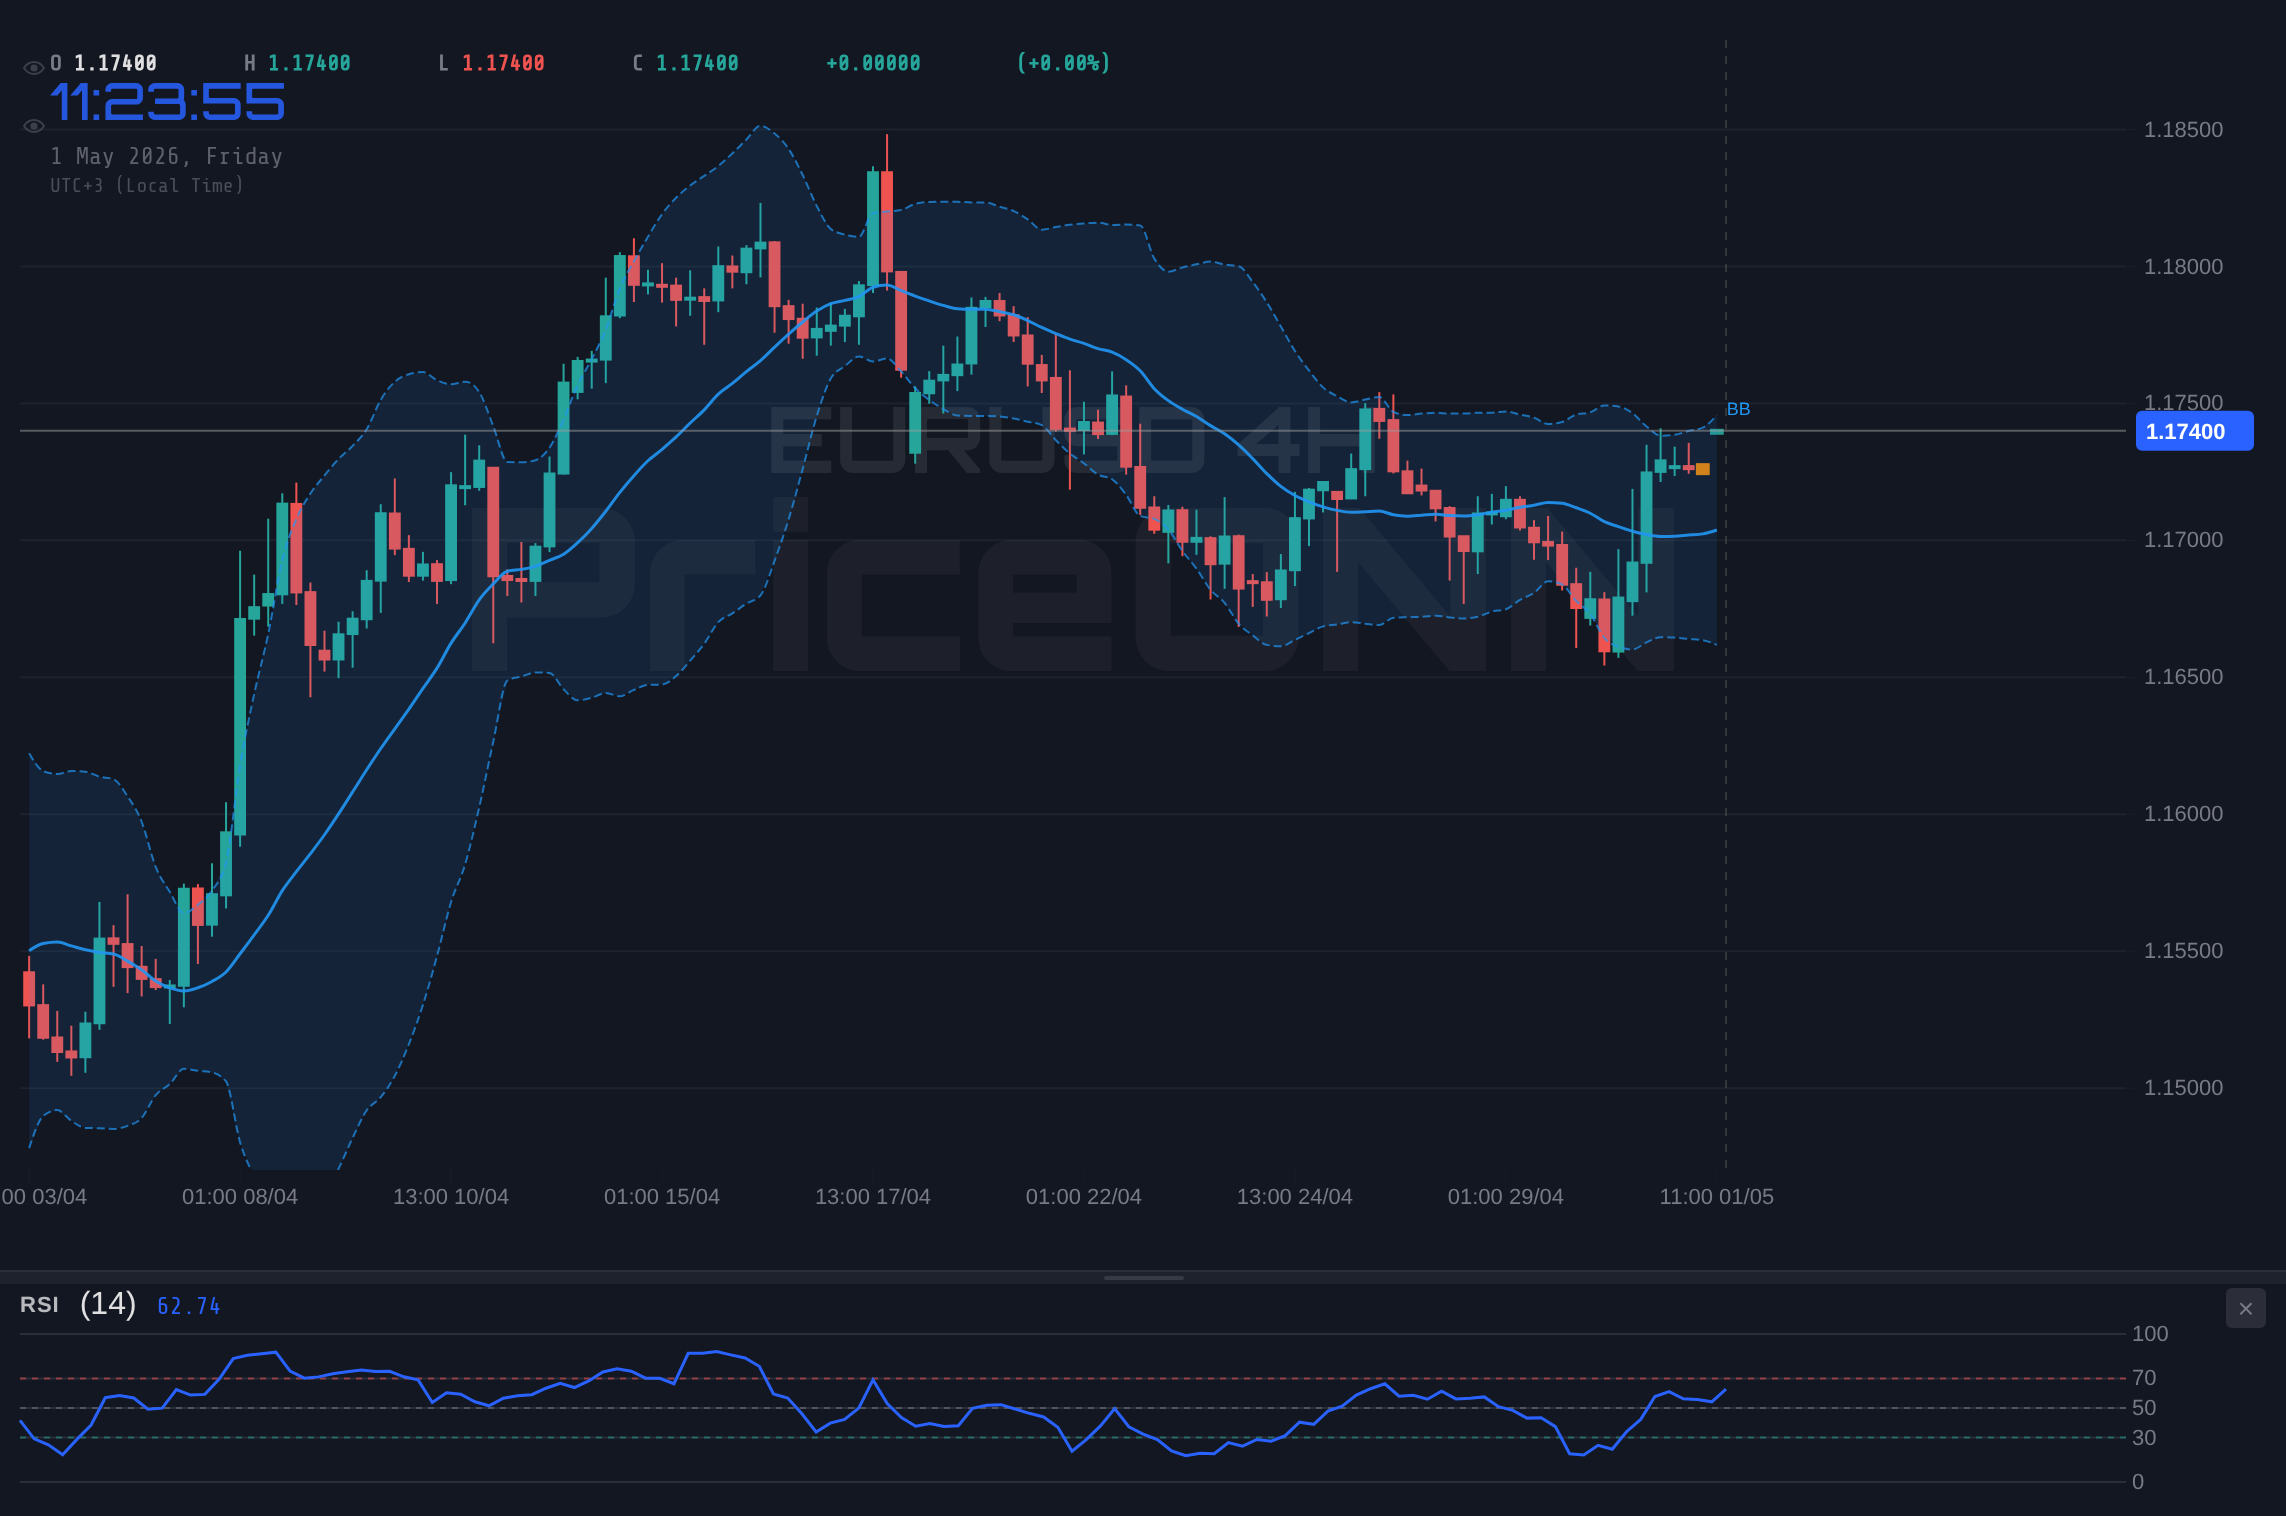
The 4-hour timeframe offers a slightly more bullish lean, with RSI at 57.13 and MACD positive, trading above its signal line. The Stochastic is notably in overbought territory (%K at 84.45, %D at 64.54), which often signals caution for further immediate upside. Bollinger Bands on this timeframe are also hugging the upper band, indicating potential for a short-term pullback or consolidation. The ADX on the 4-hour chart stands at 18.64, a reading that signals a weak or non-trending market. This is crucial information; it implies that the current price action might be more range-bound than indicative of a sustained trend. For traders, this translates to a need for heightened risk management, as breakouts from such ranges can be volatile and prone to false signals. The prevailing sentiment from this timeframe leans towards a 'BUY' signal (8 out of 10), but the low ADX value tempers the enthusiasm for aggressive long positions.
The Daily Chart Perspective: Is the Trend Shifting?
Shifting our focus to the daily chart, the EURUSD pair is exhibiting a neutral trend with a power score of 50%. The RSI(14) is hovering at 55.44, firmly in the neutral zone, neither indicating overbought nor oversold conditions, but leaning slightly towards bullish momentum. The MACD, however, presents a bearish signal, with its histogram below the signal line, suggesting that recent upward price action might be losing steam. Bollinger Bands are trading above the middle band, which typically suggests an uptrend, but the Stochastic Oscillator %K at 40.68 and %D at 26.43 indicates room for further upward movement before reaching overbought levels. The ADX value of 22.31 on the daily chart confirms a moderate upward trend, but not one with overwhelming strength. This suggests that while the longer-term picture isn't overtly bearish, the immediate upside might be capped by resistance levels that have historically proven significant. The daily signal is predominantly 'BUY' (7 out of 8), but the nuances in MACD and the moderate ADX strength demand attention.
The key support level to watch on the daily chart is $1.16754. A decisive break and hold below this level would invalidate the current bullish bias and could trigger a more significant sell-off, potentially targeting $1.16215 and subsequently $1.15888. On the resistance side, the $1.17620 level is the immediate hurdle. A clear breach and consolidation above this point would confirm a bullish breakout, opening the path towards $1.17947 and possibly $1.18486. The current price action is essentially caught between these two critical zones, highlighting the importance of waiting for a confirmed break before committing to a directional trade. The market is essentially in a 'wait-and-see' mode, with both bulls and bears having valid arguments depending on which timeframe and indicators one prioritizes.
Intermarket Analysis: DXY, Equities, and the Euro's Dance
Understanding the EURUSD's trajectory requires a keen eye on its correlated and inversely correlated assets. The US Dollar Index (DXY), which measures the dollar's strength against a basket of major currencies, is currently trading around 97.80. The data shows a slight daily decline of 0.02%, with a daily range between 97.63 and 97.96. This weakness in the dollar is a significant tailwind for EURUSD. The 1-hour ADX for DXY is a robust 42.96, indicating a strong downtrend, and RSI at 35.19 suggests further downside potential. This aligns with the general narrative of the dollar weakening on the back of mixed US economic data and potential intervention fears regarding the Japanese Yen. The 4-hour and daily charts also show a bearish bias for the DXY, reinforcing the idea that dollar weakness could persist in the short term, offering support to EURUSD.
The broader market sentiment, as indicated by the S&P 500 (SP500) and Nasdaq 100 (Nasdaq100), adds another layer to the analysis. The SP500 is showing a strong upward trend on the 1-hour chart (ADX 49.72) and a neutral trend on the 4-hour (ADX 24.23), but a bearish trend on the daily (ADX 47.51). This divergence suggests internal weakness despite short-term gains. The Nasdaq 100 exhibits a similar pattern, with a strong upward trend on the 1-hour and 4-hour charts, but a daily trend that is also strong and bullish (ADX 32.3). The RSI on the daily Nasdaq is nearing overbought territory at 73.57, hinting at potential exhaustion. Generally, a risk-on environment, where equities are rising, tends to support EURUSD, while a risk-off scenario, marked by falling stocks and a rising DXY, would typically pressure the Euro. The current mixed signals from the equity markets suggest caution, as a sudden shift in risk appetite could quickly alter the forex landscape.
Oil prices, specifically Brent crude at $117.13 and WTI at $107.09, are also relevant. Rising oil prices can fuel inflation expectations, potentially leading central banks like the Federal Reserve to adopt a more hawkish stance, which would typically strengthen the dollar and pressure EURUSD. Conversely, high energy prices can also dampen economic growth, leading to risk aversion. The daily charts for both Brent and WTI show strong bullish trends (ADX 26.88 for Brent, 26.75 for WTI), indicating that energy prices are a persistent factor. The recent pullback in crude oil prices, as reported by some energy news outlets, might offer a slight reprieve from inflation fears, but the overall trend remains upward. This persistent inflationary pressure is a key consideration for the ECB, which has maintained a dovish stance, potentially creating a divergence that benefits EURUSD if the Fed remains hawkish.
The Trader's Perspective: What Does the Data Tell Us?
From a trader's standpoint, the current EURUSD setup on the 1-hour chart presents a 'BUY' signal with 7 out of 10 indicators leaning bullish. However, the MACD's negative momentum and the RSI's current level of 61.08 suggest that the immediate upside might be limited. The Stochastic Oscillator nearing the overbought zone adds another layer of caution. This timeframe is more suited for short-term scalpers or day traders looking for quick entries and exits, but the lack of strong trend confirmation (ADX 25.98) makes it a high-risk environment. The Bollinger Bands are showing the price above the upper band, which could indicate a short-term overextension and a potential for a minor pullback.
The 4-hour chart reinforces the 'BUY' signal, with an overwhelming 8 out of 10 indicators suggesting a bullish bias. Here, the RSI at 57.13 and the positive MACD are encouraging for bulls. However, the Stochastic Oscillator is firmly in overbought territory (K=84.45, D=64.54), which is a classic warning sign for potential reversals or consolidation. The ADX at 18.64 is the most significant factor here, indicating a weak trend. This means that while the momentum might be currently to the upside, the market lacks the conviction for a sustained move. For swing traders, this is a critical signal to be wary of chasing the price higher. A breakout above the immediate resistance at $1.17467 on this timeframe would be needed to confirm a continuation, but the overbought Stochastic and weak ADX suggest this might be a difficult level to overcome without a period of consolidation or a minor pullback first.
The daily timeframe, while showing a strong 'BUY' consensus (7 out of 8), also contains elements of caution. The MACD is showing negative momentum, contrary to the overall bullish signal. The Stochastic Oscillator, while not yet overbought, is in the upper half of its range, suggesting potential for further gains but also increasing the risk of a reversal. The ADX at 22.31 indicates a moderate trend, but not one that screams 'long-term commitment'. This daily perspective is crucial for longer-term investors and position traders. They will be looking for confirmation of a sustained move above the $1.17620 resistance. Without it, the risk of a deeper correction towards the $1.16754 support remains significant. The overarching theme across all timeframes is a cautious optimism, a 'watch and wait' scenario rather than an outright 'buy the dip' or 'sell the rally' environment.
Trade Recommendation: The 'Watch Zone' Decision
Given the mixed signals across multiple timeframes and the low ADX values indicating a lack of strong trend conviction, the current EURUSD setup falls into the 'WATCH_ZONE' category. The decision score of 1 out of 8 reflects the high degree of uncertainty. While the daily and 4-hour charts lean bullish, the conflicting MACD on the daily, the overbought Stochastic on the 4-hour, and the consistently weak ADX across shorter timeframes suggest that the market is currently choppy. This means that entering a trade now carries a higher risk of being caught in a range or a false breakout. The critical level to monitor is the daily resistance at $1.17620. A clear and decisive daily close above this level, accompanied by an increase in volume and stronger ADX readings, would validate the bullish scenario and open the door for a move towards $1.18486. Conversely, a failure to break this resistance and a subsequent drop below the $1.16754 support level would invalidate the bullish thesis and likely lead to a deeper correction.
For traders, patience is key. Instead of forcing a trade in this ambiguous environment, it's prudent to wait for clearer confirmation. This might involve waiting for the ADX to strengthen significantly, indicating a commitment to a trend, or for a confirmed break of either the key support or resistance levels. The current environment is ripe for scalpers who can navigate short-term fluctuations, but for swing and position traders, waiting for a more defined setup is advisable. The market is offering clues, but not yet a clear directive. The absence of a strong trend means that volatility can cut both ways, making risk management paramount. Observing how EURUSD interacts with the $1.17620 resistance and the $1.16754 support in the coming sessions will be crucial in determining the next significant move.
Bearish Scenario: Correction Beckons
60% ProbabilityBullish Scenario: The Euro Takes Flight
30% ProbabilityNeutral Scenario: Range Consolidation
10% ProbabilityThe broader economic backdrop continues to influence EURUSD. The European Central Bank's (ECB) recent stance, holding interest rates steady and appearing somewhat dovish amidst inflation concerns, contrasts with the Federal Reserve's potentially more hawkish outlook. This policy divergence, if it persists, could offer underlying support to EURUSD in the medium term. However, geopolitical tensions and energy price fluctuations remain key variables that could sway market sentiment and impact the Euro's performance. For instance, any escalation in conflicts affecting energy supply routes could lead to a flight to safety, strengthening the dollar and pressuring EURUSD, regardless of ECB policy.
The primary risk for the bullish case is the persistent weakness indicated by the MACD on the daily chart and the low ADX readings across timeframes, suggesting a lack of trend conviction. A failure to break above $1.17620 could lead to a swift reversal, especially if US economic data surprises to the upside or if geopolitical risks escalate, prompting a flight to the dollar. Traders should maintain strict risk management, utilize stop-losses, and avoid over-leveraging in this uncertain environment.
Frequently Asked Questions: EURUSD Analysis
What happens if EURUSD breaks decisively above the $1.17620 resistance level?
A confirmed daily close above $1.17620, supported by increasing volume and stronger ADX readings, would invalidate the current consolidation phase. This bullish breakout would likely target the next resistance at $1.17947, with a secondary target at $1.18486. Such a move would signal a shift towards a more sustained upward trend.
Should I consider buying EURUSD at current levels near $1.1736 given the mixed signals?
Given the 'WATCH_ZONE' recommendation and the low ADX values indicating a choppy market, aggressive buying at current levels is not advised. A more prudent approach would be to wait for a confirmed break of either the $1.17620 resistance or the $1.16754 support. Entering on a confirmed breakout offers a higher probability setup with clearer risk parameters.
Is the RSI at 55.44 on the daily chart a bullish signal for EURUSD?
An RSI reading of 55.44 on the daily chart is considered neutral, leaning slightly bullish. It indicates that buyers have some control but are not yet in the overbought territory (typically above 70). While it supports the possibility of further upside, it's not a strong standalone buy signal and should be considered alongside other indicators like MACD and ADX for confirmation.
How might upcoming US economic data impact EURUSD this week, given the current DXY weakness?
Upcoming US data releases are critical. If data, such as employment figures or inflation reports, comes in significantly stronger than expected, it could quickly reverse the DXY's weakness, putting downward pressure on EURUSD. Conversely, weaker data would likely extend the dollar's decline and support a move higher for EURUSD, especially if the ECB maintains its current policy stance.
| Indicator | Value | Signal | Interpretation |
|---|---|---|---|
| RSI (14) | 55.44 | Neutral | Slightly bullish momentum on daily chart |
| MACD Histogram | -0.000X | Bearish | Negative momentum on daily chart |
| Stochastic | K:40.68, D:26.43 | Bullish | Room for upside before overbought territory |
| ADX | 22.31 | Neutral | Moderate trend strength on daily chart |
| Bollinger | Middle Band | Bullish | Price above middle band on daily chart |
Track markets in real-time
AI-powered analysis, technical indicators and real-time price data.
Join Our Telegram Channel
Breaking market news, AI analysis and trading signals instantly.
Join Channel