

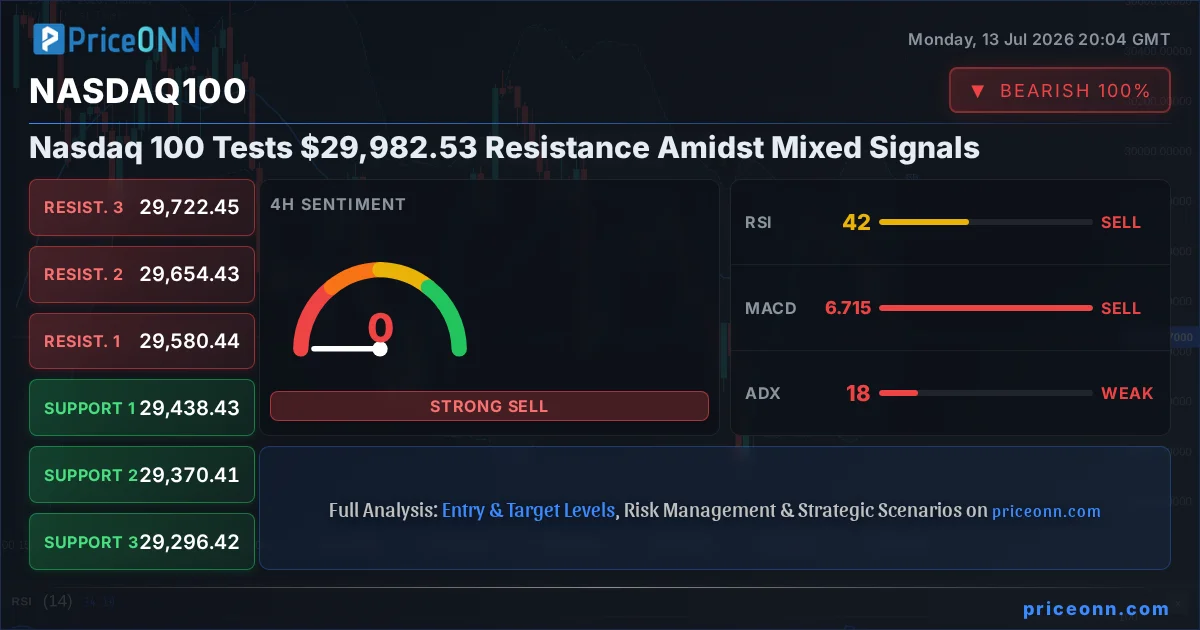
The Nasdaq 100 is currently locked in a tense battleground, approaching a significant resistance level near $29,982.53. With the index trading at $29,256.33, the question on every trader's mind is whether this ascent can continue or if a pullback is imminent. This critical juncture demands a deep dive into the technical indicators, market sentiment, and the broader economic landscape that is shaping the trajectory of this tech-heavy index. We're seeing a fascinating divergence in signals, where some indicators point towards continued strength, while others flash warnings of potential exhaustion. Understanding this dichotomy is key to navigating the choppy waters ahead.
- RSI at 47.2 on the daily chart signals a neutral-to-bearish leaning, suggesting potential for further downside pressure on the Nasdaq 100.
- Critical resistance sits at $29,982.53, a level that has acted as a ceiling in previous trading sessions, indicating a significant hurdle for bulls.
- MACD histogram shows negative momentum on the daily chart, hinting that bearish sentiment could be gaining traction.
- The correlation with the DXY, currently at 101.31, suggests that a strengthening dollar could add headwinds to US equity indices like the Nasdaq 100.
The Bullish Case: Resilience in the Face of Headwinds
Despite the prevailing bearish signals across several timeframes, a case can still be made for the Nasdaq 100's continued resilience. On the daily chart, the price is currently trading above the middle Bollinger Band, which historically suggests an upward bias, even if momentum is softening. The Stochastic Oscillator, showing %K at 56.54 and %D at 45.69, is in a bullish crossover territory, hinting at potential upward momentum building. Furthermore, the ADX on the daily timeframe stands at 25.06, indicating a strong trend is present, although the daily MACD histogram's negative reading suggests this trend might be weakening. The 1-hour chart, in particular, shows a strong upward trend with an ADX of 25.24 and a positive MACD momentum, suggesting that short-term traders might still be finding opportunities to push prices higher. The overall signal on the 1-hour chart leans towards 'Buy' (Al: 0, Sat: 8, Nötr: 0), indicating short-term strength.
The SP500, a close cousin to the Nasdaq 100, is showing some signs of strength on its 4-hour chart, with a bullish signal (Al: 6, Sat: 2, Nötr: 0). This broader market strength can sometimes provide a tailwind for the Nasdaq 100, even if its own indicators are mixed. The fact that the Nasdaq 100 has managed to hold above key psychological levels and is now approaching resistance at $29,982.53 speaks to a certain underlying strength in the market's risk appetite, at least among certain segments. The daily chart's Stochastic Oscillator's bullish crossover (%K > %D) is a signal that cannot be entirely ignored, suggesting that buyers might still be lurking, waiting for a confirmation to step in. This resilience, especially when viewed against the backdrop of a strengthening dollar (DXY at 101.31), highlights the determination of bulls to push higher.
Moreover, the strong upward trend on the 1-hour chart, characterized by an ADX of 25.24 and positive MACD momentum, suggests that intraday traders are still favoring long positions. This short-term bullish sentiment, if sustained, could provide the initial impetus needed to challenge the $29,982.53 resistance. The Bollinger Bands on the 1-hour chart are also situated above the middle band, reinforcing this short-term bullish inclination. While the daily indicators paint a more cautious picture, the immediate price action on lower timeframes offers a glimmer of hope for those betting on a continued rally. The ability of the Nasdaq 100 to maintain its position above $29,256.33 and inch towards higher levels demonstrates a degree of technical fortitude that warrants attention from both bulls and bears.
The Bearish Case: Cracks in the Foundation
However, the bearish argument is compelling, drawing strength from multiple indicators across different timeframes. The daily chart presents a particularly gloomy picture. The RSI(14) at 47.2 is firmly in neutral territory but trending downwards, suggesting that the buying pressure is waning. More concerning is the MACD, which is showing negative momentum on the daily chart, with the MACD line below the signal line and the histogram in negative territory. This indicates that the selling pressure is building and could lead to a more significant downturn. The ADX on the daily chart at 25.06, while indicating a strong trend, is accompanied by bearish momentum signals, which can be a precursor to a trend reversal.
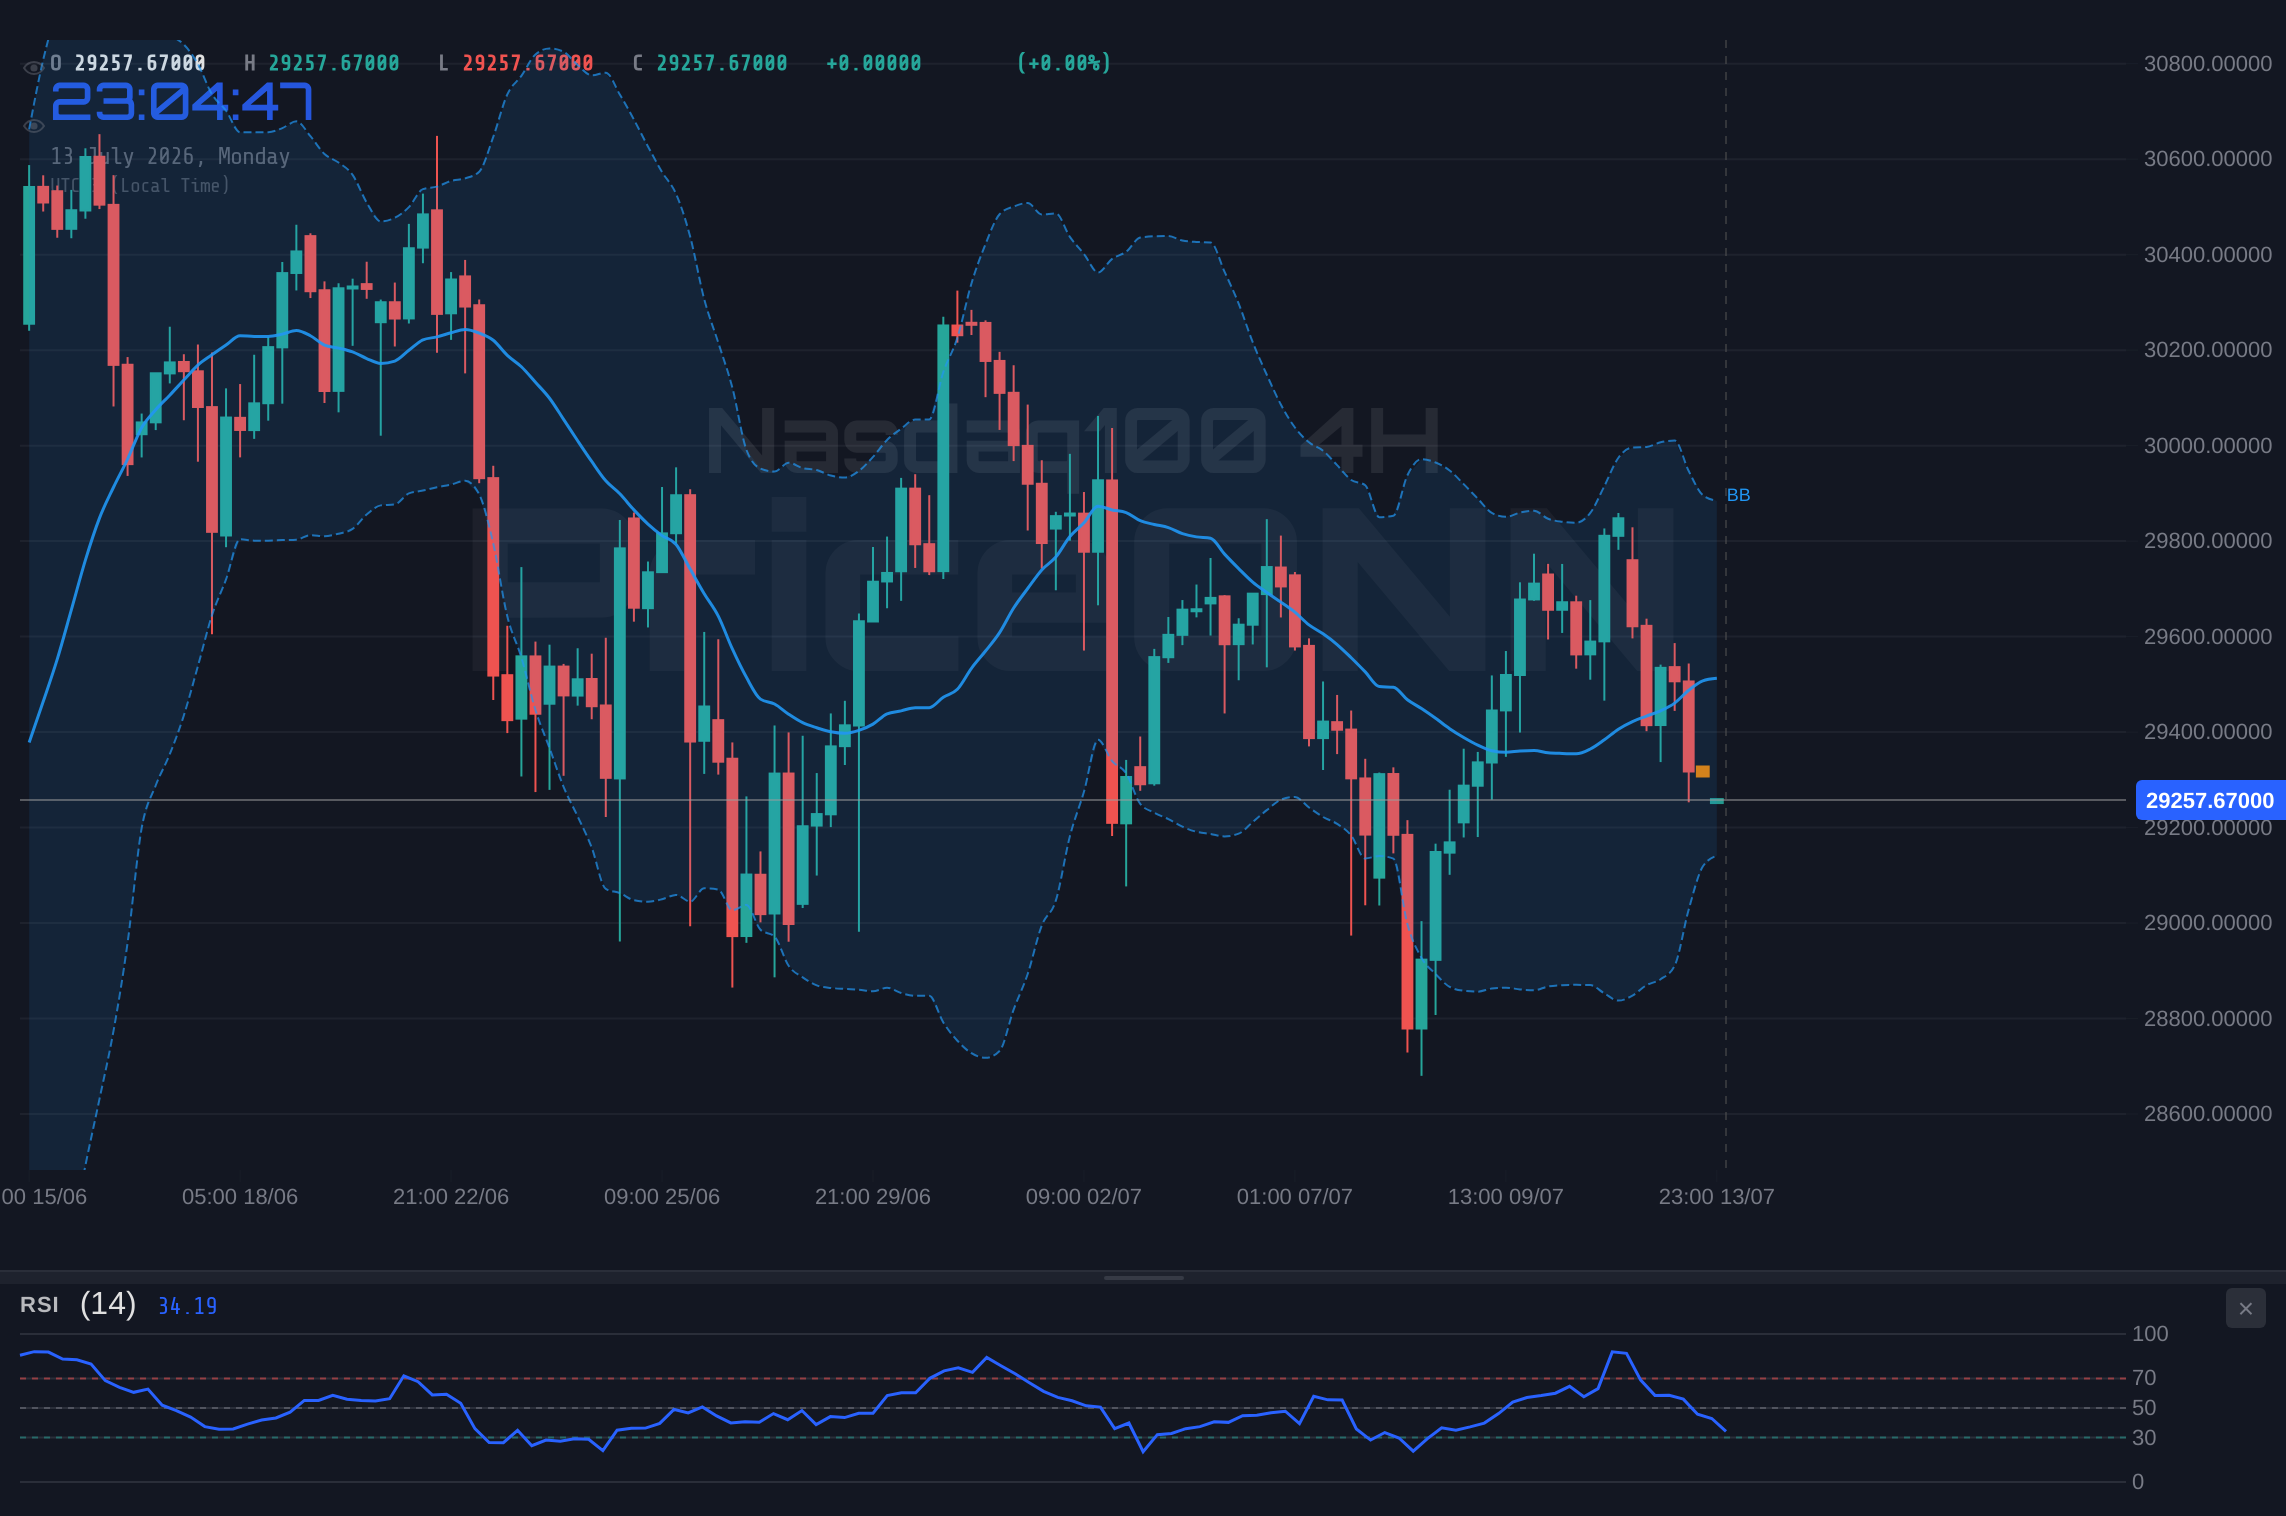
The 4-hour chart reinforces these concerns. The RSI(14) at 41.97 is clearly in the bearish zone, and the MACD is also showing negative momentum. The Stochastic Oscillator on this timeframe has %K (23.61) below %D (49.42), a classic bearish signal. The general signal across the 4-hour timeframe is 'Sell' (Al: 0, Sat: 8, Nötr: 0), underscoring the prevailing bearish sentiment on this intermediate timeframe. The fact that the price is trading below the middle Bollinger Band on the 4-hour chart further supports the idea of downward pressure. This confluence of bearish signals across the daily and 4-hour charts cannot be easily dismissed.
The correlation with the broader market also plays a role. The SP500, while showing some strength on lower timeframes, has a daily trend that is firmly bearish (Trend: Düşüş, Güç: 100%). Its RSI is at 45.35, and the MACD is negative, mirroring the Nasdaq 100's struggles. The Dow Jones Industrial Average is also showing bearish signals on its 4-hour chart (General Signal: SAT) and a neutral stance on its 1-hour chart. This general weakness in the major US indices suggests that any upward move in the Nasdaq 100 might be met with significant selling pressure from the broader market. Furthermore, the strengthening US Dollar Index (DXY) to 101.31 adds another layer of complexity. A stronger dollar typically puts pressure on US equities, including the Nasdaq 100, as it makes dollar-denominated assets more expensive for foreign investors. The risk-off sentiment, as indicated by the fall in the SP500 and Dow Jones futures, further supports the bearish narrative.
The significant drop in XAUUSD (Gold) by -2.82% to $4,002.82, with an RSI(14) at 29.45 on the 1-hour chart, signals a potential flight to safety away from risk assets. While gold is often seen as a safe haven, its sharp decline alongside equities suggests a broader deleveraging event might be underway, which would negatively impact growth-oriented tech stocks within the Nasdaq 100. Similarly, XAGUSD (Silver) has also seen a substantial drop of -3.53% to $57.72, further confirming the risk-off sentiment. This broad-based decline in commodities, coupled with the bearish technicals on the Nasdaq 100 itself, paints a concerning picture for the bulls. The key resistance level at $29,982.53 is unlikely to be breached easily under these conditions.
Navigating the Crossroads: Scenarios and Outlook
Given the conflicting signals, the market is at a critical crossroads. The interplay between short-term bullish momentum and longer-term bearish indicators, coupled with macroeconomic pressures, creates a volatile environment. The Nasdaq 100's ability to hold its ground near $29,256.33 and approach resistance at $29,982.53 is a testament to the ongoing battle between buyers and sellers. The coming days will be crucial in determining the next significant move.
Bearish Scenario: The Resistance Holds Firm
65% ProbabilityNeutral Scenario: Consolidation Around Key Levels
25% ProbabilityBullish Scenario: Breaking Through Resistance
10% ProbabilityThe Macroeconomic Backdrop: Dollar Strength and Inflation Fears
The current market environment is heavily influenced by macroeconomic factors, primarily the trajectory of the US Dollar and persistent inflation concerns. The DXY, or Dollar Index, is currently trading at 101.31, showing a clear upward trend on the 1-hour and 4-hour charts. This strength in the dollar is a significant headwind for US equities, as it increases the cost of dollar-denominated assets for international investors and can signal a tightening monetary policy environment. The Federal Reserve's stance on inflation remains a key driver, and any indication of a hawkish policy shift could further bolster the dollar and weigh on riskier assets like the Nasdaq 100.
Inflation remains a persistent concern, despite efforts by central banks to curb it. While specific inflation data releases like CPI or PCE are not provided in the market context for this exact moment, the general market sentiment suggests that inflation is still a significant factor influencing monetary policy decisions. The price action in commodities like XAUUSD and XAGUSD, both showing sharp declines, could be interpreted in multiple ways. A sharp drop in gold and silver might indicate a reduction in safe-haven demand, potentially due to easing geopolitical tensions or a belief that inflation is coming under control. However, it could also signal a broader deleveraging event, where investors are liquidating assets across the board, including riskier equities.
The strength in Brent crude oil prices, which surged by 8.8% to $82.55, and WTI crude oil, up 8.82% to $77.89, is a significant factor that cannot be ignored. Rising oil prices often translate into higher inflation expectations, which could force the Federal Reserve to maintain a hawkish stance or even consider further rate hikes. This creates a challenging environment for growth stocks within the Nasdaq 100, which are typically sensitive to interest rate changes. The conflict in the Middle East, as highlighted by the news about U.S.-Iran escalation, is undoubtedly contributing to the surge in oil prices and adding to geopolitical uncertainty. This ongoing tension fuels a risk-averse sentiment in the broader market, which is generally detrimental to tech stocks.
The recent analyst sentiment regarding Rio Tinto (RIO) as a top metals pick, while not directly related to the Nasdaq 100, indicates a sector-specific focus. However, the broader market sentiment, as reflected in the wobbling Dow Jones Industrial Average and the slip in Dow Jones futures, points towards increasing risk aversion. The news that the US-Iran escalation is rekindling supply fears in oil markets further exacerbates this sentiment. This complex interplay of rising commodity prices, a strengthening dollar, and geopolitical uncertainty creates a challenging environment for the Nasdaq 100, making the $29,982.53 resistance level a formidable barrier.
The Nasdaq 100 is caught between the potential for continued Fed hawkishness due to rising energy prices and the risk-off sentiment impacting growth stocks. The DXY's strength at 101.31 adds further pressure, making it difficult for bulls to sustain upward momentum beyond key resistance levels.
Technical Deep Dive: Indicators in Conflict
When we dissect the technical indicators for the Nasdaq 100, a picture of conflicting signals emerges, highlighting the current indecision in the market. On the daily chart, the RSI(14) at 47.2 suggests a neutral-to-bearish leaning, indicating that the index is neither overbought nor oversold, but the downward trend implies a lack of strong buying conviction. The MACD histogram is negative, confirming the bearish momentum on this longer timeframe. However, the Stochastic Oscillator on the daily chart presents a more optimistic view with %K at 56.54 and %D at 45.69, indicating a bullish crossover and potential for upward movement. This divergence between the RSI/MACD and the Stochastic is a key point of contention.
The 4-hour timeframe offers more clarity on the bearish side. The RSI(14) at 41.97 is clearly in bearish territory, and the MACD is also showing negative momentum. The Stochastic Oscillator's %K (23.61) is below %D (49.42), reinforcing the bearish outlook. The ADX on the 4-hour chart at 17.88 suggests a weak trend, which aligns with the idea of a market consolidating or preparing for a significant move, but the immediate signals lean towards caution. The general signal for the 4-hour timeframe is a clear 'Sell' (Al: 0, Sat: 8, Nötr: 0), indicating that intermediate-term traders are likely favoring short positions.
Zooming into the 1-hour chart, we see a different story. The ADX at 25.24 indicates a strong trend, and the MACD shows positive momentum. The RSI(14) at 37.38 is in neutral territory, but the Stochastic Oscillator's %K (16) below %D (24.89) signals a bearish crossover, contradicting the overall trend strength indicated by the ADX. The general signal on the 1-hour chart is 'Sell' (Al: 0, Sat: 8, Nötr: 0), which is surprising given the strong trend reading. This discrepancy between the ADX and other indicators on the 1-hour chart suggests that the short-term trend might be losing steam or that the market is becoming increasingly volatile and unpredictable.
The conflicting signals across timeframes are the primary reason for the current indecision. While the daily chart shows bearish momentum, the Stochastic offers a hint of potential upside. The 4-hour chart is decidedly bearish, while the 1-hour chart presents a strong trend that is paradoxically accompanied by bearish signals. This technical complexity means that any move above the $29,982.53 resistance would need strong confirmation, and a break below the $29,256.33 current price could lead to a sharp decline, targeting lower support levels such as $29,162.67.
| Indicator | Value | Signal (1H) | Signal (4H) | Signal (1D) | Interpretation |
|---|---|---|---|---|---|
| RSI (14) | 47.2 | 37.38 | 41.97 | 47.2 | Neutral to bearish leaning, lack of strong buying conviction. |
| MACD | Negative | Negative | Negative | Negative | Bearish momentum building across timeframes. |
| Stochastic | %K: 56.54 / %D: 45.69 (Bullish Crossover) | %K: 16 / %D: 24.89 (Bearish) | %K: 23.61 / %D: 49.42 (Bearish) | %K: 56.54 / %D: 45.69 (Bullish) | Conflicting signals across timeframes, daily shows bullish potential. |
| ADX | 25.06 | 25.24 | 17.88 | 25.06 | Strong trend indicated on 1D and 1H, weak on 4H. |
The Verdict: Caution Reigns Supreme
The Nasdaq 100 is currently navigating a complex technical and macroeconomic landscape. While short-term charts show some bullish impetus, the longer-term daily and 4-hour indicators, coupled with broader market weakness and dollar strength, paint a predominantly bearish picture. The key resistance level at $29,982.53 is a formidable barrier, and the probability of the index failing to break through it appears significantly higher than a sustained rally. The bearish scenario, with a 65% probability, suggests a pullback towards support levels, with $29,162.67 and potentially $28,970 being key targets.
The neutral scenario, with a 25% probability, suggests a period of consolidation between the current price and the resistance level, characterized by choppy trading and indecision. This could be a temporary pause before a more decisive move. The bullish scenario, carrying only a 10% probability, hinges on a strong breakout above $29,982.53, which would require a significant shift in market sentiment or a catalyst that is not currently apparent in the data. Therefore, the prevailing outlook is one of caution, with bears likely to find more opportunities in the short to medium term.
Traders should pay close attention to how the Nasdaq 100 behaves around the $29,256.33 price point. A failure to hold this level could accelerate the move towards the lower support targets. Conversely, a strong, volume-backed push above $29,982.53 would signal a potential shift in momentum, but this seems less likely given the current indicators. The market sentiment, heavily influenced by geopolitical events and inflation data, will play a crucial role in dictating the direction. Patience and risk management are paramount as the index sits at this critical inflection point.
Frequently Asked Questions: Nasdaq 100 Analysis
What happens if Nasdaq 100 fails to break above the $29,982.53 resistance level?
If the Nasdaq 100 fails to break above the $29,982.53 resistance, a bearish scenario becomes more probable. This could lead to a pullback towards the 1-hour support level at $29,162.67, with potential for further downside to $28,970.
Should I consider buying Nasdaq 100 at current levels of $29,256.33 given the mixed signals?
Given the mixed signals and approaching resistance, buying at current levels of $29,256.33 carries significant risk. A more prudent approach, with a 65% probability scenario favoring bears, would be to wait for a clear signal, either a confirmed break above resistance or a retest of lower support levels with bullish confirmation.
Is the RSI at 47.2 a sell signal for Nasdaq 100 right now?
An RSI of 47.2 on the daily chart is not a direct sell signal but indicates a neutral-to-bearish leaning, suggesting a lack of strong buying conviction. Combined with negative MACD momentum, it supports the bearish outlook, implying that upside potential might be limited.
How will the rising DXY at 101.31 affect Nasdaq 100 this week?
A rising DXY at 101.31 typically exerts downward pressure on US equity indices like the Nasdaq 100. This strengthening dollar can make US assets more expensive for foreign investors and may signal a continuation of tighter monetary policy, potentially hindering the Nasdaq 100's ability to break significant resistance levels.
Track markets in real-time
AI-powered analysis, technical indicators and real-time price data.
Join Our Telegram Channel
Breaking market news, AI analysis and trading signals instantly.
Join Channel