

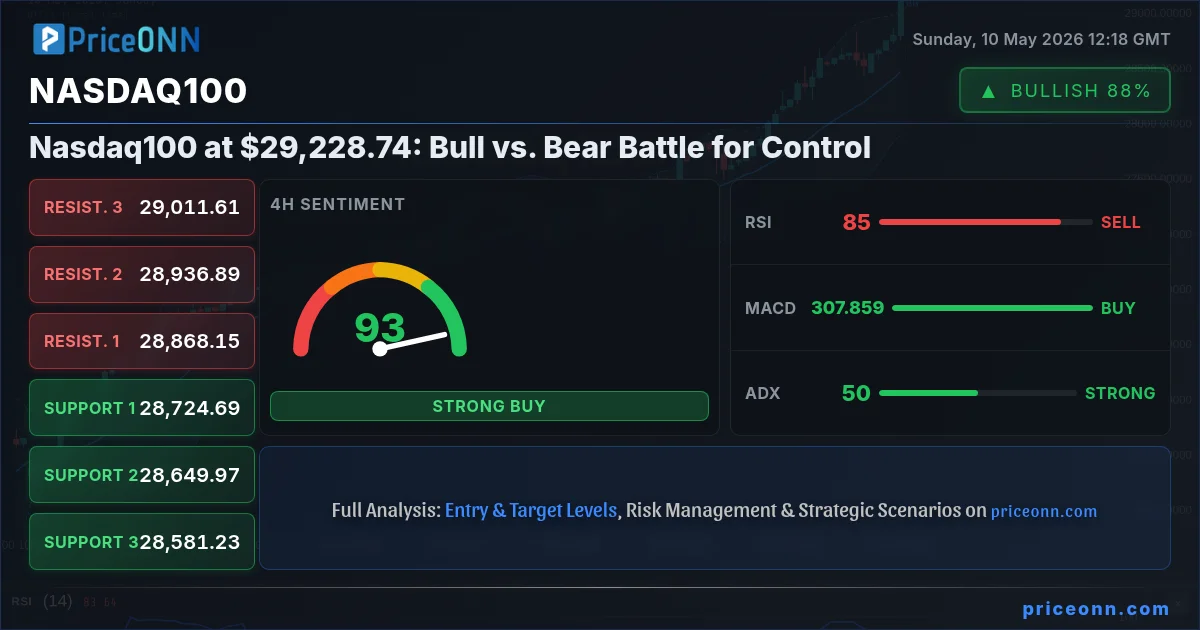
The Nasdaq100 index is currently locked in a critical battleground, trading precisely at $29,228.74. This pivotal price point is where the optimism of the bulls clashes head-on with the caution of the bears, creating a fascinating technical tableau. For weeks, the tech-heavy index has been on a relentless upward trajectory, fueled by the insatiable appetite for artificial intelligence-driven growth and a seemingly resilient US economy. However, as we approach key resistance levels and indicators flash mixed signals, the question on every trader's mind is: can the rally sustain its momentum, or are we on the cusp of a significant pullback? This article dives deep into the Nasdaq100's current technical setup, exploring the arguments for both bullish continuation and bearish reversal, and providing actionable insights for various trading horizons.
- The Nasdaq100 is trading at $29,228.74, a critical juncture where bullish and bearish forces are in contention.
- On the 4-hour chart, the ADX at 49.89 signals a strong trend, but Stochastic readings in the extreme zone (97.85) suggest overbought conditions for the S&P 500, indicating potential for a short-term reversal.
- For Nasdaq100, RSI at 83.87 on the 1H chart and 84.75 on the 4H chart signals extreme overbought conditions, highlighting risks of a pullback.
- The DXY's decline to 97.61 suggests a weaker dollar, which typically supports risk assets like the Nasdaq100, but geopolitical tensions and inflation concerns add layers of complexity.
The narrative surrounding the Nasdaq100 has been dominated by the AI boom, a powerful force propelling major tech stocks to new heights. Companies at the forefront of AI development are seeing significant inflows, driving the index higher despite broader economic concerns. This has created a bullish sentiment that, on the surface, appears unshakable. However, a closer look at the technical indicators reveals a more nuanced picture. On the 1-hour chart, the Relative Strength Index (RSI) is hovering around 83.87, firmly in overbought territory. This suggests that the recent upward move may have been too fast, too soon, and a period of consolidation or even a correction is becoming increasingly likely. The MACD indicator on the same timeframe shows negative momentum, with the MACD line below its signal line, further reinforcing the idea that the immediate upward pressure might be waning. While the ADX at 46.79 indicates a strong trend, the confluence of overbought RSI and negative MACD momentum on shorter timeframes warrants caution for aggressive long positions at these elevated levels.
Delving into the 4-hour timeframe for the Nasdaq100 offers a slightly different, yet still complex, perspective. Here, the trend is also strongly bullish, with an ADX reading of 49.89 underscoring the power behind the recent rally. The RSI, at 84.75, is even more extended than on the 1-hour chart, pointing towards significant overbought conditions. This is a classic sign that the market might be due for a pause or a reversal. The Stochastic Oscillator, with %K at 97.85 and %D at 86.96, is deep in overbought territory, further confirming the potential for a short-term downturn. However, it's crucial to note that strong trends can sometimes persist even with stretched indicators. The question becomes whether the underlying economic fundamentals and geopolitical landscape can support such an extended rally. The recent uptick in US inflation, approaching 3.8% year-over-year, and the ongoing geopolitical tensions, particularly concerning Iran, add a layer of risk that cannot be ignored. While the AI narrative provides a powerful tailwind, these macro factors could act as a significant headwind if they escalate.
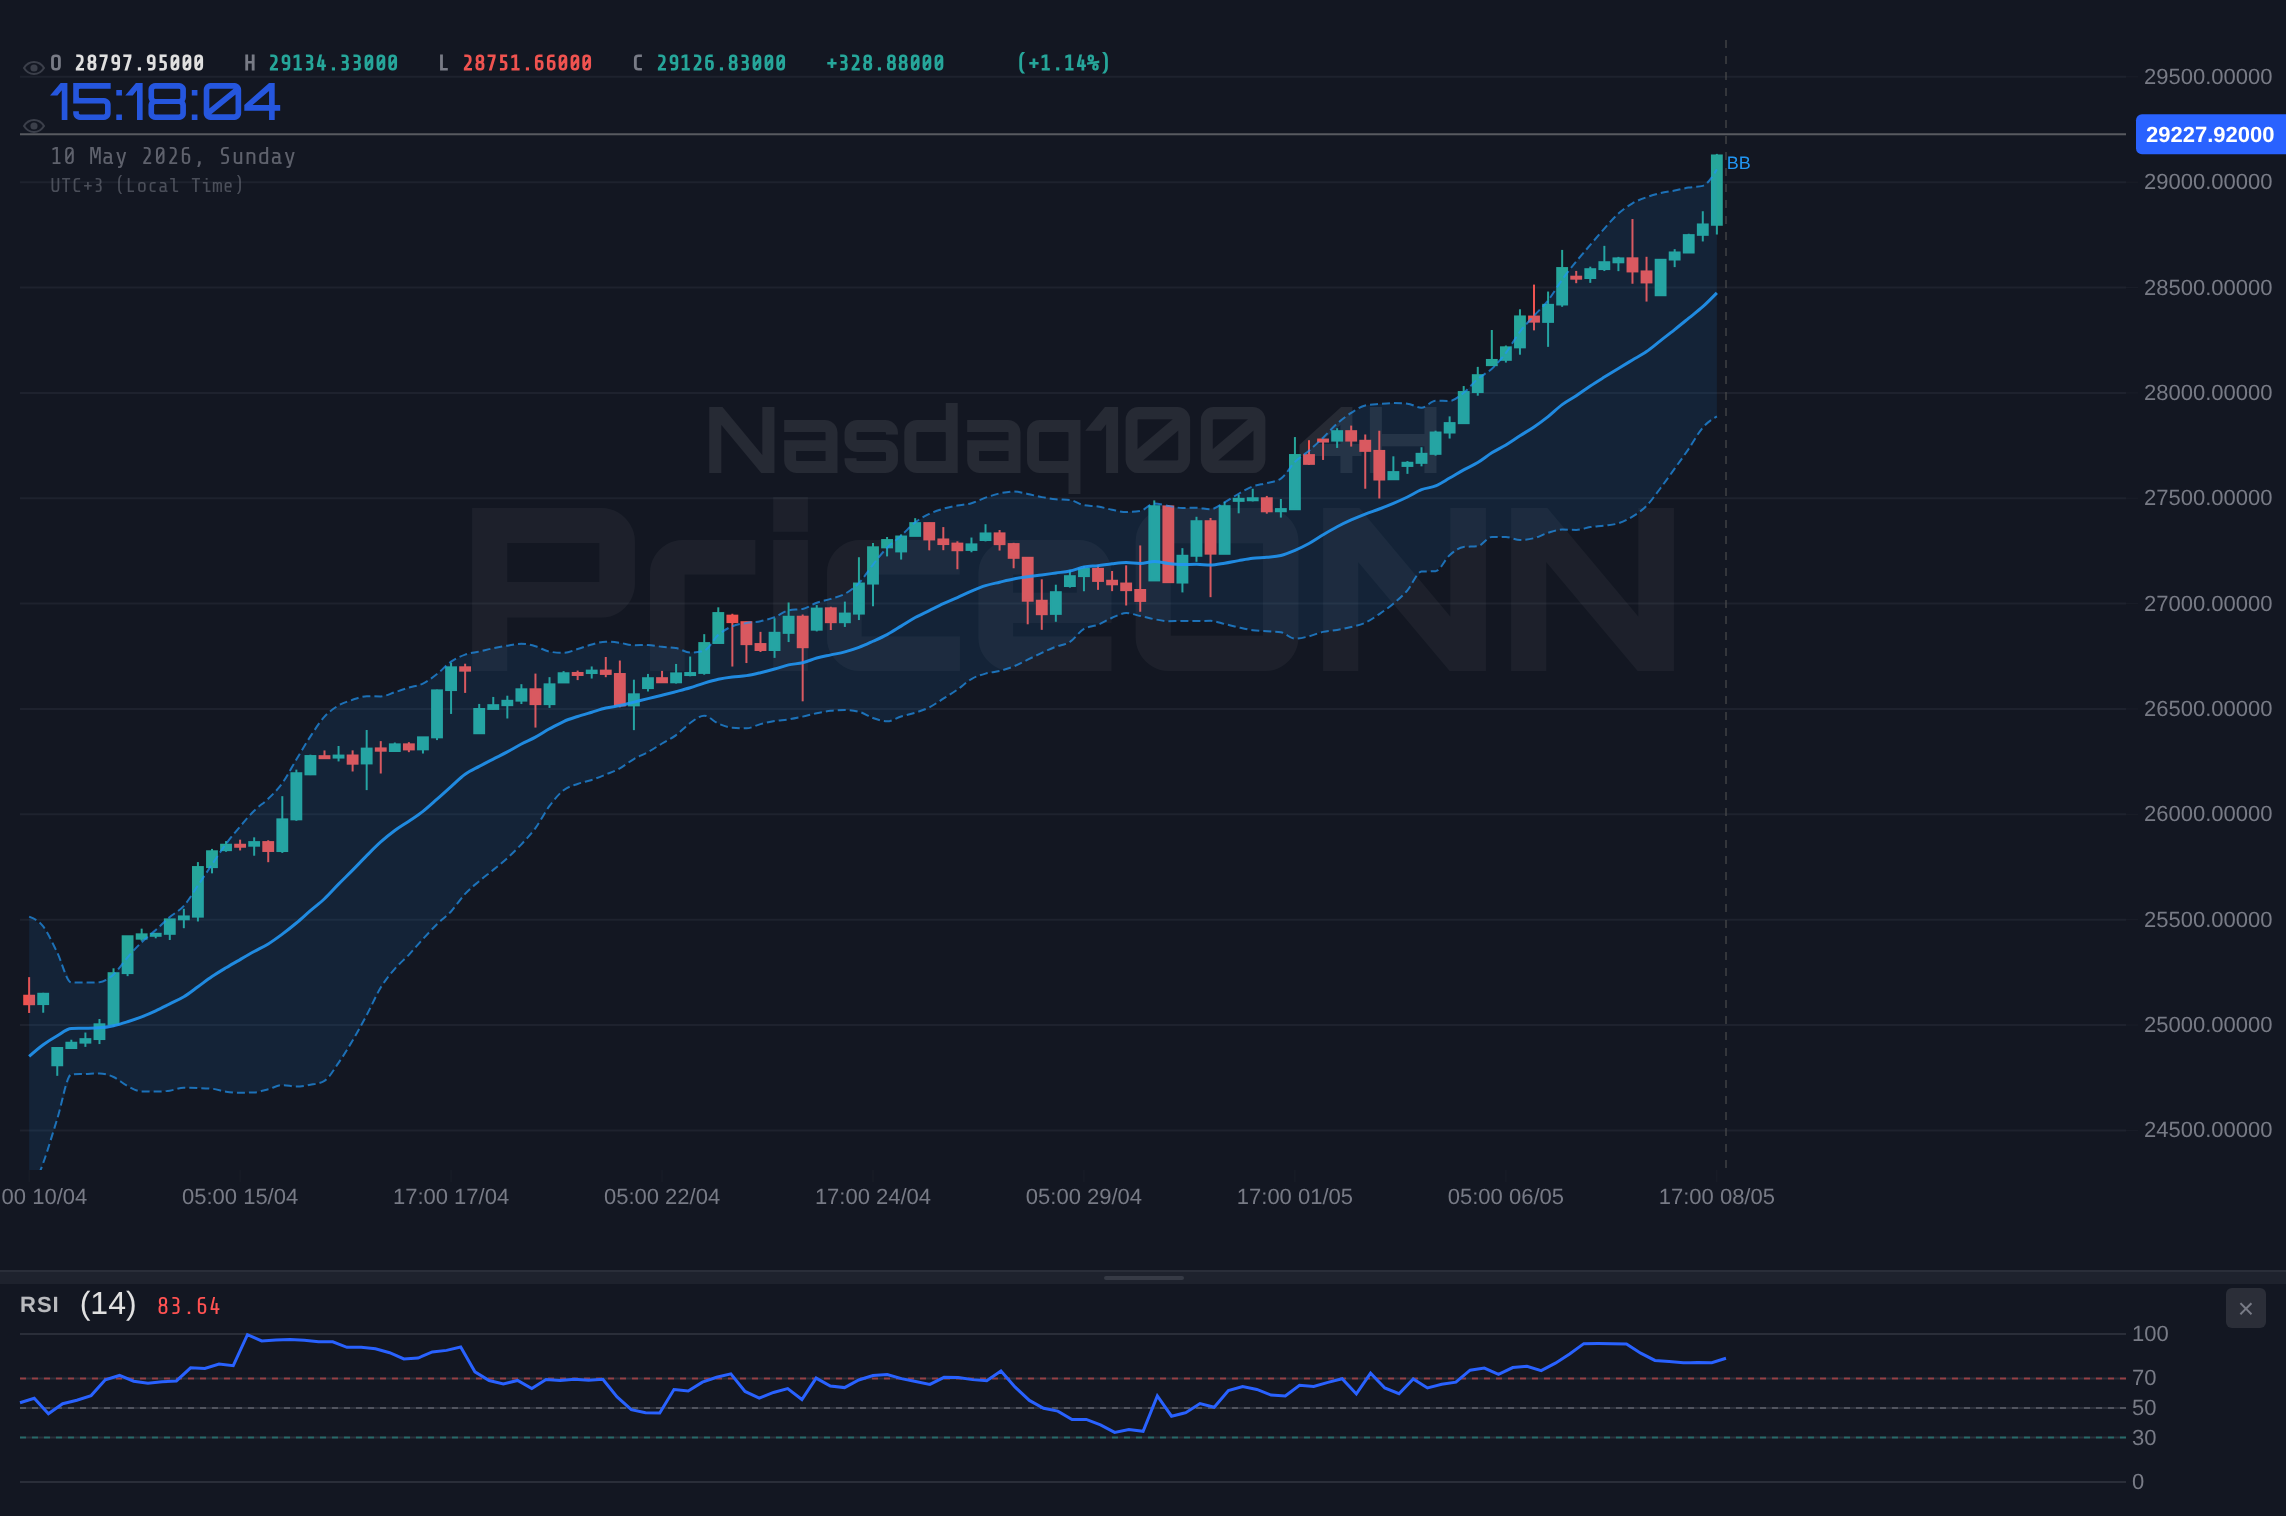
When we zoom out to the daily chart for the Nasdaq100, the picture becomes even more complex. The overall trend is still classified as bullish, but the ADX reading has softened slightly to 39.66, suggesting a strong trend is still in play, but perhaps not accelerating at the same pace as on shorter timeframes. The RSI at 82.99 remains in extreme overbought territory, a condition that has historically preceded significant pullbacks or consolidations. The MACD shows positive momentum, but the histogram is narrowing, which could indicate a loss of upward steam. The Stochastic Oscillator, with %K at 92.71 and %D at 90.42, is also deeply overbought. This daily view suggests that while the long-term trend remains intact, the short-to-medium term could see increased choppiness. For long-term investors, these readings might signal a time to be more cautious about adding new positions at these all-time highs, perhaps waiting for a pullback to more attractive entry levels, or dollar-cost averaging to mitigate the risk of buying at a temporary peak.
The Bull Case: AI and Economic Resilience Fuel the Fire
The bulls are betting heavily on the continued dominance of Artificial Intelligence and the underlying strength of the US economy. The narrative is clear: AI is not just a fad; it's a transformative technology poised to revolutionize industries, boost productivity, and drive corporate earnings for years to come. Companies heavily invested in AI infrastructure, software, and applications are experiencing a surge in demand and innovation, translating into robust revenue growth and expanding profit margins. This fundamental tailwind is seen as sustainable, providing a solid foundation for the Nasdaq100's ascent. Furthermore, the recent US employment report, which showed strong job creation (189k previous, forecast 203k), suggests that the labor market remains healthy. This resilience in employment data, coupled with moderating inflation expectations (though a recent uptick to 3.8% is noted), provides a backdrop where the Federal Reserve might be able to maintain a stable interest rate environment or even consider rate cuts later in the year. This economic stability, combined with the AI revolution, creates a potent cocktail for further upside. The bulls argue that any dips are merely opportunities to accumulate positions at better prices, believing the long-term growth trajectory remains firmly intact.
From a technical perspective, the bulls point to the persistent strength shown across multiple timeframes. The daily chart, despite its overbought indicators, still shows a higher low and higher high structure, which is the hallmark of an uptrend. The ability of the index to consistently push into new all-time highs, even with some stretched indicators, speaks to the underlying buying pressure. Support levels, such as the 4-hour support at $28,724.69 and the daily support at $28,363.45, are seen as robust zones where any significant pullback would likely find buyers. The fact that the index has managed to hold these levels during previous periods of uncertainty reinforces the bullish conviction. Moreover, the correlation with other risk assets, while complex, generally shows that as the US Dollar Index (DXY) has dipped to 97.61, the Nasdaq100 has found support, indicating that a weaker dollar environment is conducive to higher equity prices. This inverse relationship is a classic dynamic that bulls are leveraging. They believe that as long as AI continues to be the dominant theme and economic data remains broadly supportive, the path of least resistance for the Nasdaq100 is upwards, with the next significant resistance target being the psychological $30,000 mark.
The bulls also highlight the resilience of the tech sector against rising interest rates and inflation. While higher rates can typically put pressure on growth stocks by increasing the cost of capital and discounting future earnings more heavily, the current AI-driven enthusiasm seems to be overriding these concerns. Investors are willing to look past the immediate economic headwinds, focusing instead on the long-term potential of AI. This suggests a shift in market psychology, where transformative technological advancements are being prioritized over traditional macroeconomic concerns. Furthermore, the lack of significant selling pressure even when indicators are stretched is seen as a sign of strong hands accumulating positions. Scalpers and short-term traders might find opportunities on pullbacks to support levels, expecting a swift recovery. Swing traders might look for confirmation of a bullish continuation pattern after a period of consolidation, targeting higher resistance levels. Long-term investors, meanwhile, see this as a secular bull market driven by technological innovation, a trend that could last for years, making current levels attractive entry points for a buy-and-hold strategy.
The Bear Case: Overbought Conditions, Inflationary Headwinds, and Geopolitical Risks
On the flip side, the bears are sounding the alarm, pointing to a confluence of factors suggesting that the rally is becoming unsustainable. The most prominent argument centers on the extreme overbought conditions across multiple timeframes. On the 1-hour and 4-hour charts, RSI readings well above 80, coupled with deeply overbought Stochastic oscillators, scream caution. Historically, such extended readings often precede sharp reversals or significant corrections as profit-taking kicks in and the market rebalances. The MACD on the shorter timeframes also shows negative momentum, suggesting that the buying pressure is weakening, and sellers are beginning to exert control. The ADX, while indicating a strong trend, can also signal exhaustion when readings are extremely high, especially when combined with other overbought indicators. This suggests that the trend, while powerful, might be running out of steam.
Beyond the technicals, the bears are increasingly concerned about the macroeconomic backdrop. The recent uptick in US inflation, with headline CPI projected to approach 3.8% year-over-year, is a significant red flag. If inflation proves to be more persistent than anticipated, it could force the Federal Reserve to delay or even reverse its course on potential interest rate cuts, leading to higher borrowing costs and increased pressure on growth stocks. The market's current optimism seems to be pricing in a dovish Fed, but a re-acceleration of inflation could quickly derail that expectation. Furthermore, geopolitical risks, such as the ongoing tensions in the Middle East and the broader US-China relations, remain a persistent threat. Any escalation in these fronts could trigger a flight to safety, hurting risk assets like the Nasdaq100. The recent news highlighting that 'Markets Embrace Strong US Employment Report, but Iran Remains the Bigger Risk' underscores this concern. A sudden geopolitical shock could quickly unwind the current bullish sentiment.
The bears also point to the divergence between the Nasdaq100 and other market segments. While the tech-heavy index has surged, broader indices like the S&P 500 (currently trading at 6572.87, with a daily RSI of 45.35 indicating weakness) and the Dow Jones 30 (trading at 49641, with a 4-hour ADX of 19.33 suggesting a weak trend) are showing signs of lagging or even weakness. This divergence suggests that the Nasdaq100's rally might be concentrated in a few AI-related stocks, creating a narrow market leadership that is vulnerable to a sharp correction if those specific sectors falter. The news that 'Equity markets have been aggressively chasing an AI-driven rally, pushing major indices to new records while largely overlooking broader economic weakness as geopolitical tensions rise' further supports this view. If the broader economic picture deteriorates or if AI enthusiasm wanes, the Nasdaq100 could face significant selling pressure. For short-term traders, this presents an opportunity to bet on a pullback, targeting support levels like $28,724.69 or even $28,363.45. Swing traders might look for breakdown confirmation below key short-term support.
Technical Confluence: Indicators Speak Louder Than Words
When we look at the technical indicators, the narrative becomes a battle of timeframes and conflicting signals. On the 1-hour chart, the picture is decidedly bearish in the short term. The RSI at 49.9 is neutral but trending down, MACD is negative, and Stochastic is giving a clear sell signal (%K
Transitioning to the 4-hour chart, the indicators paint a different story, leaning heavily bullish. The ADX at 40.59 signals a strong uptrend, RSI is at 60.24 (bullish trend), MACD is positive, and Stochastic is giving a strong buy signal (%K > %D). The Bollinger Bands are also showing a bullish inclination, with the price above the middle band. This timeframe suggests that the broader trend remains intact and that any short-term dips might be buying opportunities. The general signal here is 'AL' (Buy: 8, Sell: 0, Neutral: 0), a strong bullish endorsement.
On the daily chart, the indicators offer a more mixed, yet still predominantly bullish, outlook. The ADX at 19.99 suggests a weak trend, meaning the market might be consolidating or in a transition phase rather than a strong directional move. However, RSI at 51.73 is neutral but trending up, and MACD is positive with its signal line above. Stochastic is giving a buy signal (%K > %D) and is approaching overbought territory at 77.17. The Bollinger Bands are also above the middle band, indicating a bullish bias. The overall signal for the daily timeframe is 'AL' (Buy: 7, Sell: 1, Neutral: 0), suggesting that the longer-term trend is still in favor of the bulls, despite the weaker trend strength indicated by the ADX. This divergence between the strong trend on the 4-hour and the weaker trend on the daily, coupled with conflicting signals between shorter and longer timeframes, creates the current tension.
The correlation analysis adds another layer of complexity. The DXY (Dollar Index) is currently at 97.61, showing a bearish trend on the 1-hour and 4-hour charts. A weaker dollar typically supports risk assets like the Nasdaq100, providing a bullish underpinning. However, the S&P 500, trading at 6572.87, shows a strong bearish trend on the daily chart (ADX 47.51) and overbought conditions on the 4-hour (Stochastic 97.85), indicating potential weakness in the broader market. Nasdaq100's strong upward momentum, especially on the 4-hour chart, seems to be somewhat decoupling from the broader equity weakness, possibly due to the AI narrative's concentrated impact. Brent crude oil is trading at $104.18, showing a bearish trend on the 4-hour chart, which might suggest cooling inflation expectations, potentially easing pressure on central banks. However, WTI crude at $95.39 also shows a bearish trend. This mixed picture across correlated assets suggests that while the dollar weakness is a tailwind, the internal strength of the Nasdaq100 itself, driven by AI, is the primary engine, but it faces headwinds from broader market weakness and potential overextension.
Navigating the Crossroads: Scenarios and Strategies
Given the conflicting signals and the critical price level at $29,228.74, multiple scenarios are plausible. The market is at a crossroads, and the direction it takes will depend on a delicate balance of AI-driven momentum, economic data, and geopolitical stability.
Bearish Scenario: Profit-Taking and Macro Headwinds Bite
60% ProbabilityNeutral Scenario: Consolidation Amidst Uncertainty
25% ProbabilityBullish Scenario: AI Momentum Overrides Concerns
15% ProbabilityFor scalpers, the key is to watch for short-term opportunities around the $29,228.74 level. A rejection from current levels could offer a quick shorting opportunity targeting the 1-hour supports like $29,086.27 or $29,047.87. Conversely, a strong hold above $29,228.74 with increasing volume could signal a short scalp long towards immediate resistance. Swing traders need to be more patient, waiting for clear confirmation. A bearish scenario might involve waiting for a break below the 4-hour support at $28,724.69, with targets around $28,363.45. A bullish scenario would require a decisive break and hold above the daily resistance at $29,146.73, potentially targeting higher levels. Long-term investors, while benefiting from the overall AI trend, should consider the current overbought conditions on daily charts. Dollar-cost averaging into positions or waiting for a more significant pullback to daily support levels like $28,363.45 or even $27,971.81 might be a prudent strategy to mitigate the risk of entering at a market top. The historical context of tech-driven bull markets suggests long-term upside, but short-term corrections are inevitable and can offer superior entry points.
The correlation with the DXY at 97.61 is a significant factor. As the dollar weakens, it typically provides a tailwind for assets like the Nasdaq100. However, the S&P 500's bearish daily trend and the Nasdaq100's more concentrated AI-driven rally create a divergence. This suggests that the Nasdaq100's movement might be less influenced by broad market sentiment and more by sector-specific enthusiasm. The oil prices, showing bearish trends on multiple timeframes, could indicate cooling inflation expectations, which might be interpreted positively by the Fed. Yet, the recent uptick in US inflation to 3.8% remains a concern, and any further acceleration could shift the Fed's stance, impacting equity markets negatively. Geopolitical risks, like the situation in Iran, are a constant wildcard that could trigger a flight to safety, benefiting assets like gold but hurting riskier assets. Therefore, while the technical picture on the 4-hour chart is bullish, the macro environment presents significant uncertainties that could lead to a bearish outcome if key support levels are breached.
What's Next for the Nasdaq100?
The immediate future of the Nasdaq100 hinges on its ability to navigate the current resistance and support levels. A decisive break above the $29,146.73 daily resistance, fueled by strong buying volume and positive news, could propel the index towards the $30,000 psychological level and beyond. This would likely be driven by continued AI optimism and favorable economic data. Conversely, a failure to hold above $29,228.74 and a subsequent break below the 4-hour support at $28,724.69 could signal the start of a more significant correction. Bears will be watching closely for a close below this level, targeting the daily supports at $28,363.45 and $27,971.81. The neutral scenario involves range-bound trading between these key levels, offering opportunities for range traders but signaling indecision in the broader market.
For traders, risk management is paramount. Given the extreme overbought conditions on shorter timeframes and the potential for macro headwinds, caution is advised. Scalpers should focus on immediate price action around $29,228.74, looking for quick entries and exits. Swing traders should await clear directional confirmation, either a confirmed breakout above resistance or a decisive breakdown below support. Long-term investors might consider a more conservative approach, perhaps dollar-cost averaging or waiting for a more attractive entry point during a pullback. The historical precedent of tech-driven bull markets suggests long-term potential, but the current overextended technicals and macroeconomic uncertainties cannot be ignored. The next few trading sessions will be crucial in determining whether the AI-fueled rally can overcome these challenges or if a significant correction is imminent.
The economic calendar, although light on high-impact events this weekend, will be closely watched next week. Any surprises in inflation or employment data could significantly sway market sentiment and the Fed's policy outlook. The ongoing geopolitical situation also remains a critical factor, with any escalation potentially triggering a flight to safety. Therefore, while the Nasdaq100 shows strong bullish momentum on the 4-hour chart, the confluence of overbought indicators, potential macro headwinds, and geopolitical risks necessitates a balanced approach. Traders should remain vigilant, manage their positions prudently, and wait for clear signals before committing significant capital. The market's ability to digest these factors will ultimately dictate whether the Nasdaq100 can continue its ascent or if a period of recalibration is due.
Frequently Asked Questions: Nasdaq100 Analysis
What happens if Nasdaq100 breaks below the $28,724.69 support level?
If the Nasdaq100 closes decisively below the 4-hour support at $28,724.69, it would invalidate the bullish short-term trend and likely trigger further selling pressure. The immediate downside target would then be the daily support level at $28,363.45, with a secondary target at $27,971.81 if the bearish momentum accelerates.
Should I buy Nasdaq100 at current levels around $29,228.74 given the RSI at 83.87?
Buying at current levels around $29,228.74 is risky given the RSI reading of 83.87 on the 1-hour chart, indicating extreme overbought conditions. While the 4-hour trend is strong, a pullback is likely. Long-term investors might consider dollar-cost averaging, while short-term traders should wait for a pullback to better support levels or a confirmed breakout above resistance.
Is the MACD negative momentum on the 1-hour chart a sell signal for Nasdaq100?
The negative MACD momentum on the 1-hour chart, with the MACD line below its signal line, suggests weakening bullish pressure in the very short term. While not a standalone sell signal, it aligns with other overbought indicators and increases the probability of a near-term pullback or consolidation. Confirmation would be needed from price action breaking key short-term support.
How will the potential Fed rate policy shift affect Nasdaq100 if inflation nears 3.8%?
If US inflation continues to trend towards 3.8% or higher, it could pressure the Federal Reserve to reconsider interest rate policy, potentially delaying rate cuts or even hinting at future hikes. This would increase borrowing costs, negatively impacting growth stocks like those in the Nasdaq100 and potentially triggering a bearish scenario.
The market's reaction to upcoming economic data and geopolitical developments will be critical in the coming days. While the AI narrative provides a powerful bullish driver, the potential for overbought conditions and macro headwinds cannot be dismissed. Traders and investors should remain disciplined, adhere to their risk management strategies, and wait for clear confirmation before making significant moves. The Nasdaq100 is at a pivotal point, and patience will likely be rewarded for those who wait for the right setup.
Track markets in real-time
AI-powered analysis, technical indicators and real-time price data.
Join Our Telegram Channel
Breaking market news, AI analysis and trading signals instantly.
Join Channel