

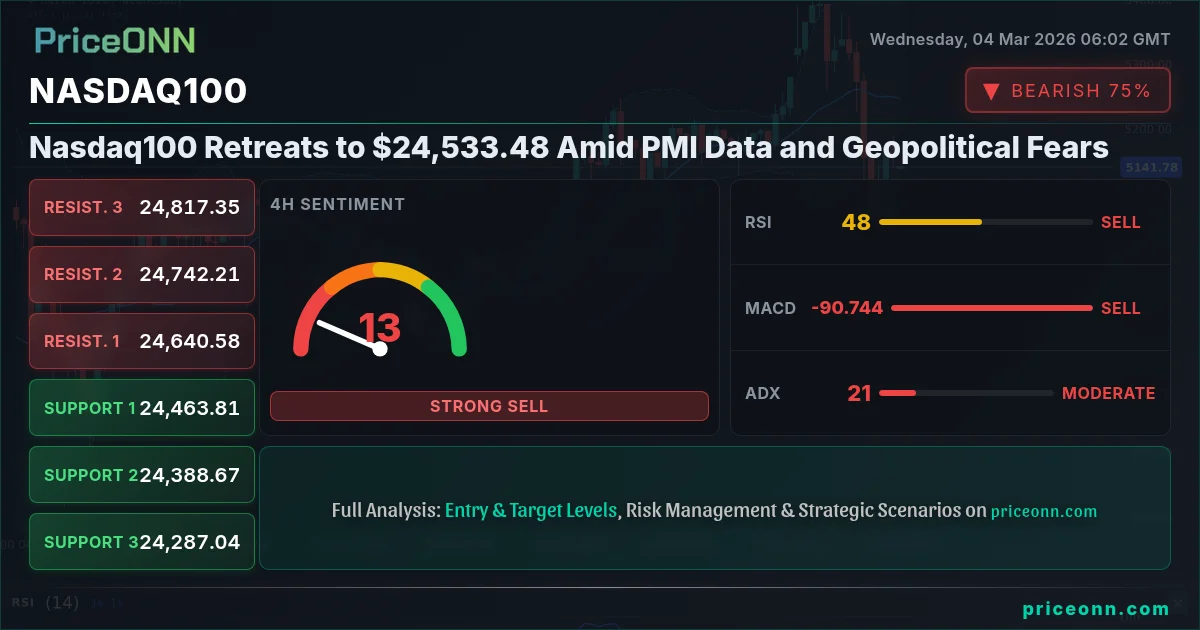
The Nasdaq100 is facing headwinds, currently trading at $24,533.48, as a confluence of factors weighs on investor sentiment. Weaker-than-expected Purchasing Managers Index (PMI) data, coupled with escalating geopolitical tensions, are driving a flight to safety, impacting risk assets like the Nasdaq100. This "nasdaq analysis today" will delve into the technical and fundamental factors driving this price action.
- Nasdaq100 retreats to $24,533.48 as PMI data disappoints and geopolitical risks rise.
- Key support lies at 24,336.92, a break below which could trigger further downside.
- RSI at 41.29 suggests further room to fall before reaching oversold territory.
- Upcoming U.S. ADP Nonfarm Employment Change data on Wednesday could further impact market sentiment.
Economic Data Dampens Tech Optimism
The recent pullback in the Nasdaq100 can be attributed, in part, to disappointing economic data. While the equity markets have largely shrugged off weaker data in anticipation of a Fed pivot, cracks are beginning to show. The upcoming U.S. ADP Nonfarm Employment Change, scheduled for Wednesday, is expected to provide further insights into the labor market's health. A weaker-than-expected print could reinforce the narrative of slowing economic growth, further pressuring the Nasdaq100.
The U.S. Services Purchasing Managers Index (PMI), also due on Wednesday, will be closely watched for signs of economic strength. The forecast stands at 52.3, slightly below the previous reading of 52.7. A number below 50 would signal contraction in the services sector, a key driver of the U.S. economy. The market is also awaiting the U.S. ISM Non-Manufacturing Prices and ISM Non-Manufacturing Purchasing Managers Index (PMI), adding another layer of potential volatility to Wednesday's trading session.
Geopolitical Risks Add to Market Uncertainty
Adding to the economic woes, escalating geopolitical tensions are creating a risk-off environment. According to recent reports, escalating geopolitical tensions involving the US, Israel, and Iran are roiling forex markets, driving risk-off sentiment. This has a direct impact on the Nasdaq100, as investors seek safe-haven assets, leading to a reduction in exposure to riskier assets like technology stocks. News of disruptions to Iraqi crude exports through the Strait of Hormuz, as detailed in recent reports, are potentially tightening global energy markets and adding to inflationary concerns, further weighing on the Nasdaq100.
Technical Analysis: Nasdaq100 Key Levels to Watch
From a technical perspective, the Nasdaq100 is currently testing key support levels. The 1-day chart shows a clear downtrend, with the index trading below its middle Bollinger Band. The RSI(14) stands at 41.29, indicating further room to fall before reaching oversold territory. The MACD histogram is negative, signaling bearish momentum. These indicators point to further downside in the near term, unless a catalyst emerges to reverse the current trend.
Immediate support lies at 24,336.92, a level that has acted as a key pivot in recent weeks. A break below this level could open the door for a move towards 24,000.17. On the upside, initial resistance is found at 24,989.92, followed by 25,306.17. A sustained move above these levels would be needed to negate the current bearish bias.
The 4-hour chart paints a similar picture, with the Nasdaq100 trading below its middle Bollinger Band and the RSI(14) at 41.69. The ADX at 21.86 signals a moderate downtrend. The stochastic oscillator, however, shows a potential bullish divergence, with the %K line crossing above the %D line. This suggests a possible short-term bounce, but the overall trend remains bearish.
Multi-Timeframe Analysis: Contrasting Signals
While the 1-hour and 4-hour charts suggest further downside, the daily chart presents a more nuanced picture. The ADX on the daily chart is at 28.55, signaling a strong downtrend. However, the stochastic oscillator shows a potential bullish divergence, with the %K line crossing above the %D line. This suggests a possible short-term bounce, but the overall trend remains bearish. This multi-timeframe analysis highlights the importance of considering multiple perspectives when assessing market conditions. AI technical analysis can help traders navigate these conflicting signals by identifying high-probability setups and managing risk effectively.
What This Means for Traders
Given the current market conditions, traders should exercise caution when approaching the Nasdaq100. The combination of weak economic data and geopolitical risks creates a challenging environment for risk assets. While a short-term bounce is possible, the overall trend remains bearish. Traders should focus on identifying key support and resistance levels, and manage their risk accordingly. Price action analysis suggests that a break below 24,336.92 could trigger a significant sell-off. Conversely, a sustained move above 24,989.92 would be needed to negate the current bearish bias.
Traders employing chart pattern recognition may want to watch for the formation of bearish patterns, such as head and shoulders or descending triangles. These patterns could provide further confirmation of the downtrend and offer potential shorting opportunities. Breakout scanner tools can also be used to identify potential breakout trades, but traders should be mindful of the high level of volatility and manage their risk accordingly.
Market Sentiment and Key Levels
Market sentiment towards the Nasdaq100 is currently bearish, as evidenced by the negative momentum and the flight to safety. However, it is important to remember that market sentiment can change quickly, and traders should be prepared to adjust their strategies accordingly. Key level alerts can help traders stay informed of potential breakouts and breakdowns, allowing them to react quickly to changing market conditions. A key level to watch is the aforementioned 24,336.92.
With DXY at 98.9, the Nasdaq100 is under pressure. The dollar index strengthens by 0.26%, putting pressure on the Nasdaq100. Upcoming U.S. Retail Sales MoM data on Friday will be closely watched for signs of economic strength. A stronger-than-expected print could reinforce the narrative of a resilient U.S. economy, further supporting the dollar and weighing on the Nasdaq100. The market is also awaiting the U.S. Core Retail Sales MoM, adding another layer of potential volatility to Friday's trading session.
Navigating the Uncertainty
The current market environment is characterized by uncertainty, driven by both economic and geopolitical factors. However, volatility also creates opportunity, and traders who are prepared to adapt to changing market conditions can find profitable trading setups. By focusing on key levels, monitoring market sentiment, and managing risk effectively, traders can navigate the uncertainty and capitalize on potential opportunities in the Nasdaq100.
Frequently Asked Questions: Nasdaq100 Analysis
Is Nasdaq100 a good buy right now?
Given the current bearish trend and geopolitical risks, Nasdaq100 may not be a good buy right now for short-term gains. However, if it retraces towards 24,000 and consolidates, it could present a long-term buying opportunity. A break above 24,989.92 would be needed to confirm a bullish reversal.
What is the Nasdaq100 price forecast for this week?
The Nasdaq100 price forecast for this week is bearish, with a potential move towards 24,000 if support at 24,336.92 breaks. Resistance is expected around 24,989.92. A probability of 60% is assigned to the bearish scenario, given the current market conditions.
What are the key support and resistance levels for Nasdaq100?
Key support for Nasdaq100 lies at 24,336.92 and 24,000.17. Key resistance is found at 24,989.92 and 25,306.17. These levels should be closely monitored for potential breakouts and breakdowns.
Why is Nasdaq100 moving today?
Nasdaq100 is moving lower today due to weaker-than-expected PMI data and escalating geopolitical tensions, driving a risk-off sentiment in the market. DXY's strength is also adding pressure.
Track markets in real-time
AI-powered analysis, technical indicators and real-time price data.
Join Our Telegram Channel
Breaking market news, AI analysis and trading signals instantly.
Join Channel