

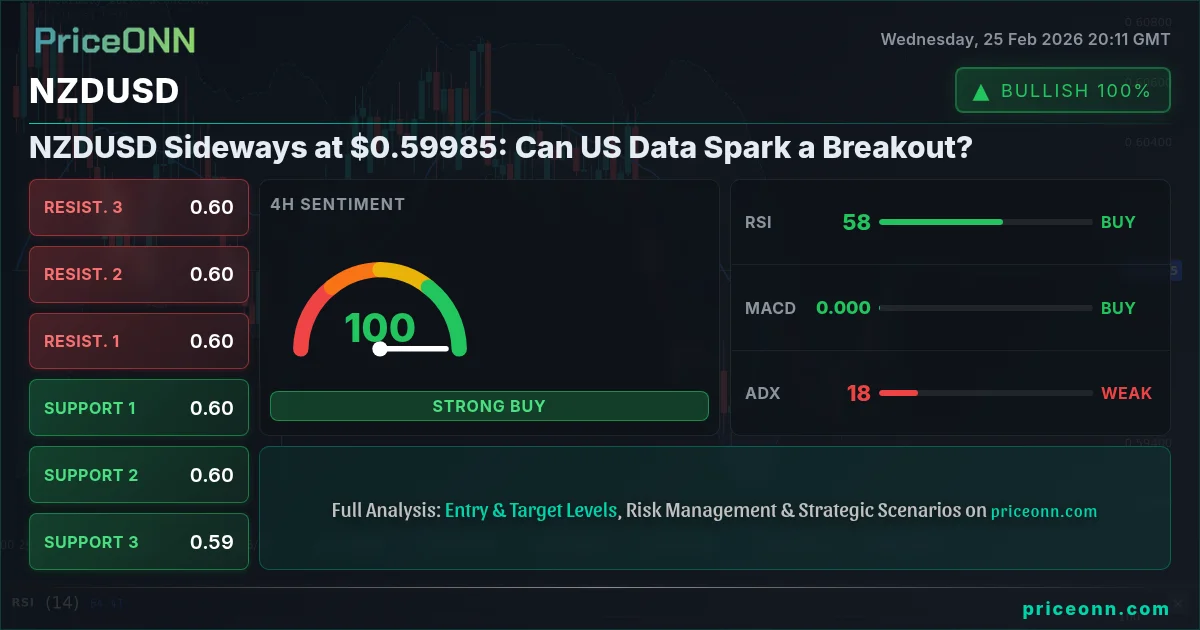
The NZDUSD pair finds itself in a tug-of-war, trading sideways around $0.59985. Bulls aim for a breakout, while bears defend current levels, creating a tension that’s palpable. The question is: will upcoming US data provide the spark needed to ignite a decisive move?
- RSI at 65.53 on the 1H chart suggests bullish momentum but not yet overbought conditions.
- Key resistance sits at $0.60007, a level bulls need to conquer for further upside.
- MACD histogram shows positive momentum, supporting the bullish case.
- DXY weakness is providing a tailwind for NZDUSD, but US data could change that.
The Bull Case: Riding DXY Weakness and Positive Momentum
The bullish argument for NZDUSD hinges on several factors. First, the weakness in the Dollar Index (DXY), currently at 97.36, provides a significant tailwind. A falling DXY generally supports commodity currencies like the New Zealand Dollar. As the DXY weakens, the relative attractiveness of NZDUSD increases. The 1H chart shows an RSI of 65.53, indicating bullish momentum without being excessively overbought, suggesting room for further upside. The MACD histogram also supports this view, displaying positive momentum and reinforcing the bullish sentiment. Furthermore, the Stochastic oscillator, with K=90.64 and D=74.92, signals a potential continuation of the upward trend, though caution is warranted in overbought territory.
From a technical perspective, a key resistance level to watch is $0.60007. A decisive break above this level could trigger a fresh wave of buying, potentially targeting $0.60033 and beyond. The overall signal on the 1H timeframe is “AL” (Al: 8, Sat: 0, Nötr: 0), further bolstering the bullish case. The positive momentum on the 4H chart, where the RSI is at 57.11, suggests that the upward trend has legs, even if the ADX at 19.27 indicates a weak trend, implying that the breakout hasn't fully committed yet.
The Bear Case: Overbought Conditions and US Data Risk
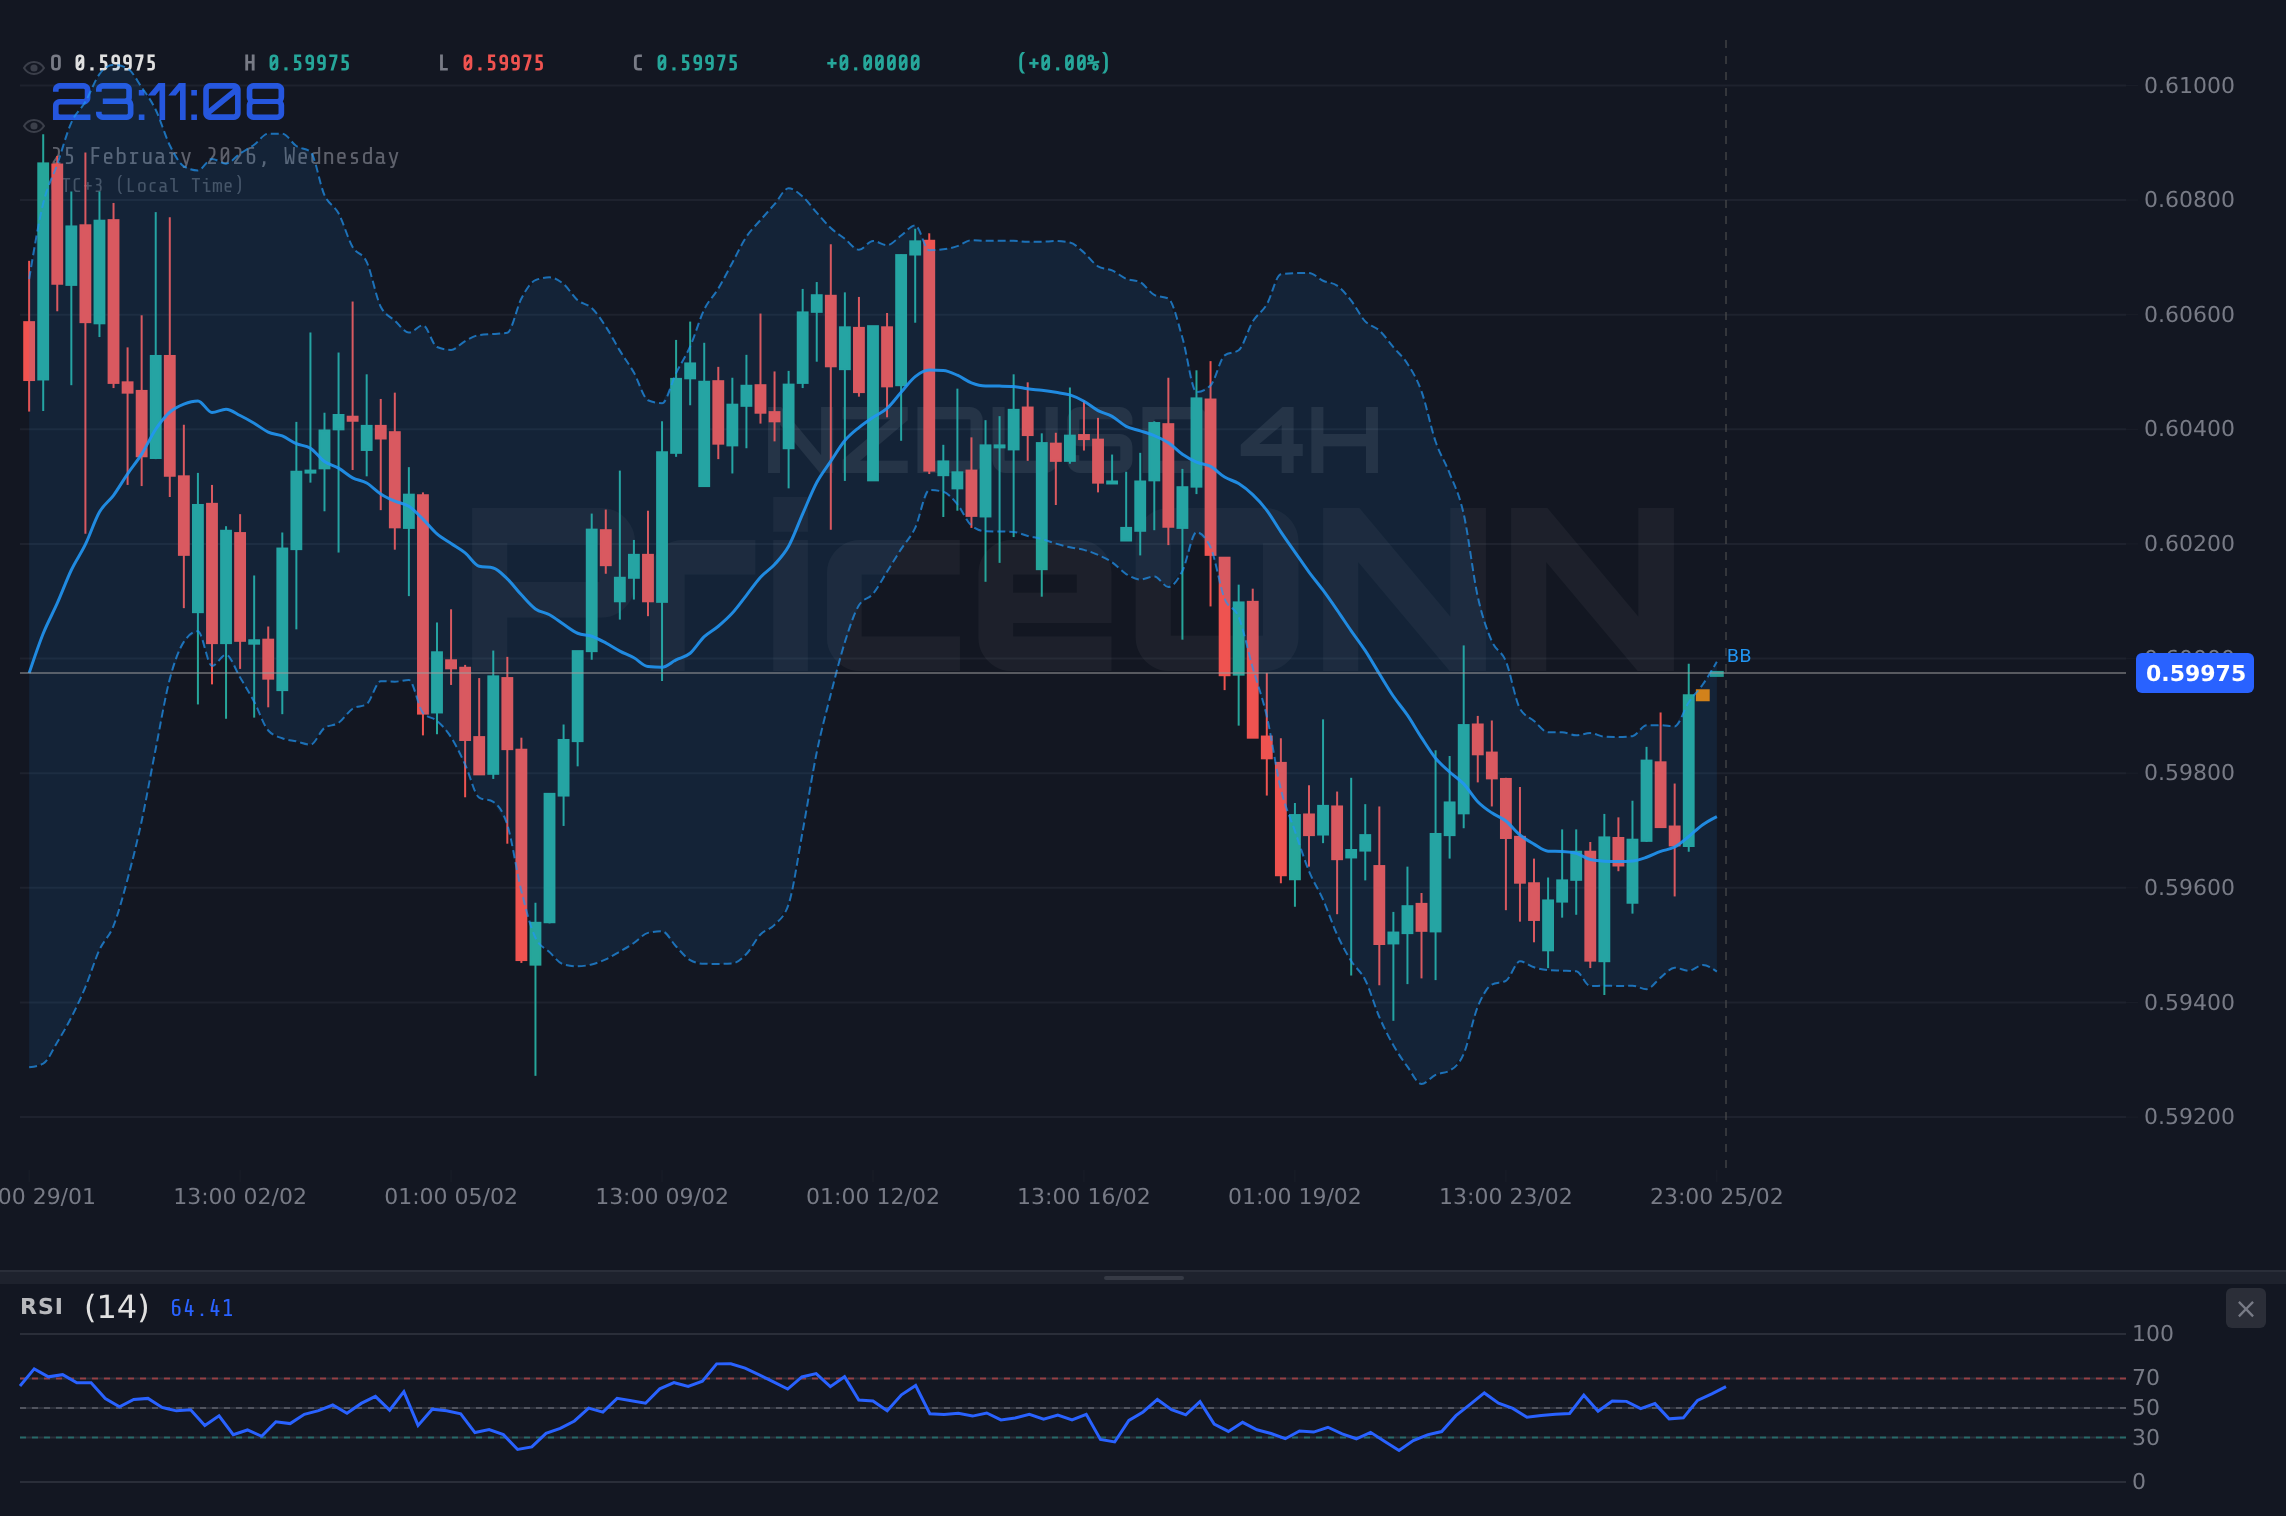
Despite the bullish signals, there's a solid bear case to be made for NZDUSD. The primary concern revolves around potential overbought conditions, particularly on shorter timeframes. The 1H chart shows the Stochastic oscillator in overbought territory, indicating that the pair may be due for a pullback. The ADX on the 1H chart, at 17.17, suggests a weak trend, making the current level vulnerable to a reversal. Furthermore, the 1D chart paints a more neutral picture, with the Stochastic showing K < D, indicating a potential shift in momentum. The RSI on the daily chart, at 54.64, is neutral, suggesting that the upward trend isn’t strongly supported.
Another critical factor is the upcoming US data releases. Stronger-than-expected US data could strengthen the DXY, putting downward pressure on NZDUSD. For instance, if the US data surpasses expectations (Forecast: 217 vs Previous: 206), it could trigger a risk-off sentiment, driving investors towards the safe-haven dollar and away from riskier assets like the New Zealand dollar. The key support level to watch is $0.59937. A break below this level could signal a shift in momentum, potentially targeting $0.59911 and $0.59889 as the next support zones.
Technicals as the Tiebreaker: Multi-Timeframe Analysis
To break the tie between the bull and bear cases, a multi-timeframe analysis is crucial. The 1H chart is predominantly bullish, but the overbought Stochastic and weak ADX raise caution flags. The 4H chart presents a mixed picture, with positive momentum but a weak trend, suggesting that the upward move may lack conviction. The daily chart is neutral, with the Stochastic showing a potential shift in momentum. The ADX on the daily chart, at 24.95, indicates a moderate trend, but the overall signal is “AL” (Al: 4, Sat: 3, Nötr: 0), suggesting a lack of clear direction.
The RSI on the 4H chart, at 57.11, also indicates that the pair has room to move in either direction. The Bollinger Bands on the 1H chart show that the price is currently testing the upper band, suggesting potential overbought conditions. The 1D chart shows the price below the middle band, indicating a potential downward bias. The key is to watch for a decisive break above $0.60007 or below $0.59937. A sustained move beyond these levels would provide a clearer indication of the future direction of NZDUSD.
The Verdict: Patience and Confirmation are Key
Given the mixed signals and the upcoming US data, the best approach for NZDUSD is patience. The market is currently range-bound, and a decisive move requires a catalyst. Monitor the US data releases closely. Stronger-than-expected data could strengthen the DXY and trigger a downward move in NZDUSD, while weaker-than-expected data could weaken the DXY and support an upward move.
Wait for confirmation before taking a position. If the price breaks above $0.60007 with strong volume, consider a long position, targeting $0.60033 and $0.60070 as potential profit levels. Conversely, if the price breaks below $0.59937 with strong volume, consider a short position, targeting $0.59911 and $0.59889 as potential profit levels. Manage your risk carefully and use stop-loss orders to protect your capital. With DXY at 97.36, NZDUSD will be directly impacted by any dollar strength or weakness.
Frequently Asked Questions: NZDUSD Analysis
Is NZDUSD a good buy right now?
NZDUSD is currently trading around $0.59985. Given the mixed signals and upcoming US data, it's prudent to wait for a decisive break above $0.60007 or below $0.59937 before considering a buy or sell position.
What is the NZDUSD price forecast for this week?
The NZDUSD price forecast for this week depends heavily on the US data releases. A break above $0.60070 could see the pair test $0.60100, while a break below $0.59900 could lead to a test of $0.59800.
What are the key support and resistance levels for NZDUSD?
Key support levels for NZDUSD are $0.59937, $0.59911, and $0.59889. Key resistance levels are $0.60007, $0.60033, and $0.60070, based on the 1H timeframe.
Why is NZDUSD moving today?
NZDUSD is currently range-bound, influenced by DXY weakness and anticipation of upcoming US data releases. Any significant deviation from expectations in the US data could trigger a substantial move in either direction.
Track markets in real-time
AI-powered analysis, technical indicators and real-time price data.
Join Our Telegram Channel
Breaking market news, AI analysis and trading signals instantly.
Join Channel