

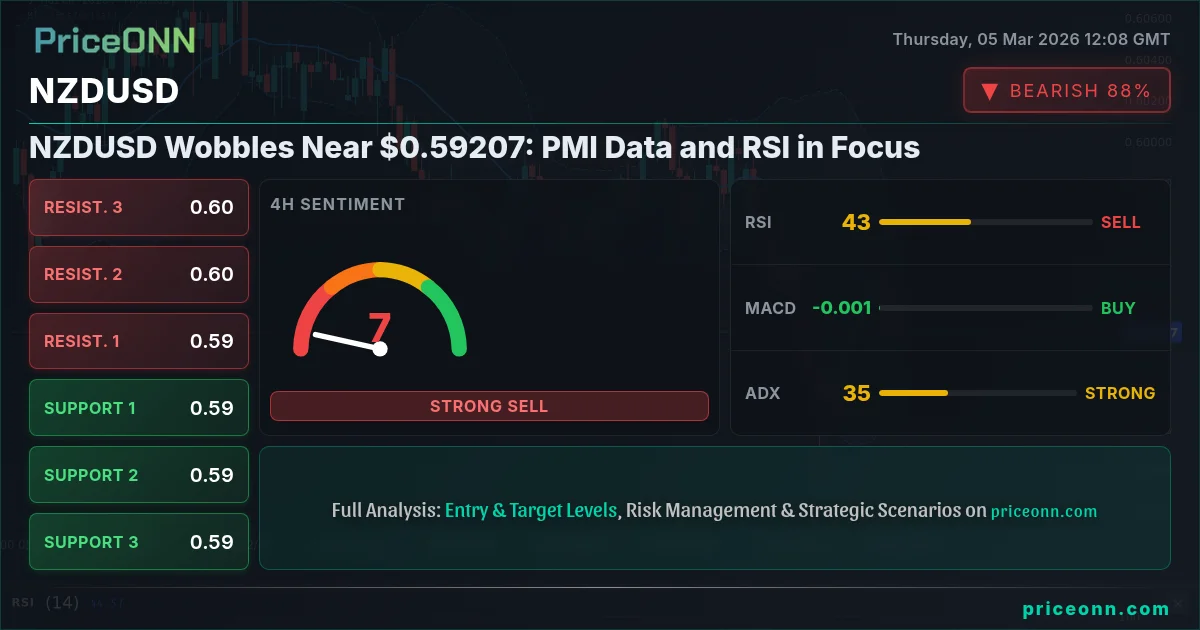
NZDUSD finds itself near $0.59207, a level that's proving to be a key battleground between bulls and bears. The New Zealand dollar's recent surge may be facing a reality check as traders digest incoming economic data and technical indicators flash mixed signals. Is this a temporary pause before another leg up, or the start of a deeper correction?
- RSI at 50.36 on the 1-hour chart indicates neutral momentum, suggesting the recent rally may be losing steam.
- Immediate resistance lies at 0.5923, a break above which could trigger further upside.
- Key support sits at 0.59135, tested multiple times in the last few hours.
- DXY strength is putting pressure on NZDUSD, testing the Kiwi's resilience.
Having tracked NZDUSD through various economic cycles, this current juncture feels particularly delicate. The pair has enjoyed a period of outperformance, fueled by a weaker US dollar and positive sentiment towards the New Zealand economy. However, the strength in the Dollar Index (DXY), currently at 98.71, is beginning to weigh on the pair. Typically, a rising DXY puts downward pressure on major currency pairs like NZDUSD, and this dynamic is playing out today.
Technical Signals: A Mixed Bag
The technical picture for NZDUSD presents a complex narrative. On the 1-hour chart, the RSI sits at 50.36, reflecting neutral momentum. This suggests that the recent buying pressure may be waning, and the pair could be vulnerable to a pullback. However, the Stochastic oscillator on the same timeframe shows a bullish crossover (K=42.27, D=32.44), indicating potential for further upside in the short term.
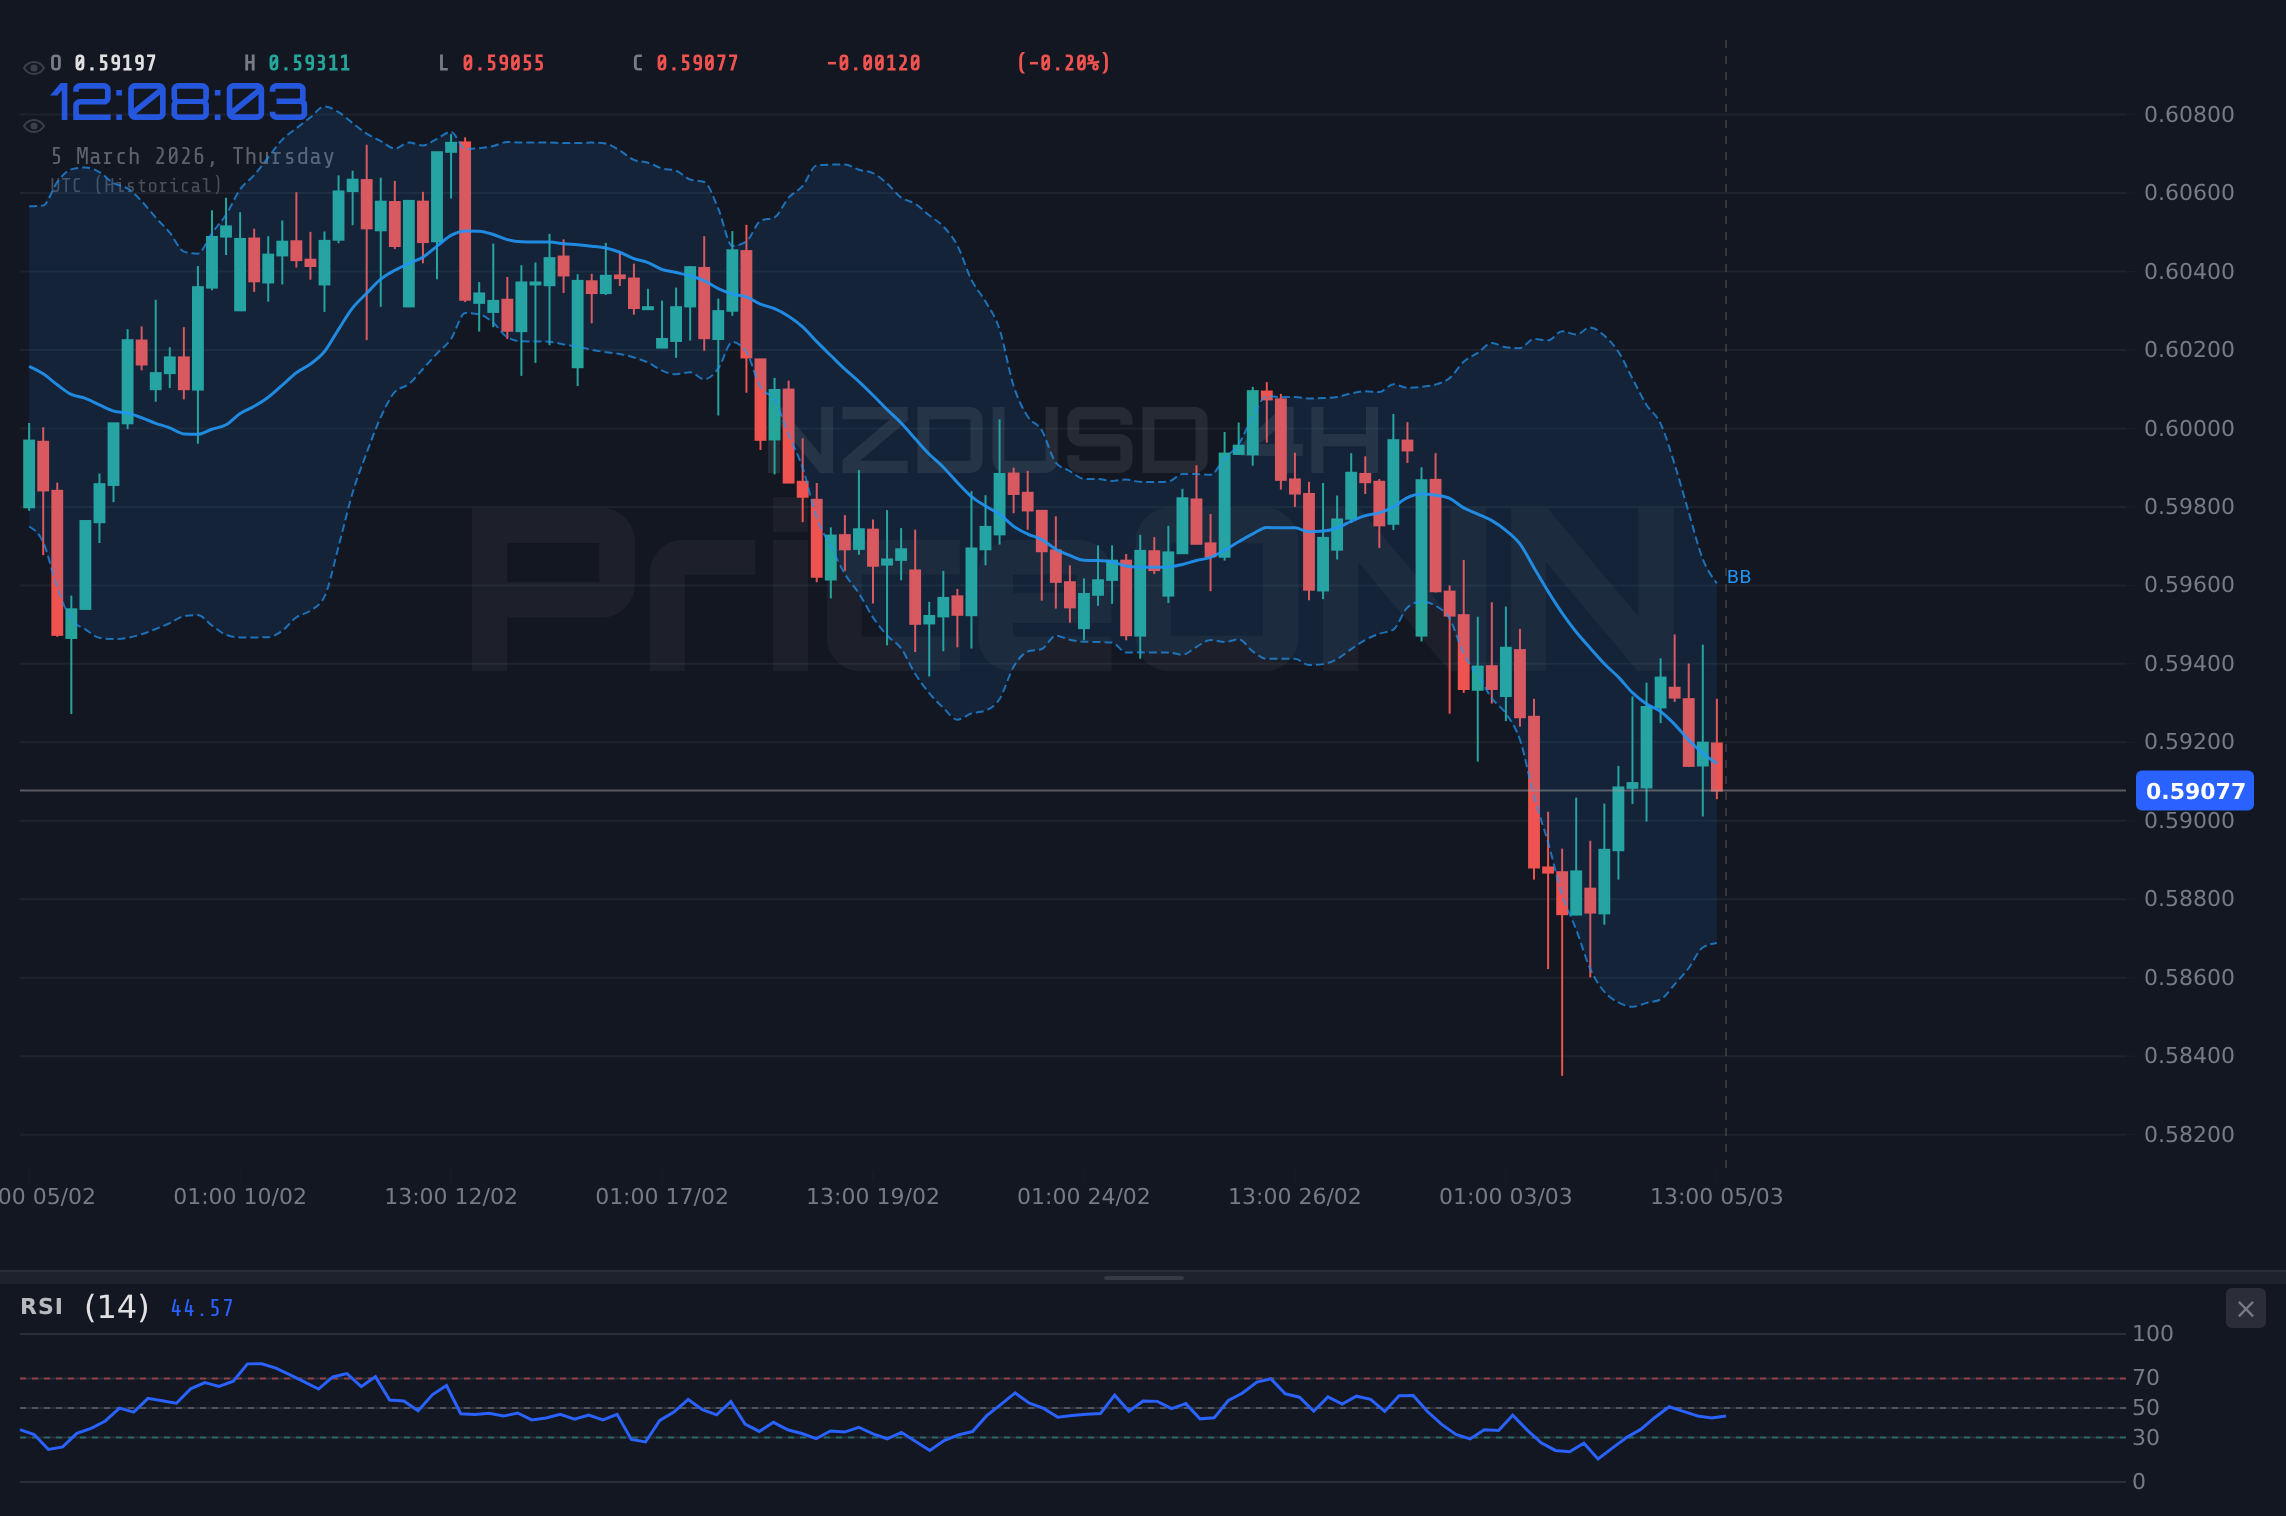
Zooming out to the 4-hour chart, the picture becomes even murkier. The RSI is at 46.48, showing a slight bearish inclination. The ADX, at 34.99, signals a strong downtrend, further supporting the bearish outlook. However, the MACD shows positive momentum, creating a conflicting signal. This divergence between indicators suggests that the market is indecisive, and traders should proceed with caution.
The daily chart paints a slightly more optimistic picture for the bulls. Despite the recent pullback, the overall trend remains bullish, with a strength rating of 82%. The RSI is at 45.56, leaving plenty of room for further upside before reaching overbought territory. However, the Stochastic oscillator is signaling a bearish crossover (K=45.42, D=36.51), cautioning against excessive optimism.
Key Levels to Watch
Identifying key support and resistance levels is crucial for navigating the current market conditions. Immediate resistance lies at 0.5923, the high from the last few hours. A sustained break above this level could open the door for a test of the next resistance at 0.5928. On the downside, immediate support sits at 0.59135, which has been tested multiple times. A break below this level could trigger a deeper correction towards the next support at 0.5909.
Looking at the broader picture, the daily chart reveals more significant levels. Key resistance lies at 0.59652, a level that has acted as a ceiling for previous rallies. On the downside, a major support zone is located around 0.58839, which represents a critical level for the bulls to defend.
Economic Data and Market Sentiment
The upcoming economic data releases are likely to play a significant role in shaping the short-term outlook for NZDUSD. Traders are closely watching the PMI (Purchasing Managers' Index) data, which provides insights into the health of the manufacturing and service sectors. According to recent news, geopolitical tensions and economic data are shaping the market outlook. If the PMI data comes in stronger than expected, it could provide a boost to the New Zealand dollar and fuel further upside in NZDUSD. Conversely, weaker-than-expected data could trigger a sell-off.
Market sentiment is also a key factor to consider. Recent news suggests that the NZD/USD pair has seen a notable surge, driven by a retreat in the US Dollar and buoyed by the strength of the New Zealand economy. If this positive sentiment persists, it could outweigh the negative impact of the stronger DXY and support further gains in NZDUSD.
Trade Recommendation: Watch Zone
Given the mixed technical signals and the uncertainty surrounding the upcoming economic data releases, a clear trading setup has not yet emerged. The current situation warrants a cautious approach, and traders should remain on the sidelines until a clearer picture emerges. A daily close above 0.5928 would open the door for a test of the 0.59652 resistance level, presenting a potential buying opportunity. Conversely, a break below the 0.59135 support could trigger a deeper correction towards the 0.5909 level, offering a potential shorting opportunity.
Trading Forex involves significant risk of loss and is not suitable for all investors. The information provided in this article is for informational purposes only and does not constitute investment advice. Always conduct thorough research and consult with a qualified financial advisor before making any trading decisions.
Bullish vs. Bearish Scenarios
Let's break down the potential scenarios for NZDUSD:
- Bullish Scenario: Strong PMI data fuels a break above 0.5923, leading to a test of 0.5928 and potentially 0.59652. Positive market sentiment towards the New Zealand economy supports further gains.
- Bearish Scenario: Weak PMI data triggers a break below 0.59135, leading to a deeper correction towards 0.5909 and potentially 0.58839. DXY strength weighs on NZDUSD, exacerbating the sell-off.
Ultimately, the direction of NZDUSD will depend on the interplay between economic data, market sentiment, and technical factors. Traders should closely monitor these factors and adjust their strategies accordingly.
Frequently Asked Questions: NZDUSD Analysis
Is NZDUSD a good buy right now?
Given the current level of $0.59207, NZDUSD is not a clear buy right now due to mixed technical signals. A more decisive move above 0.5928 would signal a better buying opportunity, targeting 0.59652.
What is the NZDUSD price forecast for this week?
The NZDUSD price forecast for this week is mixed. A bullish scenario targets 0.59652 with a 60% probability if positive data emerges, while a bearish scenario eyes 0.5909 if support breaks, with a 40% probability.
What are the key support and resistance levels for NZDUSD?
Key support for NZDUSD is at 0.59135, and resistance is at 0.5923. A break of either level will likely dictate the short-term direction.
Why is NZDUSD moving today?
NZDUSD is moving today due to a combination of factors, including DXY strength and anticipation of upcoming PMI data. Market sentiment is also playing a role.
The Outlook: Patience is Key
NZDUSD finds itself at a critical juncture. The technical picture is mixed, and the upcoming economic data releases could provide the catalyst for a breakout or a breakdown. Traders should remain patient and wait for a clearer signal before committing to a directional bias. By closely monitoring the key levels and economic data, investors can position themselves to capitalize on the next move in NZDUSD.
Technical Outlook Summary
| Indicator | Value | Signal |
|---|---|---|
| RSI (14) | 50.36 | Neutral |
| MACD Histogram | Negative | Bearish |
| Stochastic | K=42.27, D=32.44 | Bullish |
| ADX | 15.25 | Weak |
| Bollinger | Upper Band | Watch |
Key Levels
Support Levels
Resistance Levels
Track markets in real-time
AI-powered analysis, technical indicators and real-time price data.
Join Our Telegram Channel
Breaking market news, AI analysis and trading signals instantly.
Join Channel